
News Release
GDP (Third Estimate), Industries, Corporate Profits, State GDP, and State Personal Income, 2nd Quarter 2026; State PCE, 2025
Real gross domestic product (GDP) increased at an annual rate of 2.2 percent in the second quarter of 2026 (April, May, and June), according to the third estimate released today by the U.S. Bureau of Economic Analysis (BEA). In the first quarter, real GDP increased 2.5 percent (revised).
Real GDP was revised up 0.7 percentage point from the second estimate, primarily reflecting upward revisions to investment, consumer spending, and government spending. For more information, refer to the "Technical Notes" below
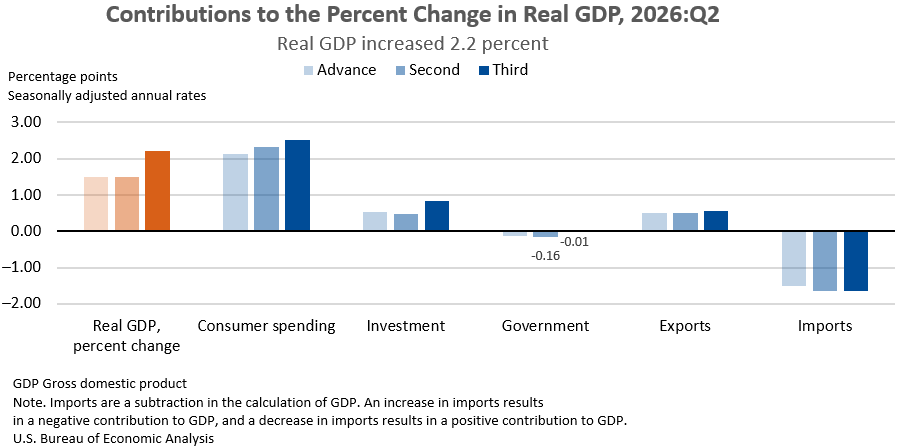
The contributors to the increase in real GDP in the second quarter were consumer spending, investment, and exports. Imports, which are a subtraction in the calculation of GDP, increased.
GDP by industry
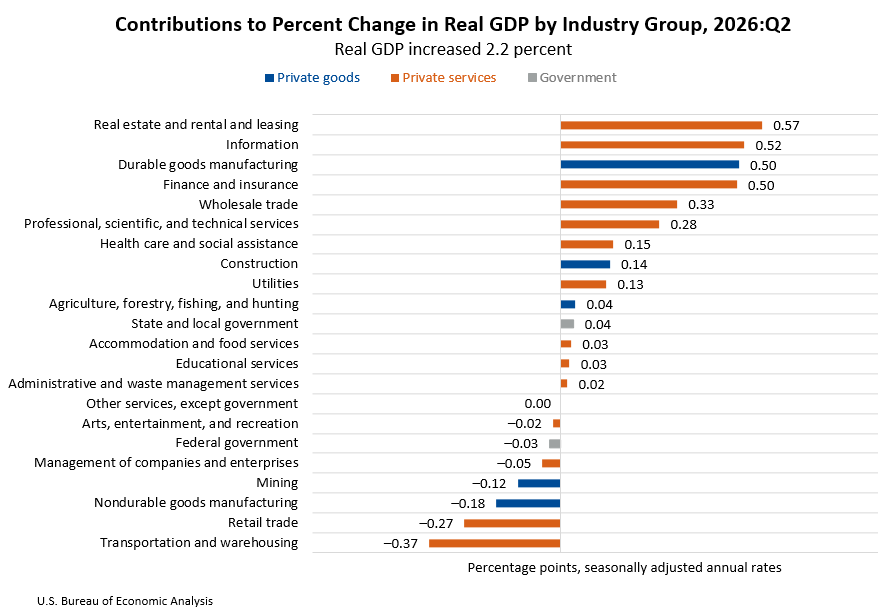
From an industry perspective, the increase in real GDP reflected increases in real value added of 2.5 percent for private services-producing industries, 2.3 percent for private goods-producing industries, and less than 0.1 percent for government. The leading industry contributors to the increase in real GDP were real estate and rental and leasing, information, durable goods manufacturing, and finance and insurance. The leading offsets were decreases in transportation and warehousing, retail trade, and nondurable goods manufacturing.
Related economic measures
Real final sales to private domestic purchasers, the sum of consumer spending and gross private fixed investment, increased 4.6 percent in the second quarter, revised up 0.4 percentage point from the previous estimate.
Real gross output increased 5.0 percent in the second quarter, reflecting increases of 6.0 percent for private services-producing industries, 3.0 percent for private goods-producing industries, and 2.6 percent for government.
Real gross domestic income (GDI) increased 2.6 percent in the second quarter, revised up 0.4 percentage point from the previous estimate. The average of real GDP and real GDI increased 2.4 percent in the second quarter, revised up 0.6 percentage point.
Profits from current production (corporate profits with inventory valuation and capital consumption adjustments) increased $384.0 billion in the second quarter, revised down $16.9 billion.
The price index for gross domestic purchases increased 5.6 percent in the second quarter, revised down 0.2 percentage point from the previous estimate. The personal consumption expenditures (PCE) price index increased 5.0 percent, revised down 0.3 percentage point, and the PCE price index excluding food and energy increased 3.3 percent, also revised down 0.3 percentage point.
| Real GDP and Related Measures | ||||
|---|---|---|---|---|
| [Percent change (SAAR) from 2026:Q1 to 2026:Q2] | ||||
| Advance Estimate | Second Estimate | Third Estimate | ||
| Real GDP | 1.5 | 1.5 | 2.2 | |
| Current-dollar GDP | 7.9 | 8.0 | 8.5 | |
| Real final sales to private domestic purchasers | 3.9 | 4.2 | 4.6 | |
| Real GDI | … | 2.2 | 2.6 | |
| Average of real GDP and real GDI | … | 1.8 | 2.4 | |
| Gross domestic purchases price index | 5.7 | 5.8 | 5.6 | |
| PCE price index | 5.1 | 5.3 | 5.0 | |
| PCE price index excluding food and energy | 3.4 | 3.6 | 3.3 | |
| SAAR seasonally adjusted at annual rates U.S. Bureau of Economic Analysis | ||||
GDP by state
From a regional perspective, real GDP increased in 44 states and the District of Columbia in the second quarter of 2026, with the percent change at an annual rate ranging from 4.0 percent in New York to –2.3 percent in West Virginia.
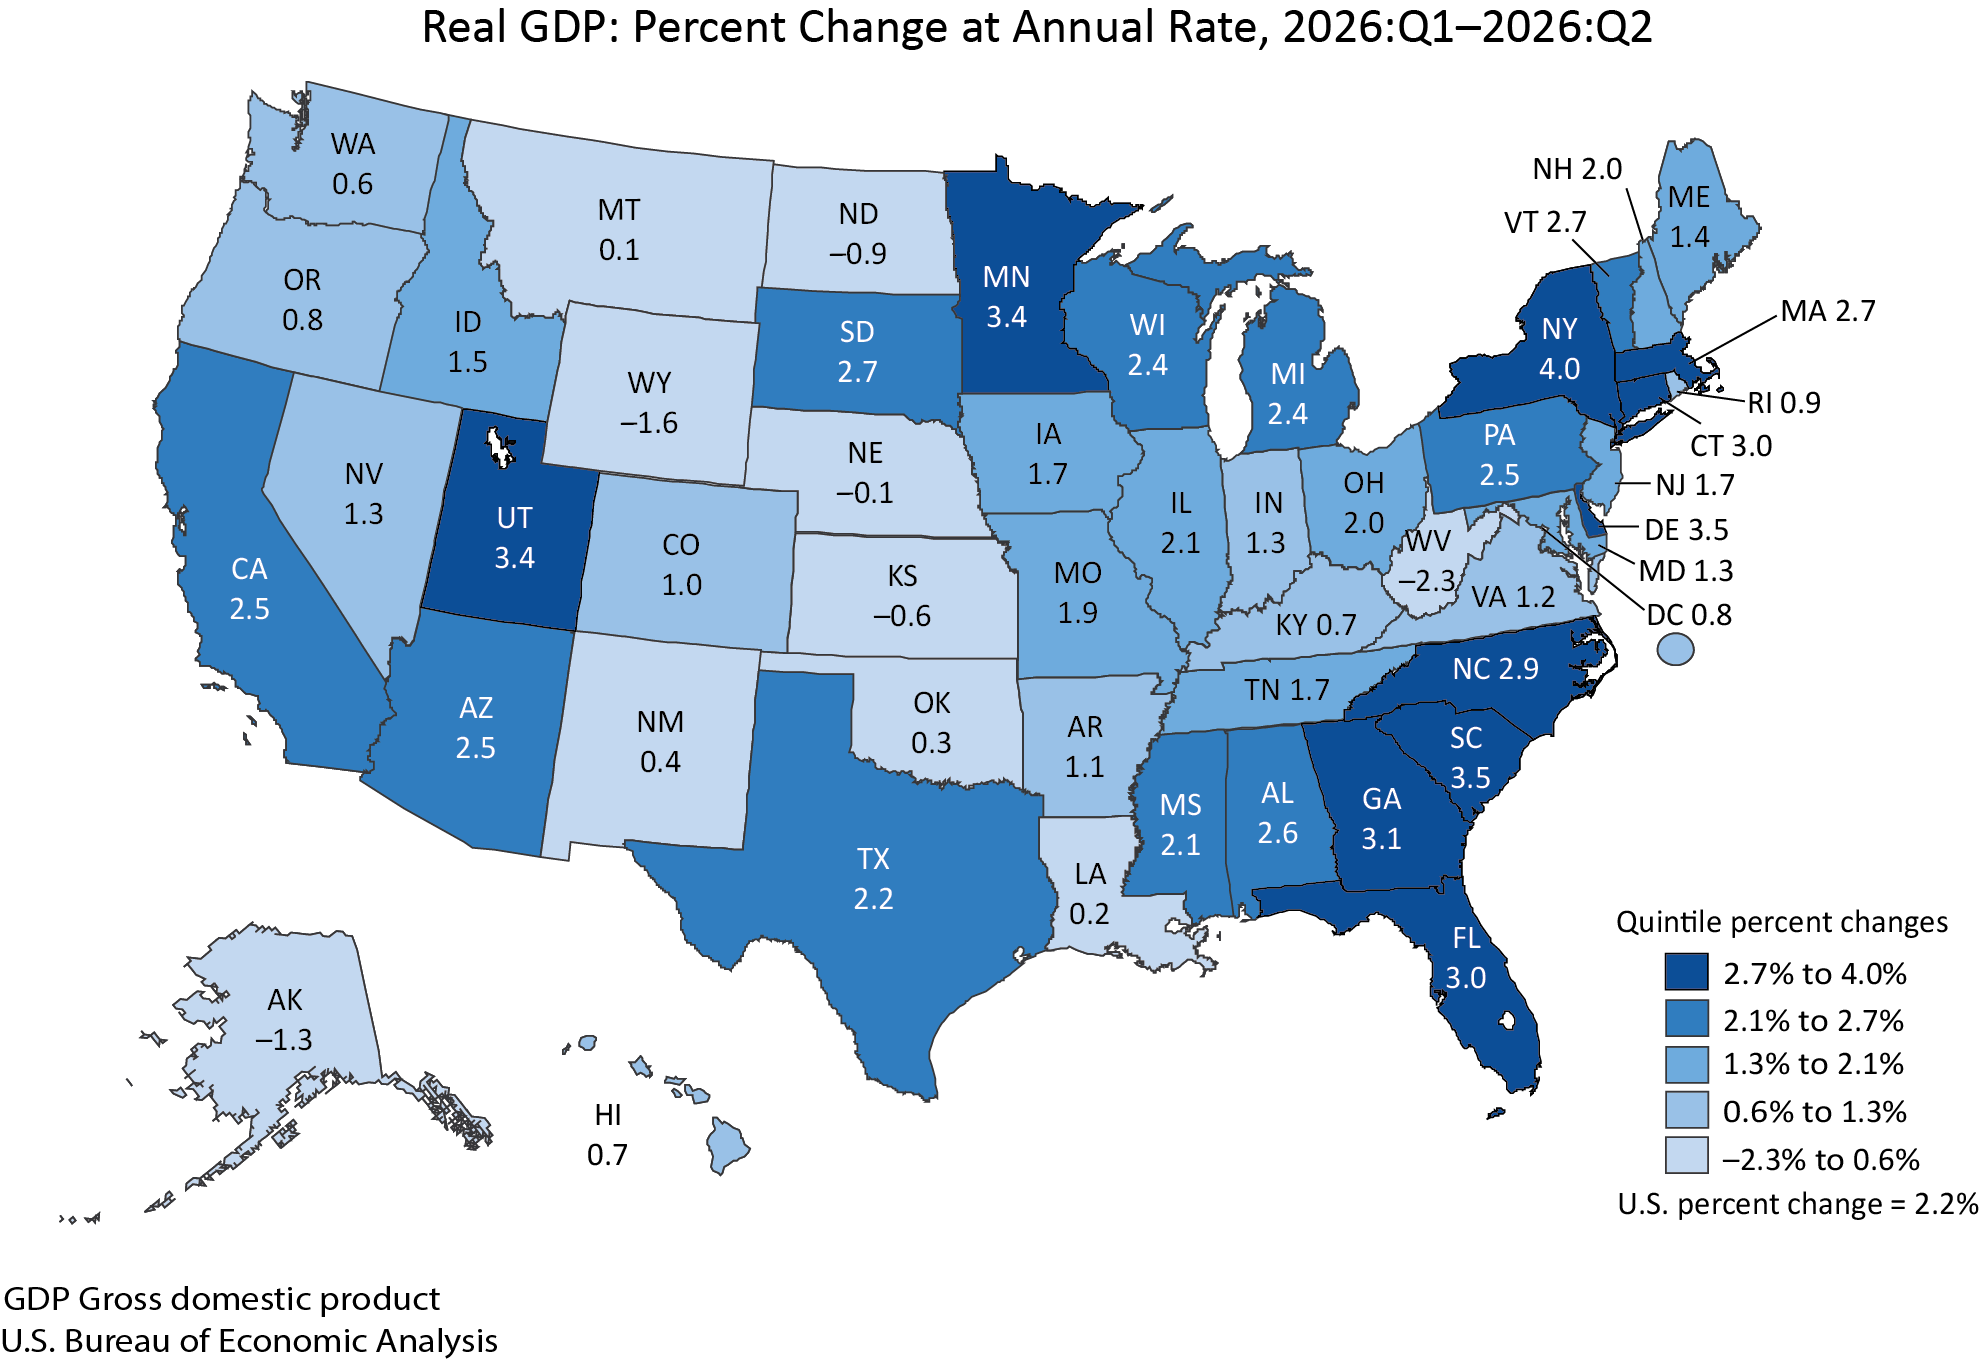
Finance and insurance was the leading contributor to the increase in real GDP in New York and Delaware. Mining was the leading contributor to the decrease in West Virginia and Wyoming.
Personal income by state
In the second quarter of 2026, current-dollar personal income increased $314.3 billion, or 4.7 percent at an annual rate. Personal income increased in 49 states and the District of Columbia, with the percent change at an annual rate ranging from 6.4 percent in Wisconsin to –4.2 percent in North Dakota.
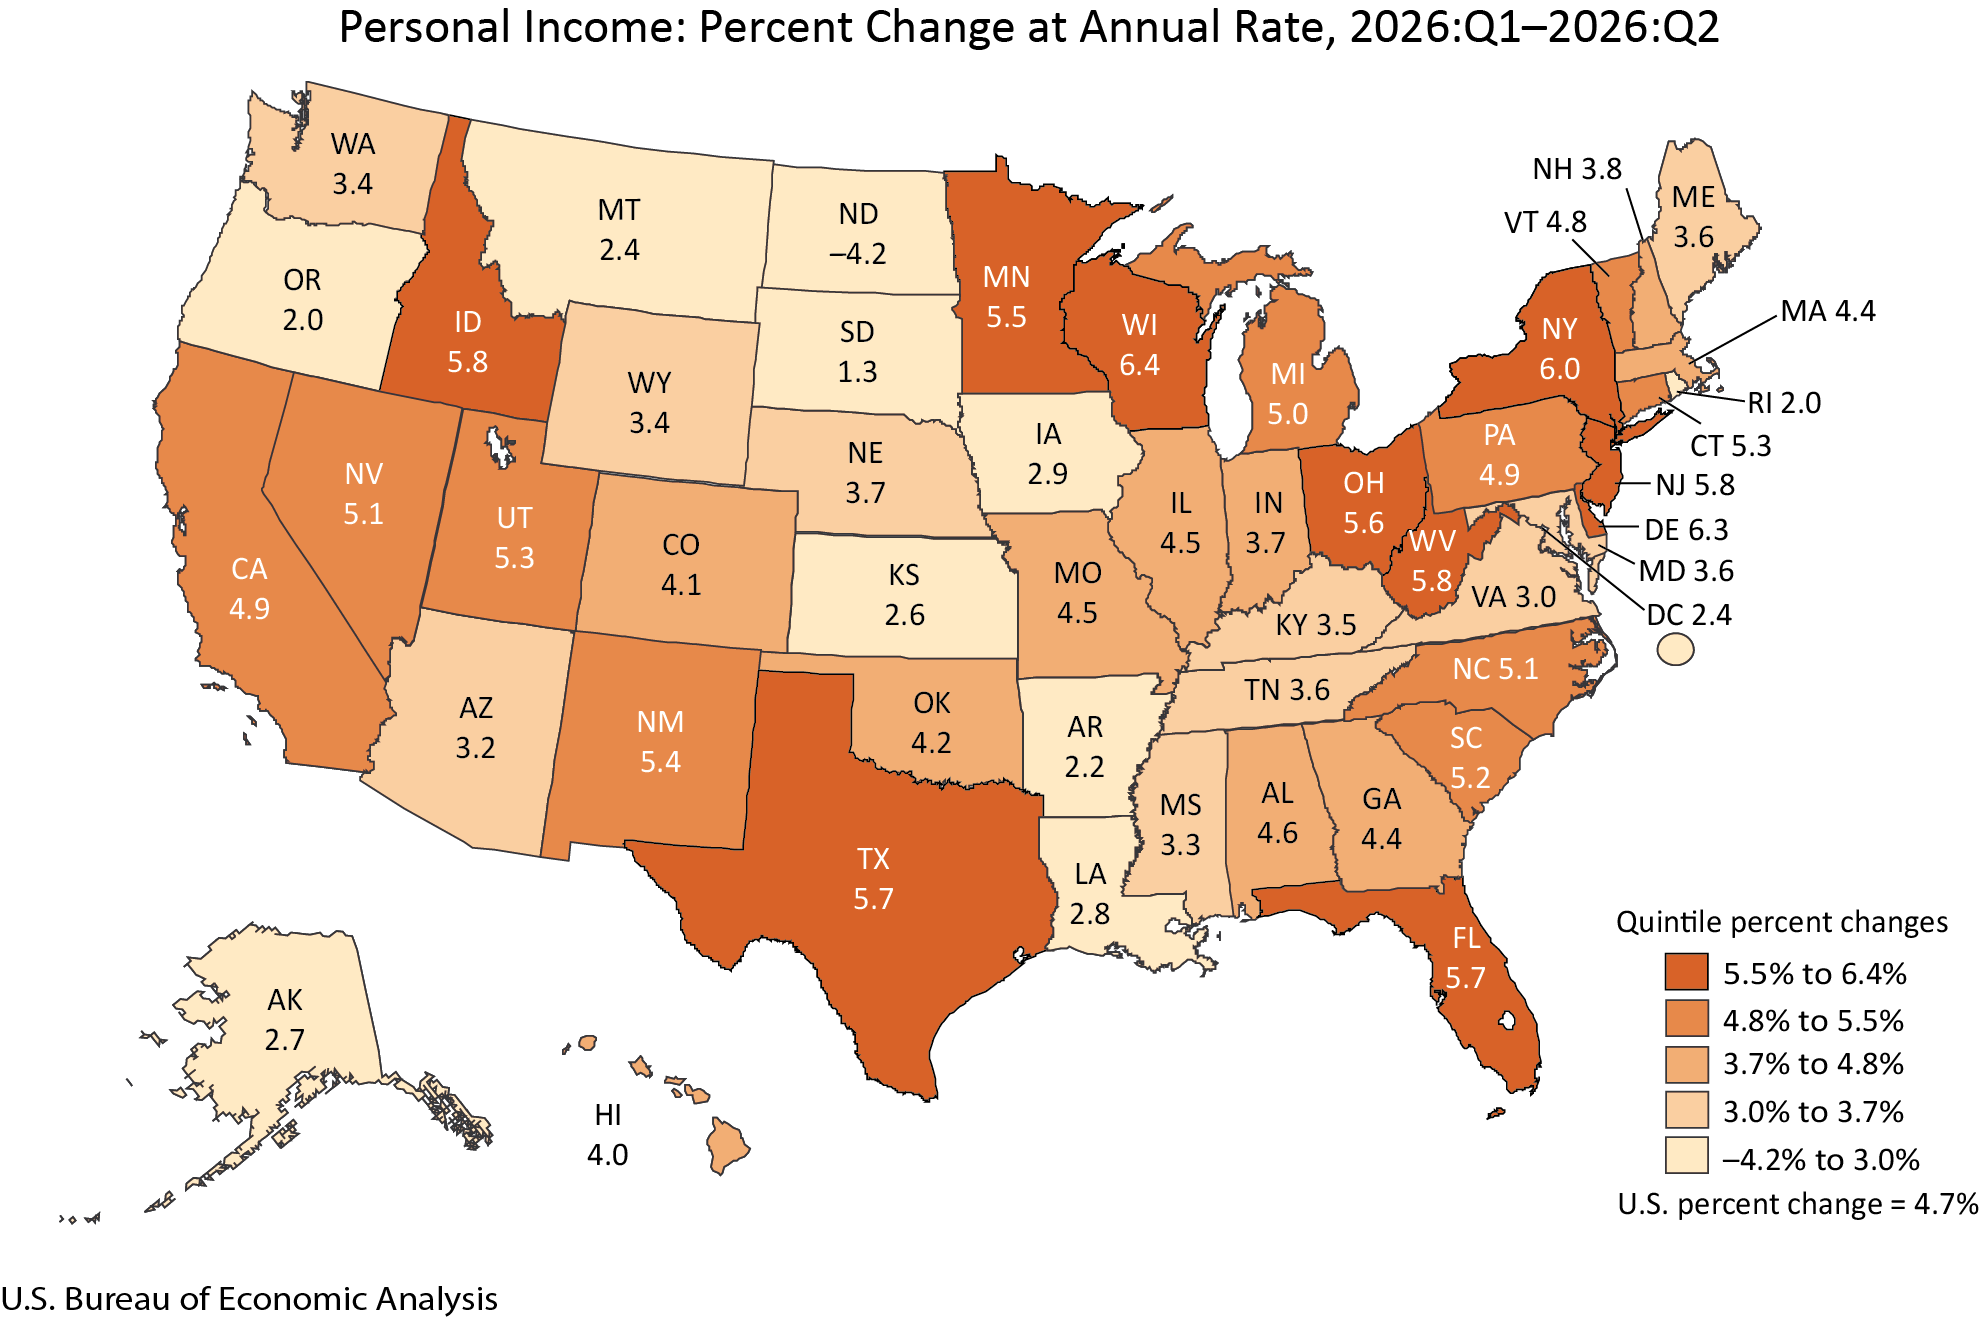
Earnings (compensation plus proprietors’ income) increased in 48 states and the District of Columbia. The percent change in earnings ranged from 7.3 percent in Minnesota to –9.3 percent in North Dakota.
Personal current transfer receipts increased in 48 states and declined in the District of Columbia. The percent change in transfer receipts ranged from 13.0 percent in Wisconsin to –3.9 percent in Oregon.
Property income (dividends, interest, and rent) increased in all 50 states and the District of Columbia. The percent change ranged from 5.1 percent in Tennessee to 3.3 percent in Iowa.
Personal consumption expenditures (PCE) by state
In 2025, current-dollar PCE increased 5.3 percent, increasing in 14 of the 16 major categories for which BEA prepares estimates. PCE by state increased in all 50 states and the District of Columbia, with the percent change ranging from 7.0 percent in Florida to 4.2 percent in California.
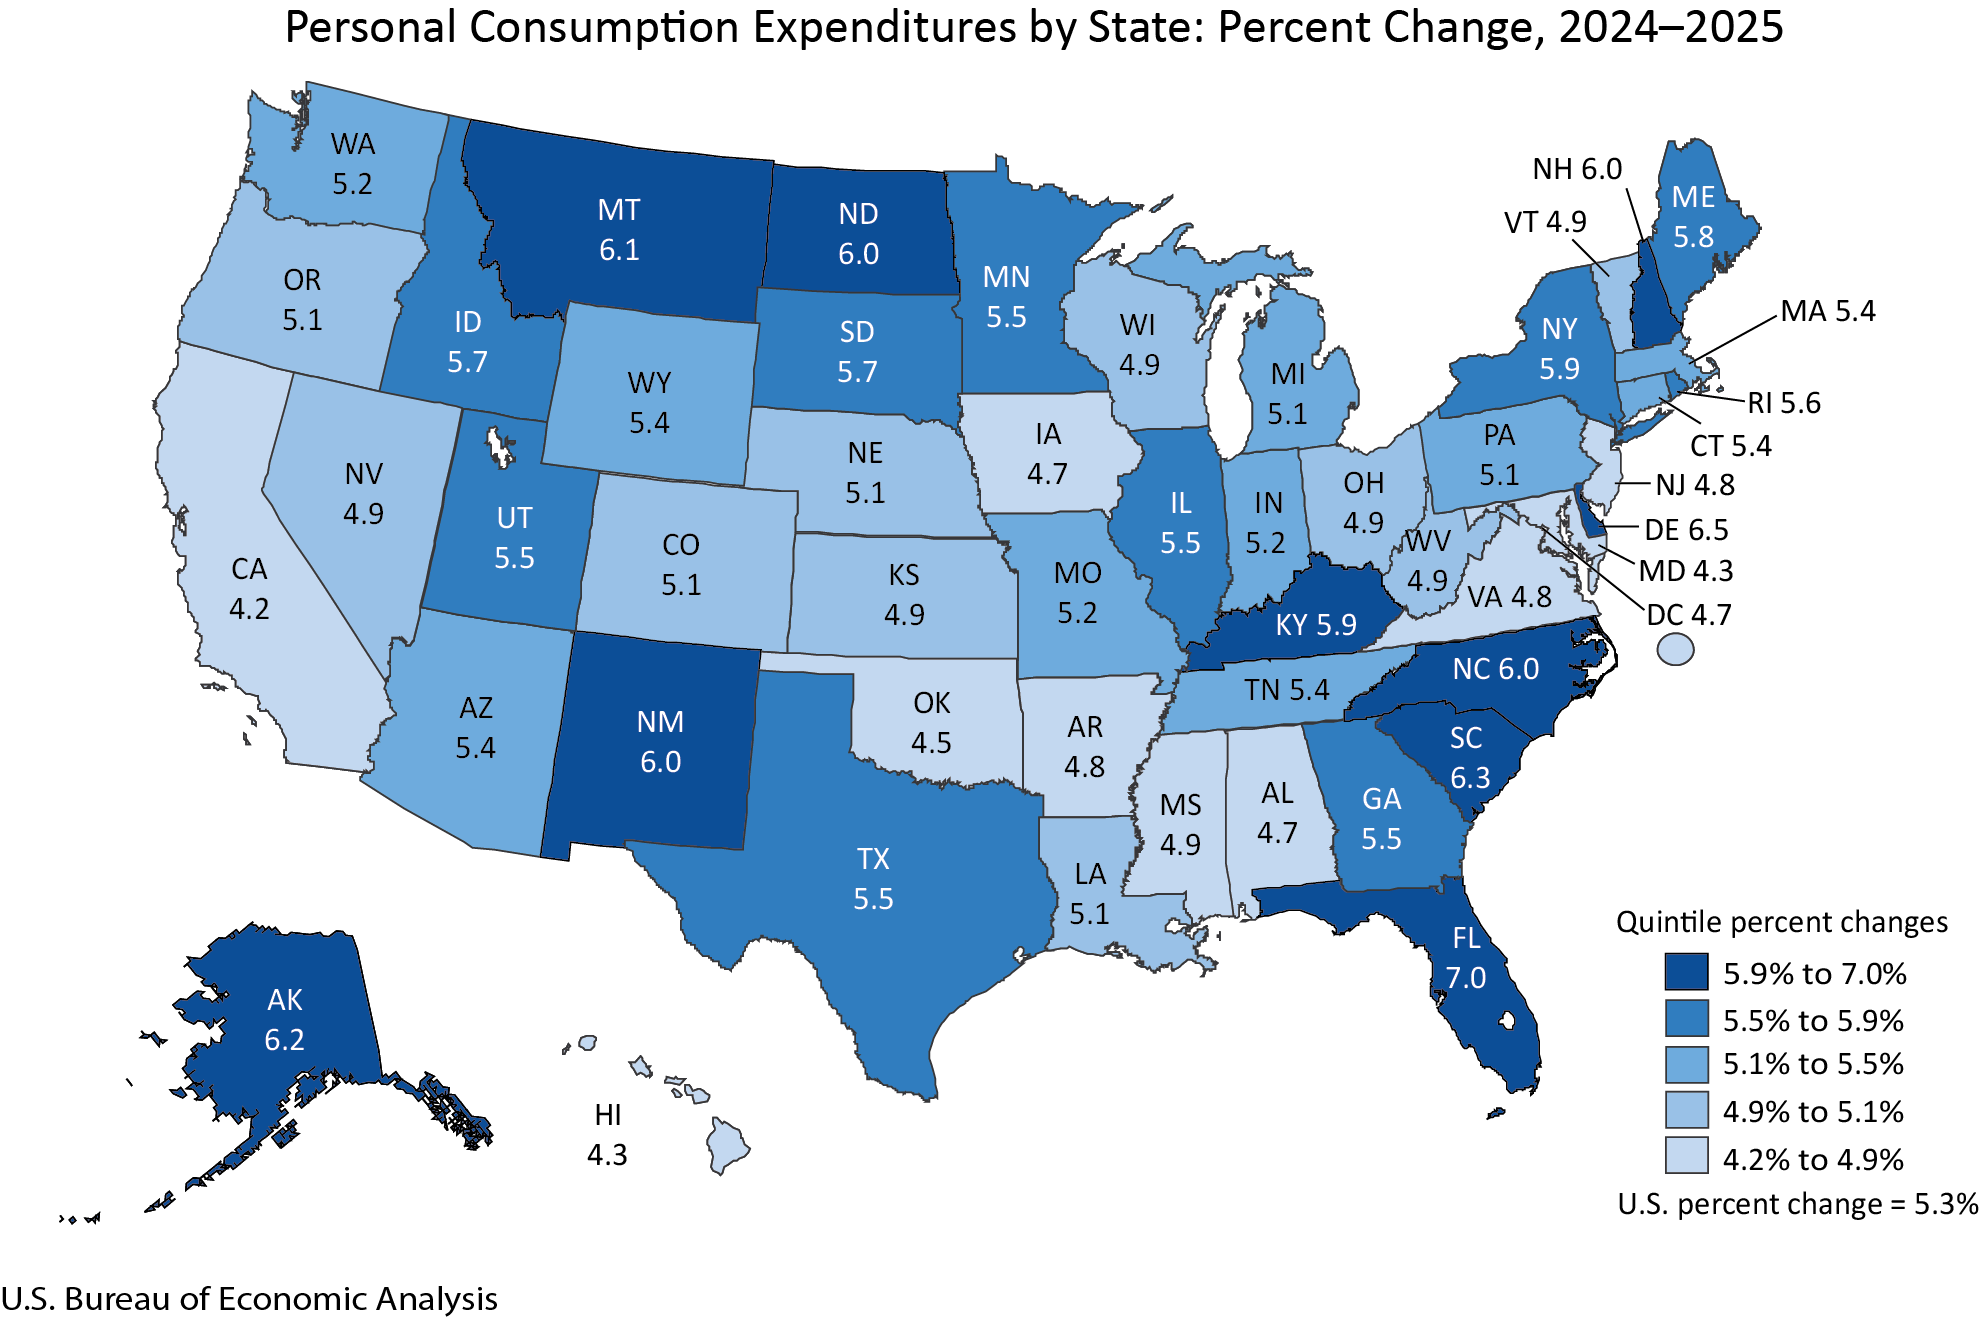
Health care and housing and utilities were the leading contributors to the increases in PCE in most states, including Florida.
Today's release also includes results from the 2026 annual update of the National Economic Accounts, which include the National Income and Product Accounts and the Industry Economic Accounts. The update covered the first quarter of 2021 through the first quarter of 2026 and resulted in revisions to GDP, GDP by industry, GDI, and their major components. The reference year remains 2017. Today’s release also includes the results of BEA's annual updates of GDP by state, personal income by state, and PCE by state.
With today's release, most data are available through BEA's Interactive Data application on the BEA website (www.bea.gov). Refer to "Information on 2026 Annual Updates to the National, Industry, State, and County Statistics" for the data availability schedule and a table showing current-dollar revisions, major source data, and conceptual changes for components of GDP, national income, and personal income. An article describing the update in more detail is posted in the Survey of Current Business.
Updates for the First Quarter of 2026
For the first quarter of 2026, real GDP is now estimated to have increased 2.5 percent, an upward revision of 0.4 percentage point from the previously published estimate, primarily reflecting upward revisions to exports of services and consumer spending on both goods and services.
Real final sales to private domestic purchasers is now estimated to have increased 1.8 percent in the first quarter, an upward revision of 0.1 percentage point from the previously published estimate.
Real gross output is now estimated to have increased 2.3 percent, an upward revision of 0.6 percentage point. Private goods-producing industries decreased 0.9 percent, a downward revision of 0.9 percentage point. Private services-producing industries increased 2.9 percent, an upward revision of 1.2 percentage points. Government increased 5.3 percent, an upward revision of 0.4 percentage point.
The price index for gross domestic purchases is now estimated to have increased 3.2 percent in the first quarter, a downward revision of 0.4 percentage point. The PCE price index increased 4.2 percent, also revised down 0.4 percentage point. Excluding food and energy, the PCE price index increased 3.9 percent, revised down 0.5 percentage point.
Real GDI is now estimated to have increased 2.5 percent in the first quarter, 1.3 percentage points higher than previously estimated. The leading contributor to the upward revision was compensation, based primarily on new first-quarter wage and salary data from the U.S. Bureau of Labor Statistics’ (BLS) Quarterly Census of Employment and Wages program. The average of real GDP and real GDI is now estimated to have increased 2.5 percent in the first quarter, 0.8 percentage point higher than previously estimated.
Profits from current production (corporate profits with inventory valuation and capital consumption adjustments) is now estimated to have increased $63.4 billion in the first quarter, a downward revison of $11.0 billion.
| First Quarter 2026 | |||
|---|---|---|---|
| Previous Estimate | Revised Estimate | ||
| (Percent change (SAAR) from preceding quarter) | |||
| Real GDP | 2.1 | 2.5 | |
| Current-dollar GDP | 5.8 | 5.8 | |
| Real final sales to private domestic purchasers | 1.7 | 1.8 | |
| Real GDI | 1.2 | 2.5 | |
| Average of real GDP and real GDI | 1.7 | 2.5 | |
| Gross domestic purchases price index | 3.6 | 3.2 | |
| PCE price index | 4.6 | 4.2 | |
| PCE price index excluding food and energy | 4.4 | 3.9 | |
| SAAR seasonally adjusted at annual rates U.S. Bureau of Economic Analysis | |||
Next release: October 29, 2026, at 8:30 a.m. EDT
GDP (Advance Estimate), 3rd Quarter 2026
Technical Notes
Sources of revisions to real GDP in the third estimate
Sources of revision to real GDP in the third estimate
Real GDP increased at an annual rate of 2.2 percent (0.6 percent at a quarterly rate 1) in the second quarter, an upward revision of 0.7 percentage point, primarily reflecting upward revisions to investment, consumer spending, and government spending. More information on the source data and BEA assumptions that underlie the second-quarter estimate is shown in the key source data and assumptions table.
- The upward revision to investment reflected upward revisions to both private inventory investment and private fixed investment.
- The revision to private inventory investment primarily reflected upward revisions to nonfarm inventory investment (led by wholesale trade; other industries; and mining, utilities, and construction), primarily based on new and revised U.S. Census Bureau inventory data, and farm inventory investment (both crops and livestock), based on data from the U.S. Department of Agriculture.
- The leading contributors to the revision to private fixed investment were nonresidential structures (led by commercial and health care, mainly data centers), based on revised U.S. Census Bureau Value of Construction Put in Place data for May and June, and residential investment (led by improvements), based on revised June remodelers' payroll data from the BLS Current Employment Statistics.
- The upward revision to consumer spending reflected upward revisions to services and goods.
- Within services, the upward revision was led by recreation services (mainly admissions to specified spectator amusements) and other services (mainly social services and religious activities), based on newly available and updated data from the U.S. Census Bureau’s Quarterly Services Survey. These upward revisions were partly offset by a downward revision to transportation services (mainly air transportation), based on newly available data from the Bureau of Transportation Statistics.
- Within goods, the upward revision was led by recreational goods and vehicles (mainly information processing equipment), based on revised U.S. Census Bureau Monthly Retail Trade Survey data for May and June as well as an updated price index used for deflation (refer to "Information on 2026 Annual Updates to the National, Industry, State, and County Statistics" for details).
- The upward revision to government spending was mainly to federal defense (led by intermediate goods and services purchased), based on updated BEA seasonal adjustment factors for defense spending.
Related Interactive Data Tables
For the statistics highlighted in this release, as well as historical time series for these statistics, see the below data tables in BEA’s interactive data application.
National GDP and related measures
Table 1.1.1. Percent Change From Preceding Period in Real GDP
Table 1.5.2. Contributions to Percent Change in Real GDP, Expanded Detail
Table 1.4.1. Percent Change From Preceding Period in Real GDP, Real Gross Domestic Purchases, and Real Final Sales to Domestic Purchasers
Table 1.6.7. Percent Change From Preceding Period in Prices for Gross Domestic Purchases
Table 1.7.1. Percent Change From Preceding Period in Real GDP, Real Gross National Product, and Real Net National Product
Table 6.16D. Corporate Profits by Industry
GDP by industry
Percent Changes in Chain-Type Quantity Indexes for Value Added by Industry
Contributions to Percent Change in Real GDP by Industry
Percent Changes in Chain-Type Quantity Indexes for Gross Output by Industry
GDP by state
Table SQGDP1. Quarterly GDP by State—Percent Change at Annual Rates From Preceding Period in Real GDP
Table SQGDP11. Industry Contributions to Percent Change in Real GDP by State
Personal income by state
Table SQINC1. Quarterly Personal Income by State—Percent Change at Annual Rates From Preceding Period
Table SQINC4. Quarterly Personal Income by State—Percent Change by Major Component
PCE by state
Table SAPCE1. PCE by Major Type of Product—Percent Change From Preceding Period
Table SAPCE5. Category Contributions to Percent Change in PCE by State
Note. With the next releases of these statistics, today’s data will be superseded, and the links above will reflect the latest data. The original data featured in this release can then be accessed in BEA’s Data Archive.
1. Percent changes in quarterly seasonally adjusted series are displayed at annual rates, unless otherwise specified. For more information, refer to the FAQ “Why does BEA publish percent changes in quarterly series at annual rates?”.