
News Release
Outdoor Recreation Economic Statistics, U.S. and States, 2024
New Statistics for 2024; Updates for 2020–2023
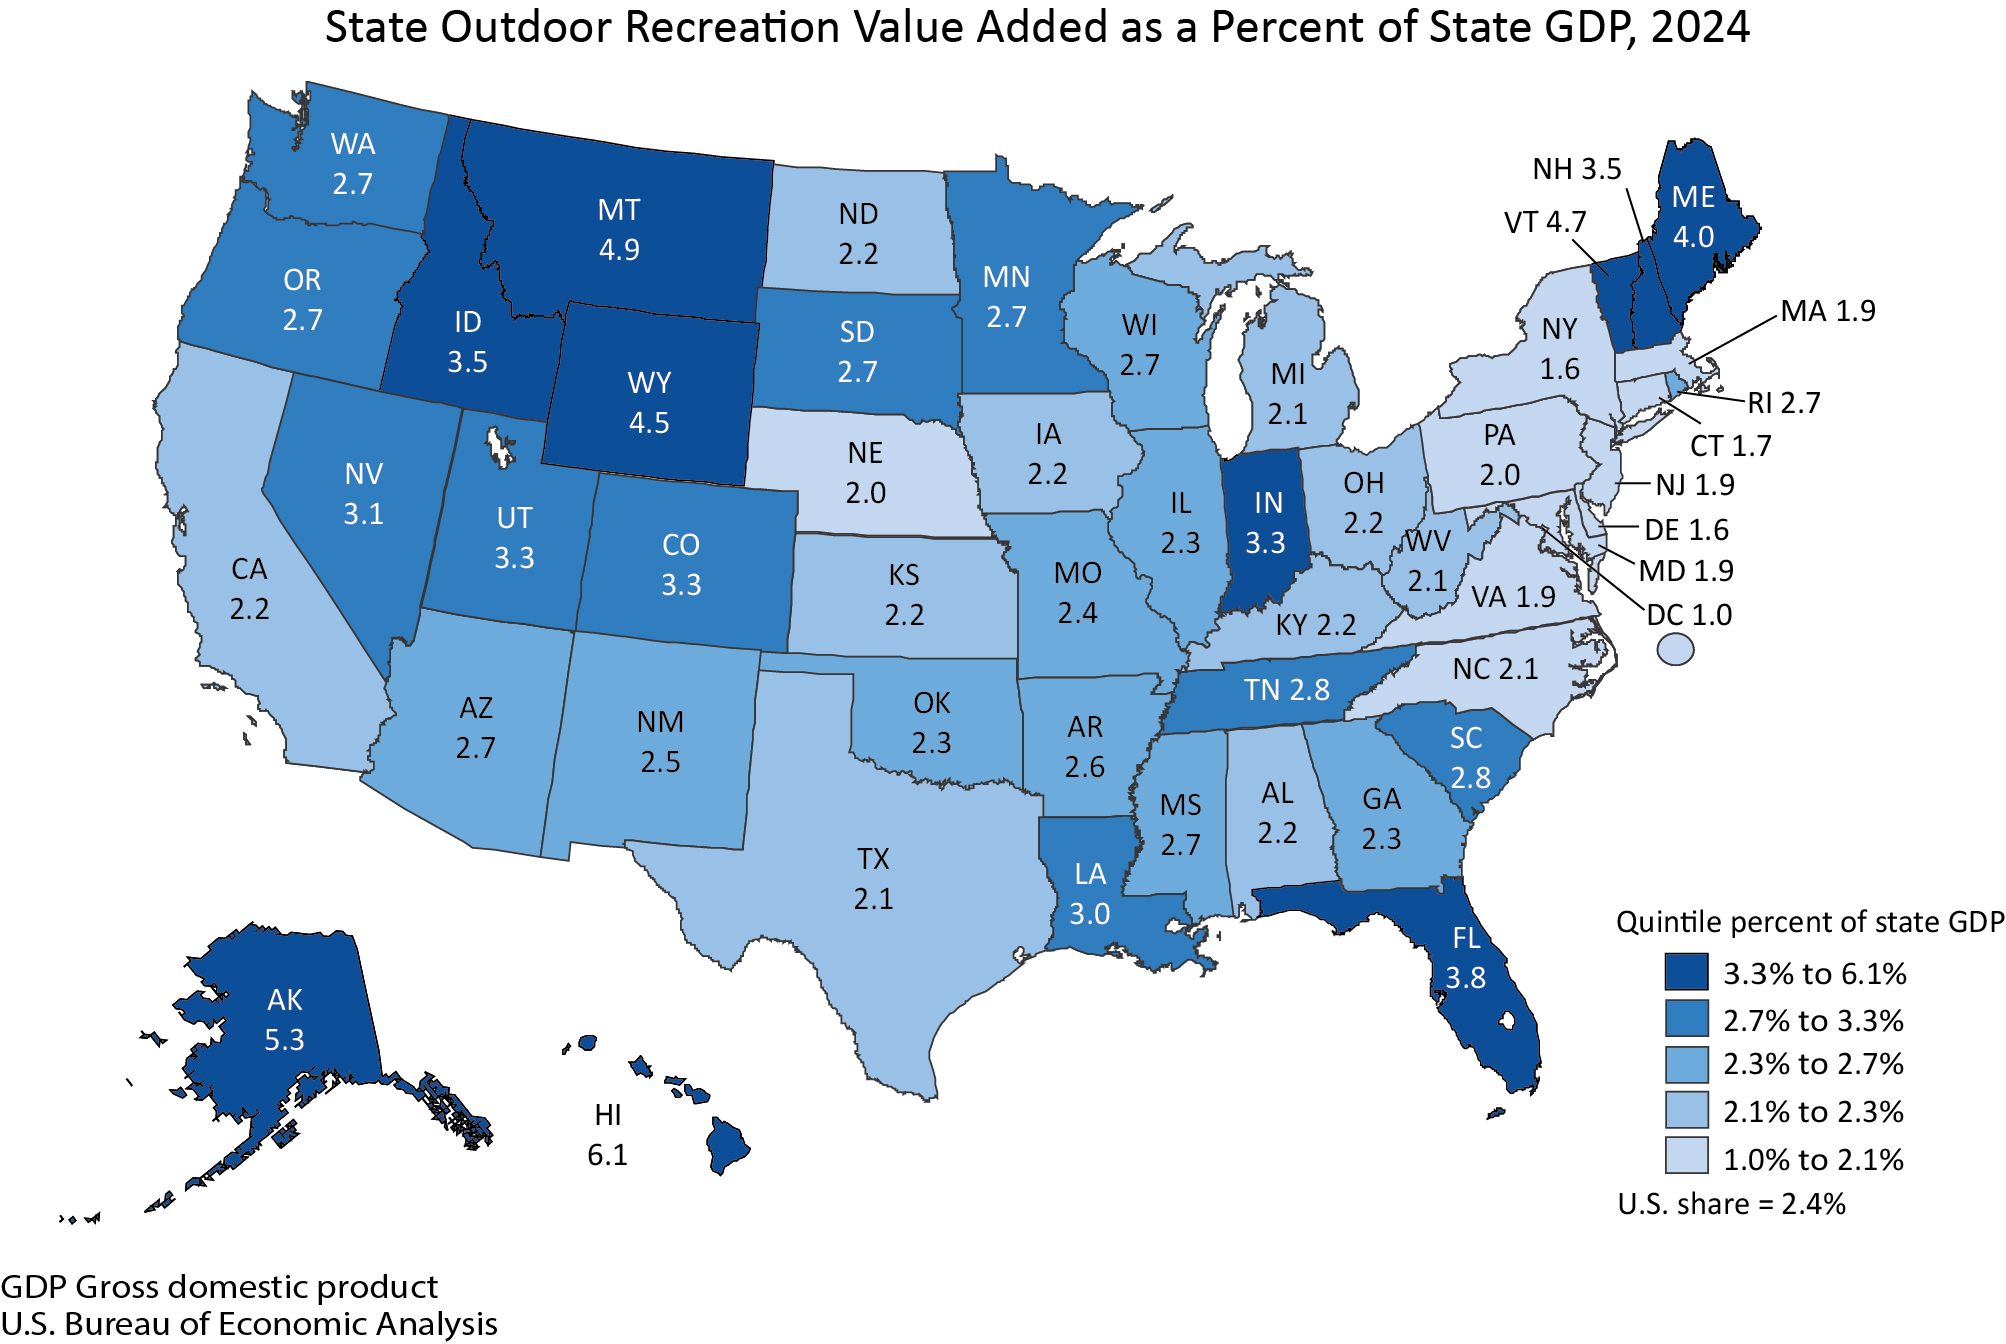
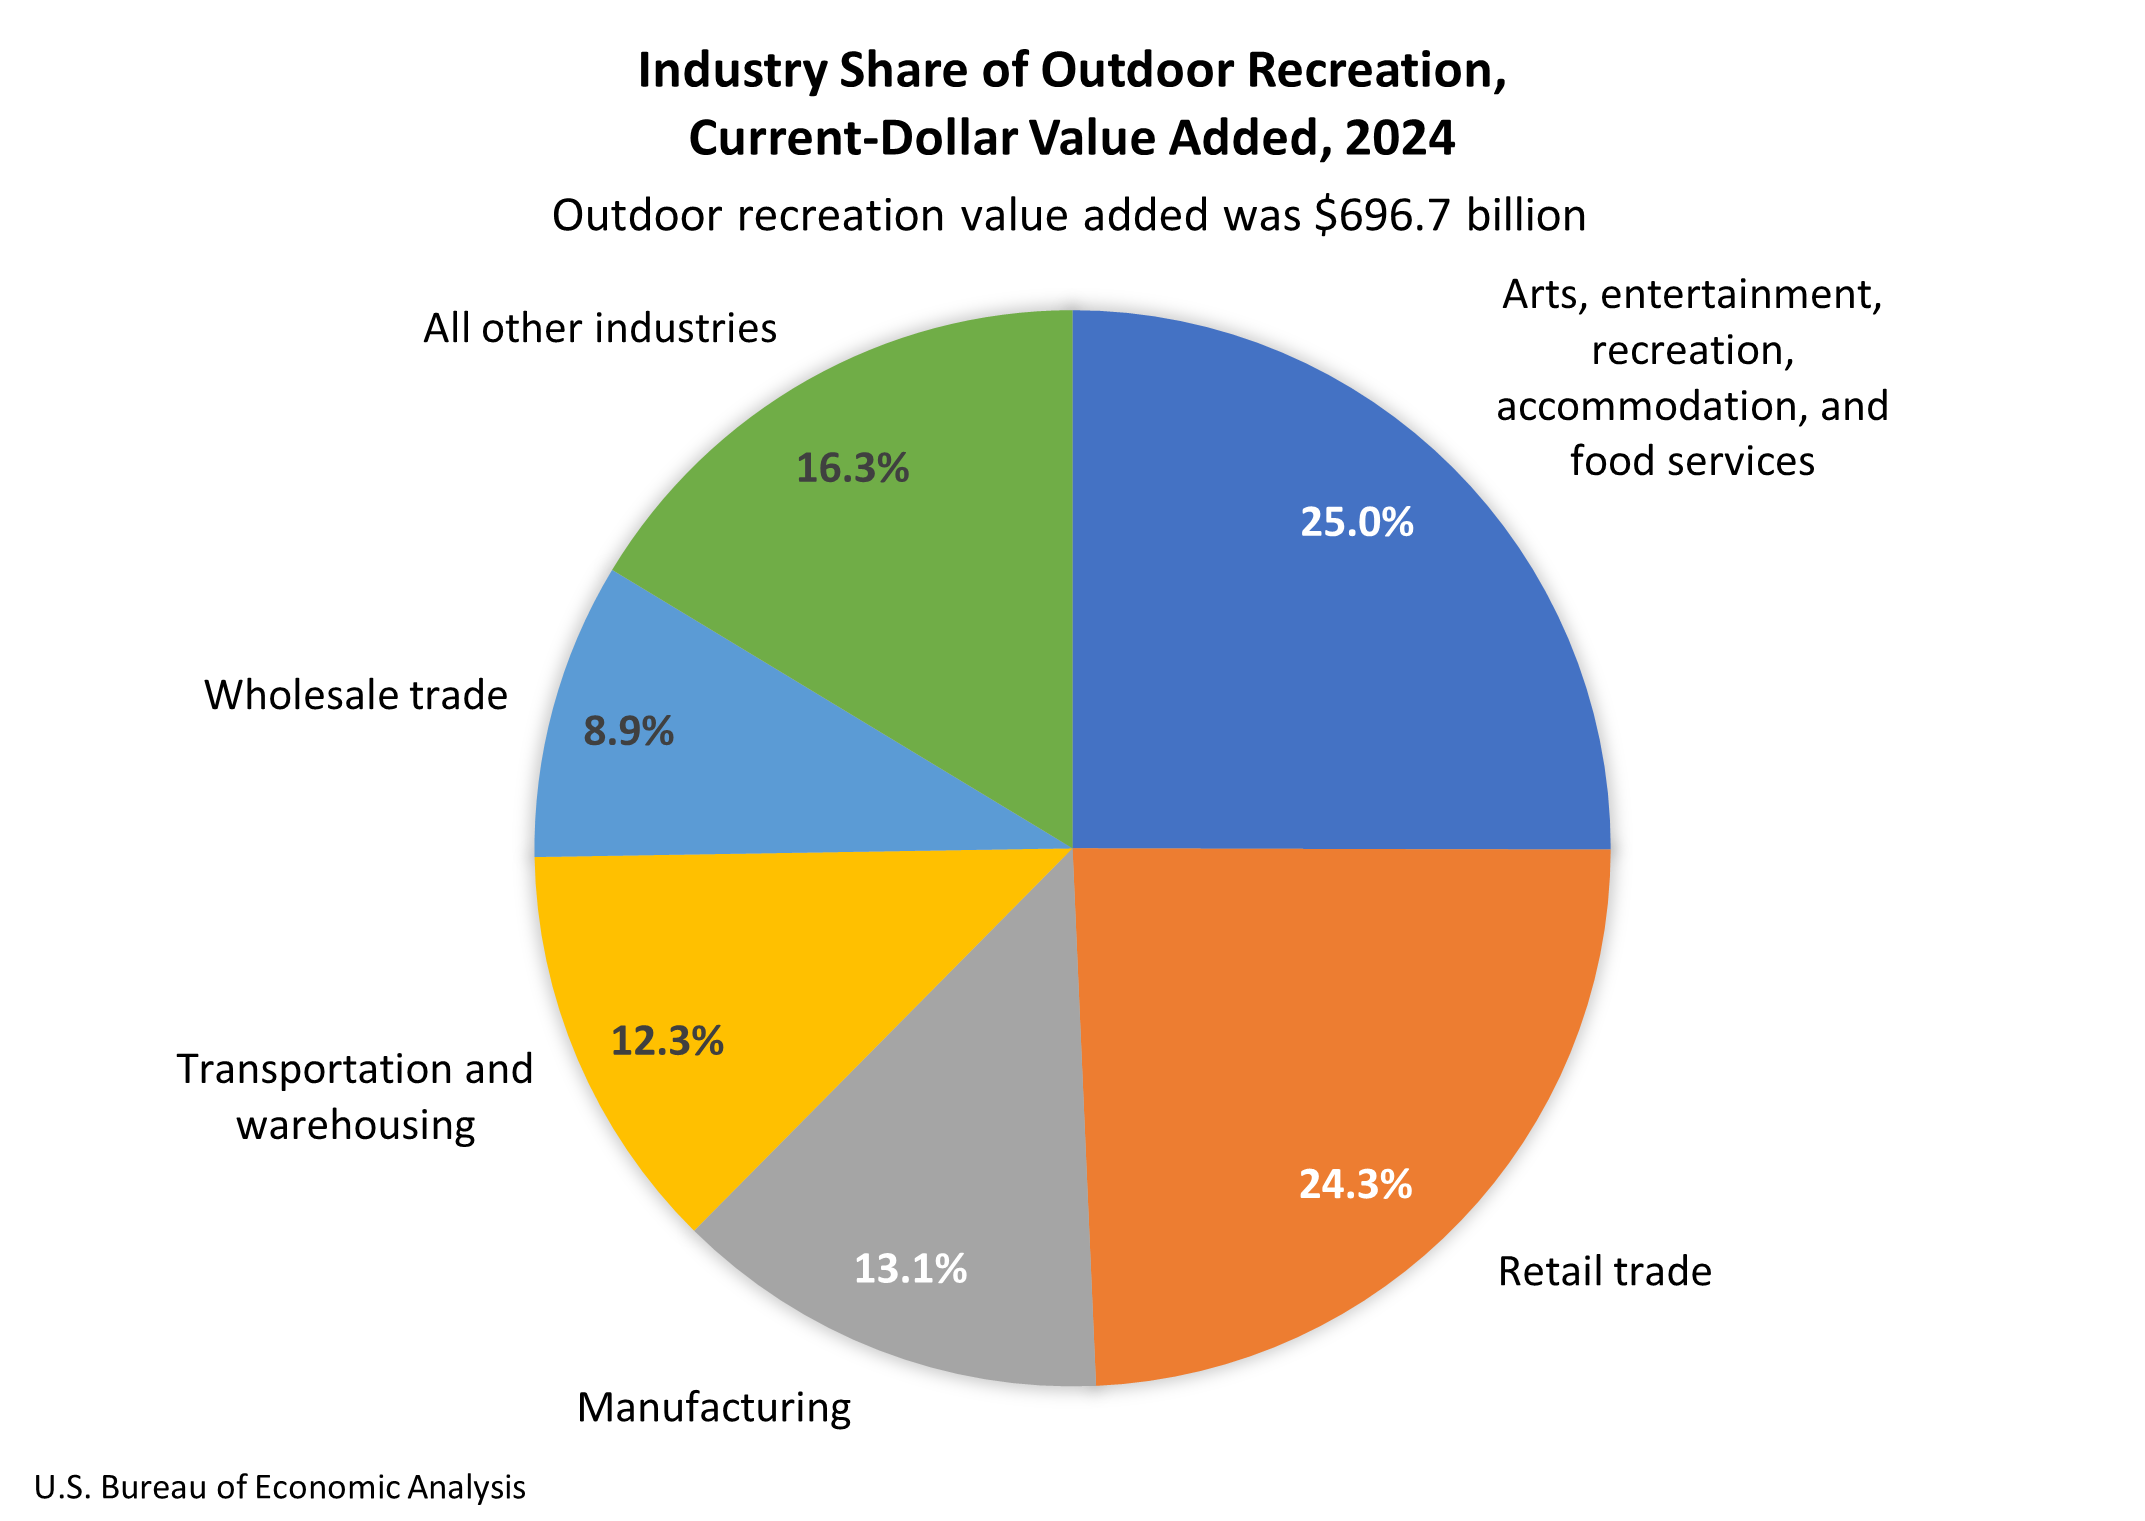
Today, the U.S. Bureau of Economic Analysis released new statistics measuring the outdoor recreation economy for the nation, all 50 states, and the District of Columbia. The new U.S. data show the value added of the outdoor recreation economy accounted for 2.4 percent ($696.7 billion) of current-dollar gross domestic product (GDP) for the nation in 2024 (national table 2). Across states and the District of Columbia, value added for outdoor recreation as a share of state GDP ranged from 6.1 percent in Hawaii to 1.0 percent in the District of Columbia (state table 1).
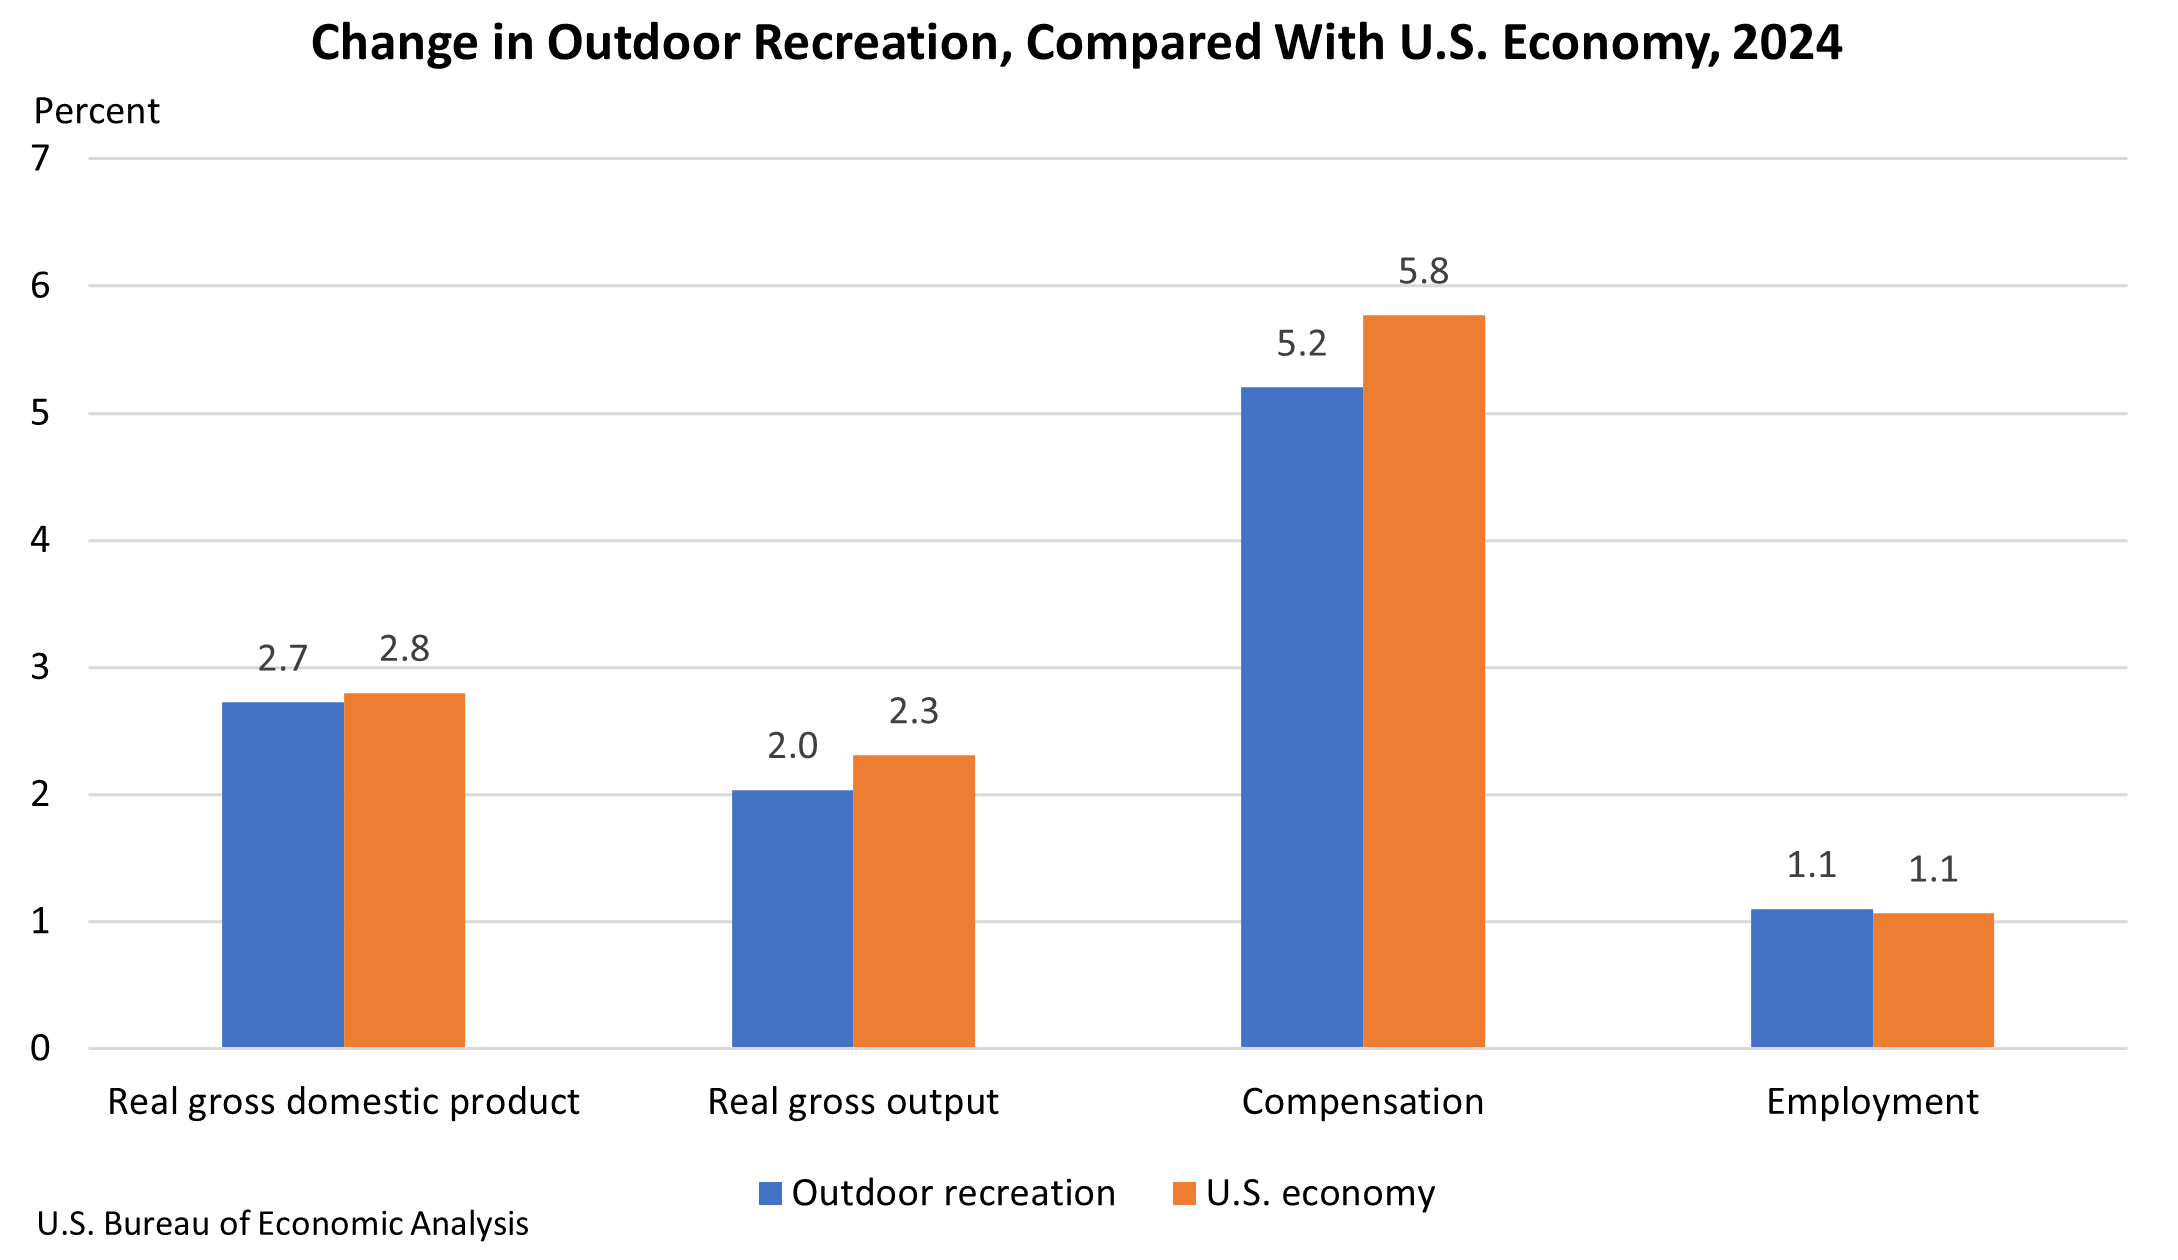
Inflation-adjusted (“real”) GDP for the outdoor recreation economy increased 2.7 percent in 2024, compared with a 2.8 percent increase for the overall U.S. economy, reflecting a deceleration from the increase in outdoor recreation of 5.3 percent in 2023 (national table 1). Real gross output for the outdoor recreation economy increased 2.0 percent. Outdoor recreation compensation increased 5.2 percent, and employment increased 1.1 percent (national table 9).
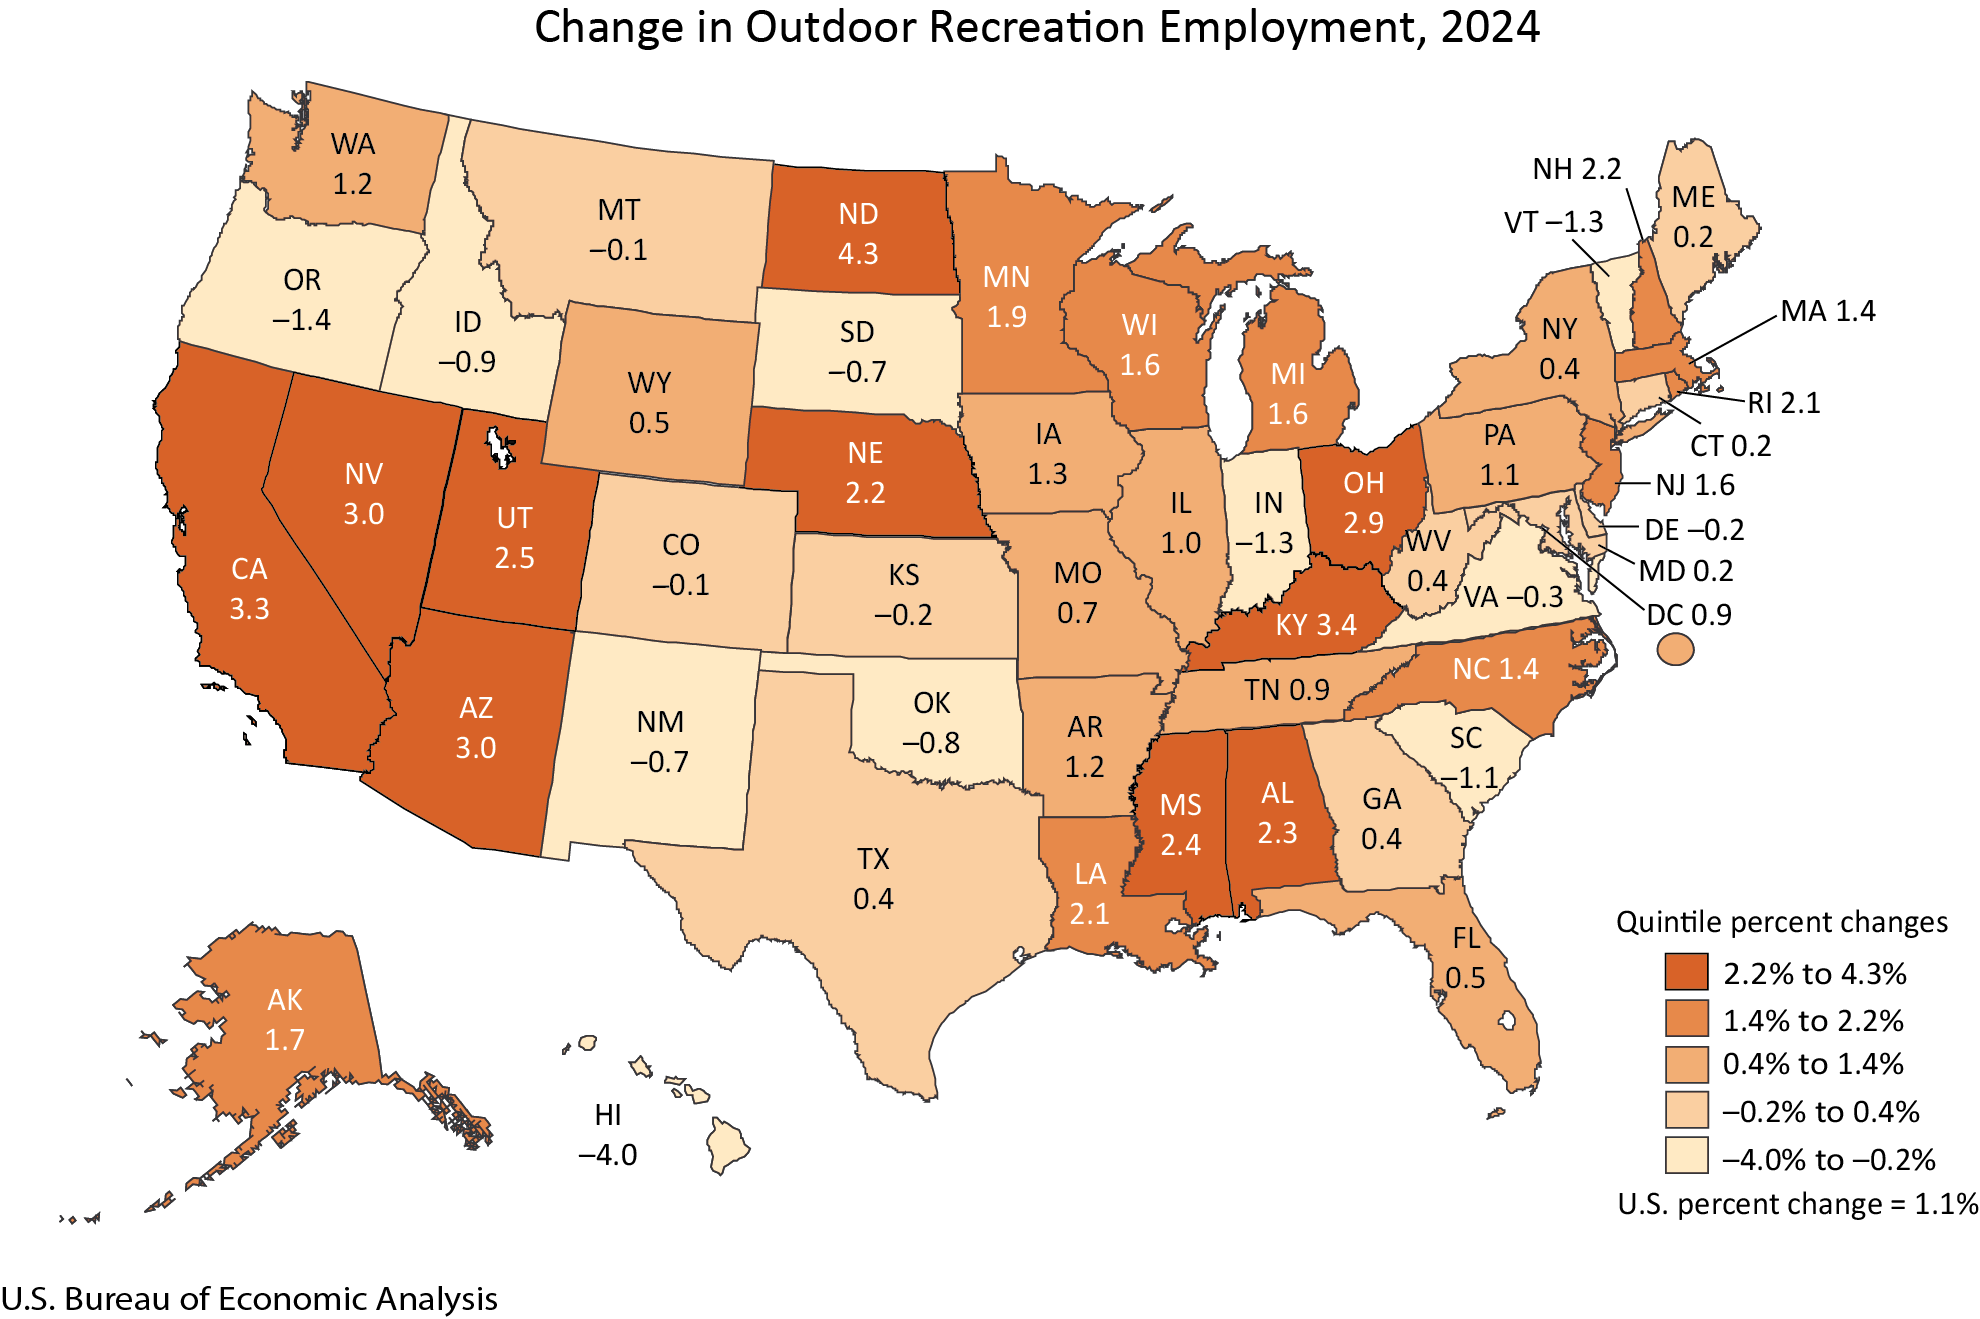
Outdoor recreation employment increased in 36 states and the District of Columbia in 2024. The percent change in outdoor recreation employment ranged from 4.3 percent in North Dakota to −4.0 percent in Hawaii (BEA interactive tables).
Outdoor recreation by activity
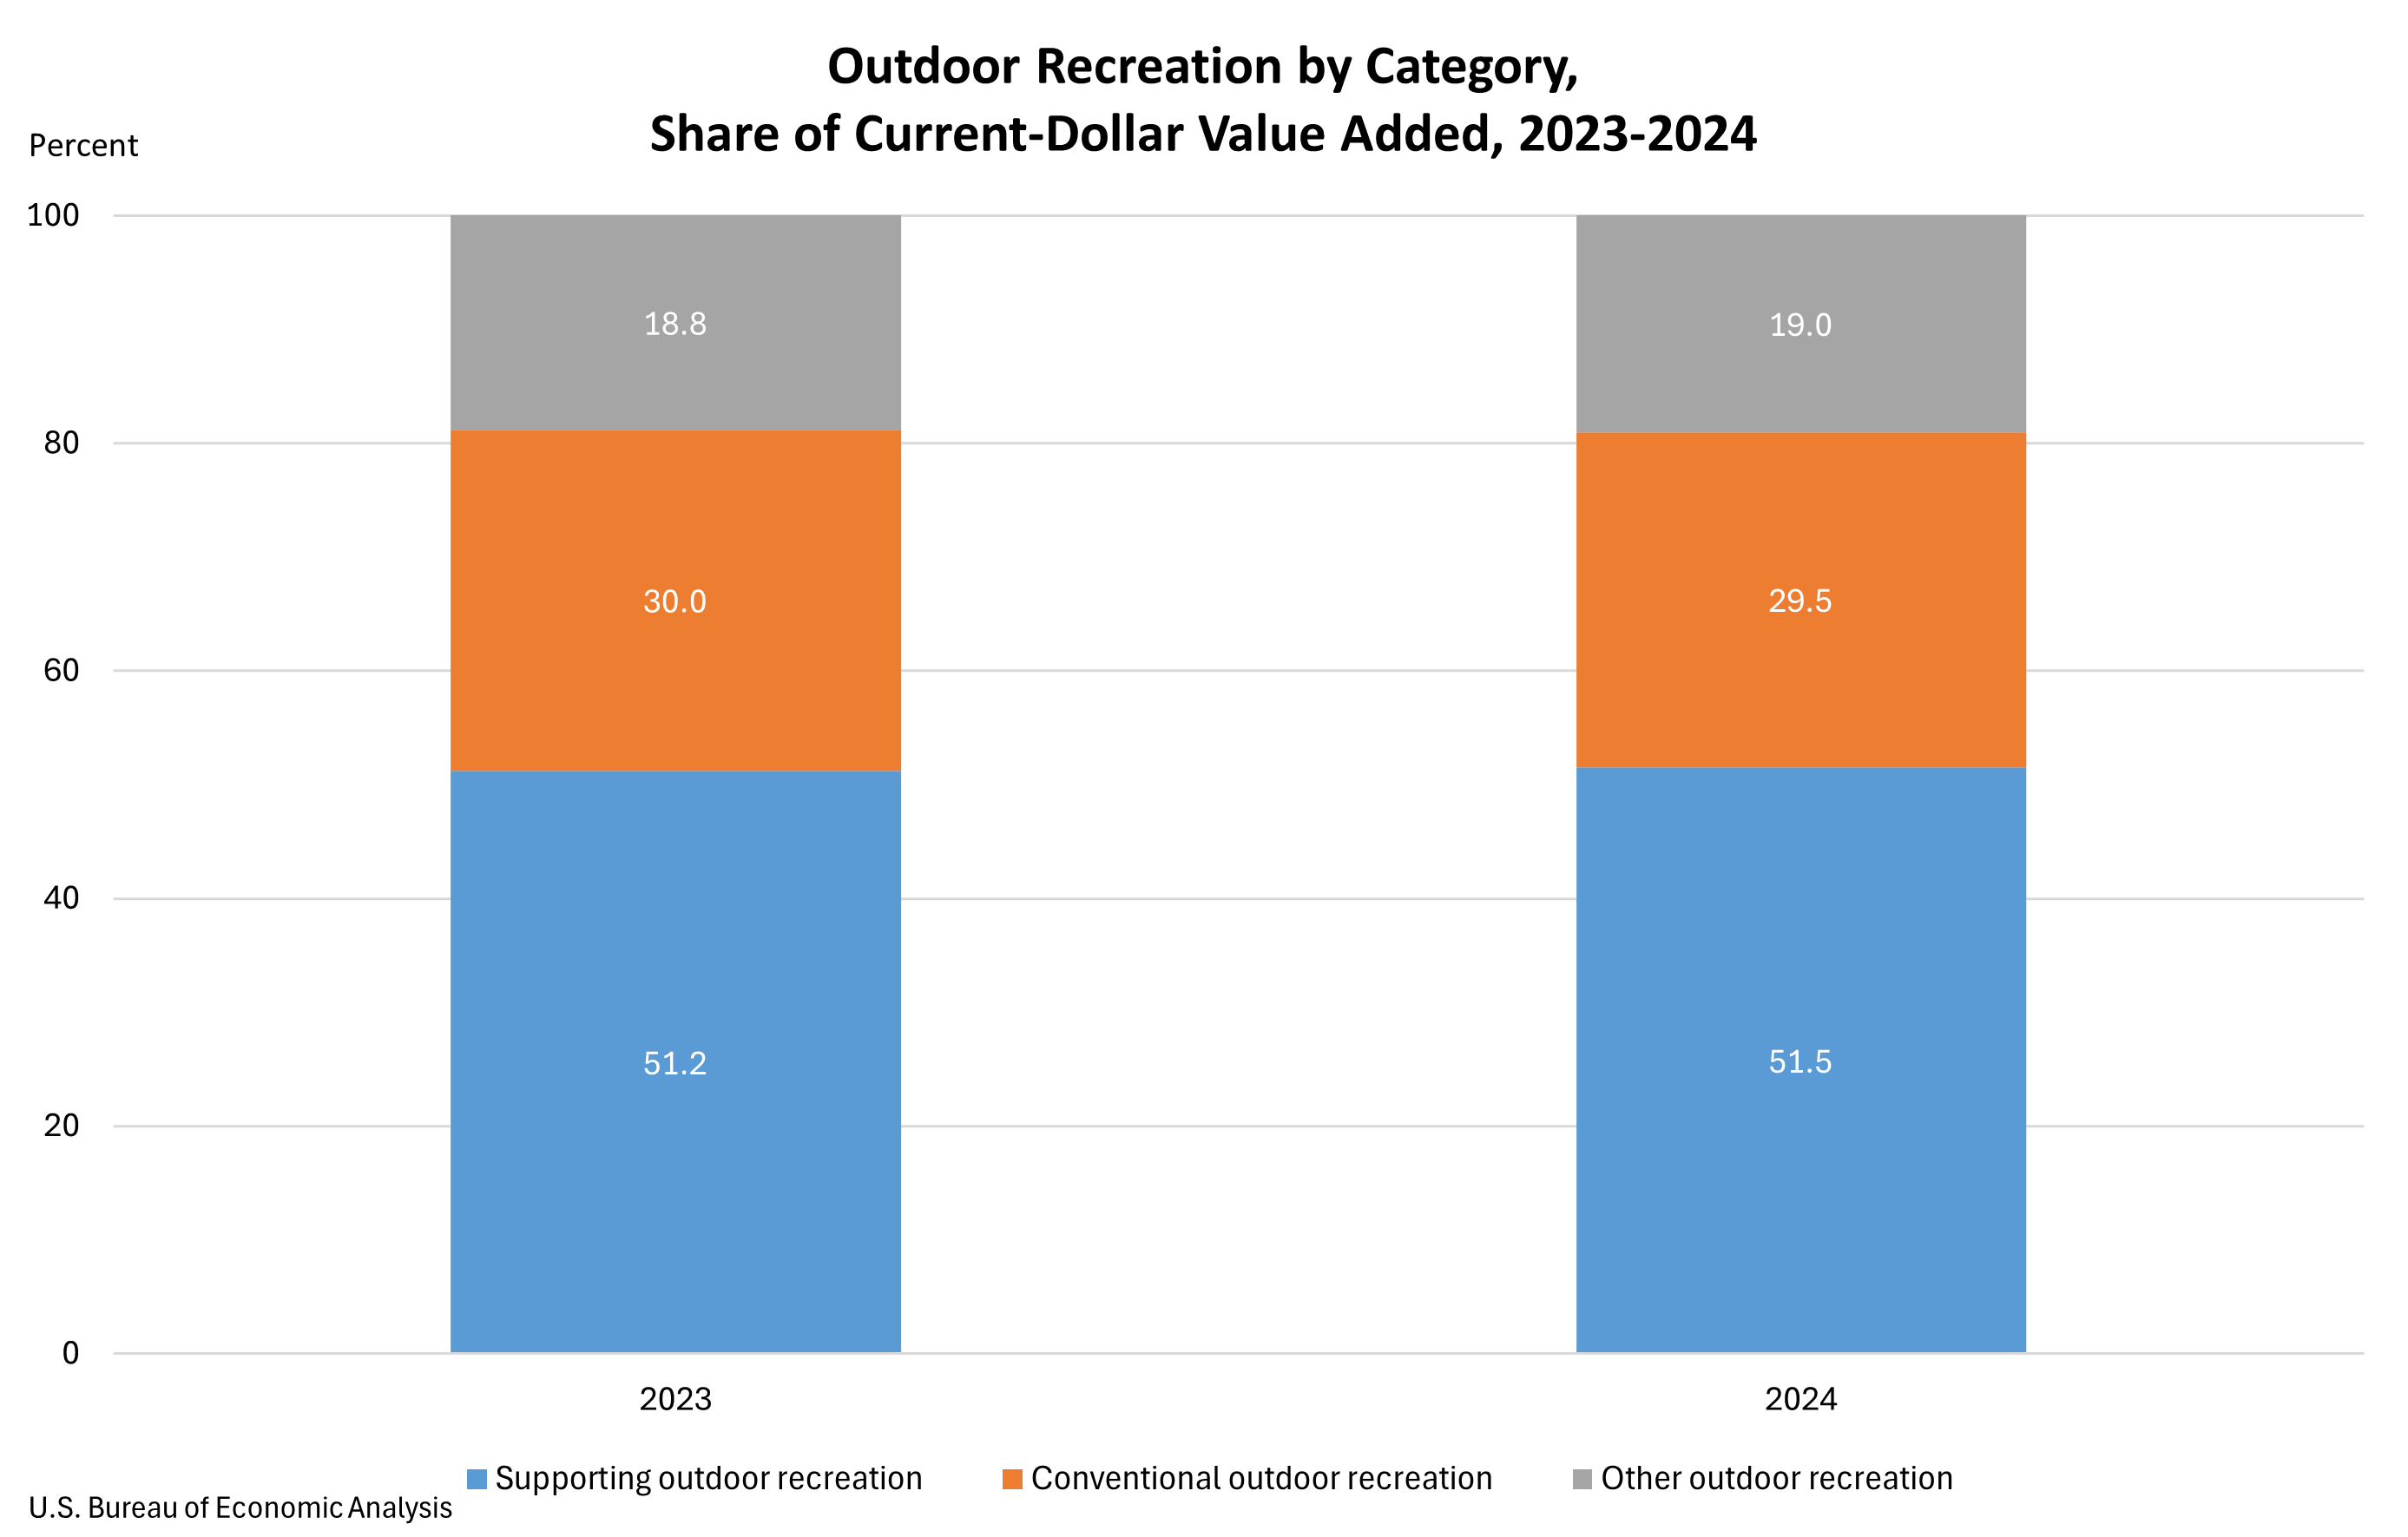
Outdoor recreation activities fall into three general categories: (1) conventional activities such as bicycling, boating, hiking, and hunting; (2) other activities such as gardening and outdoor concerts; and (3) supporting activities such as construction, travel and tourism, local trips, and government expenditures.
In 2024, conventional outdoor recreation accounted for 29.5 percent of U.S. outdoor recreation value added, compared with 30.0 percent in 2023. “Other outdoor recreation” accounted for 19.0 percent of value added in 2024, compared with 18.8 percent in 2023. Supporting activities accounted for the remaining 51.5 percent of value added in 2024, compared with 51.2 percent in 2023. Growth in supporting activities was led by travel and tourism, reflecting growth in spending on transportation, hotels, and restaurants (national table 4).
Additional highlights for value added by activity for 2024 are as follows (state table 2):
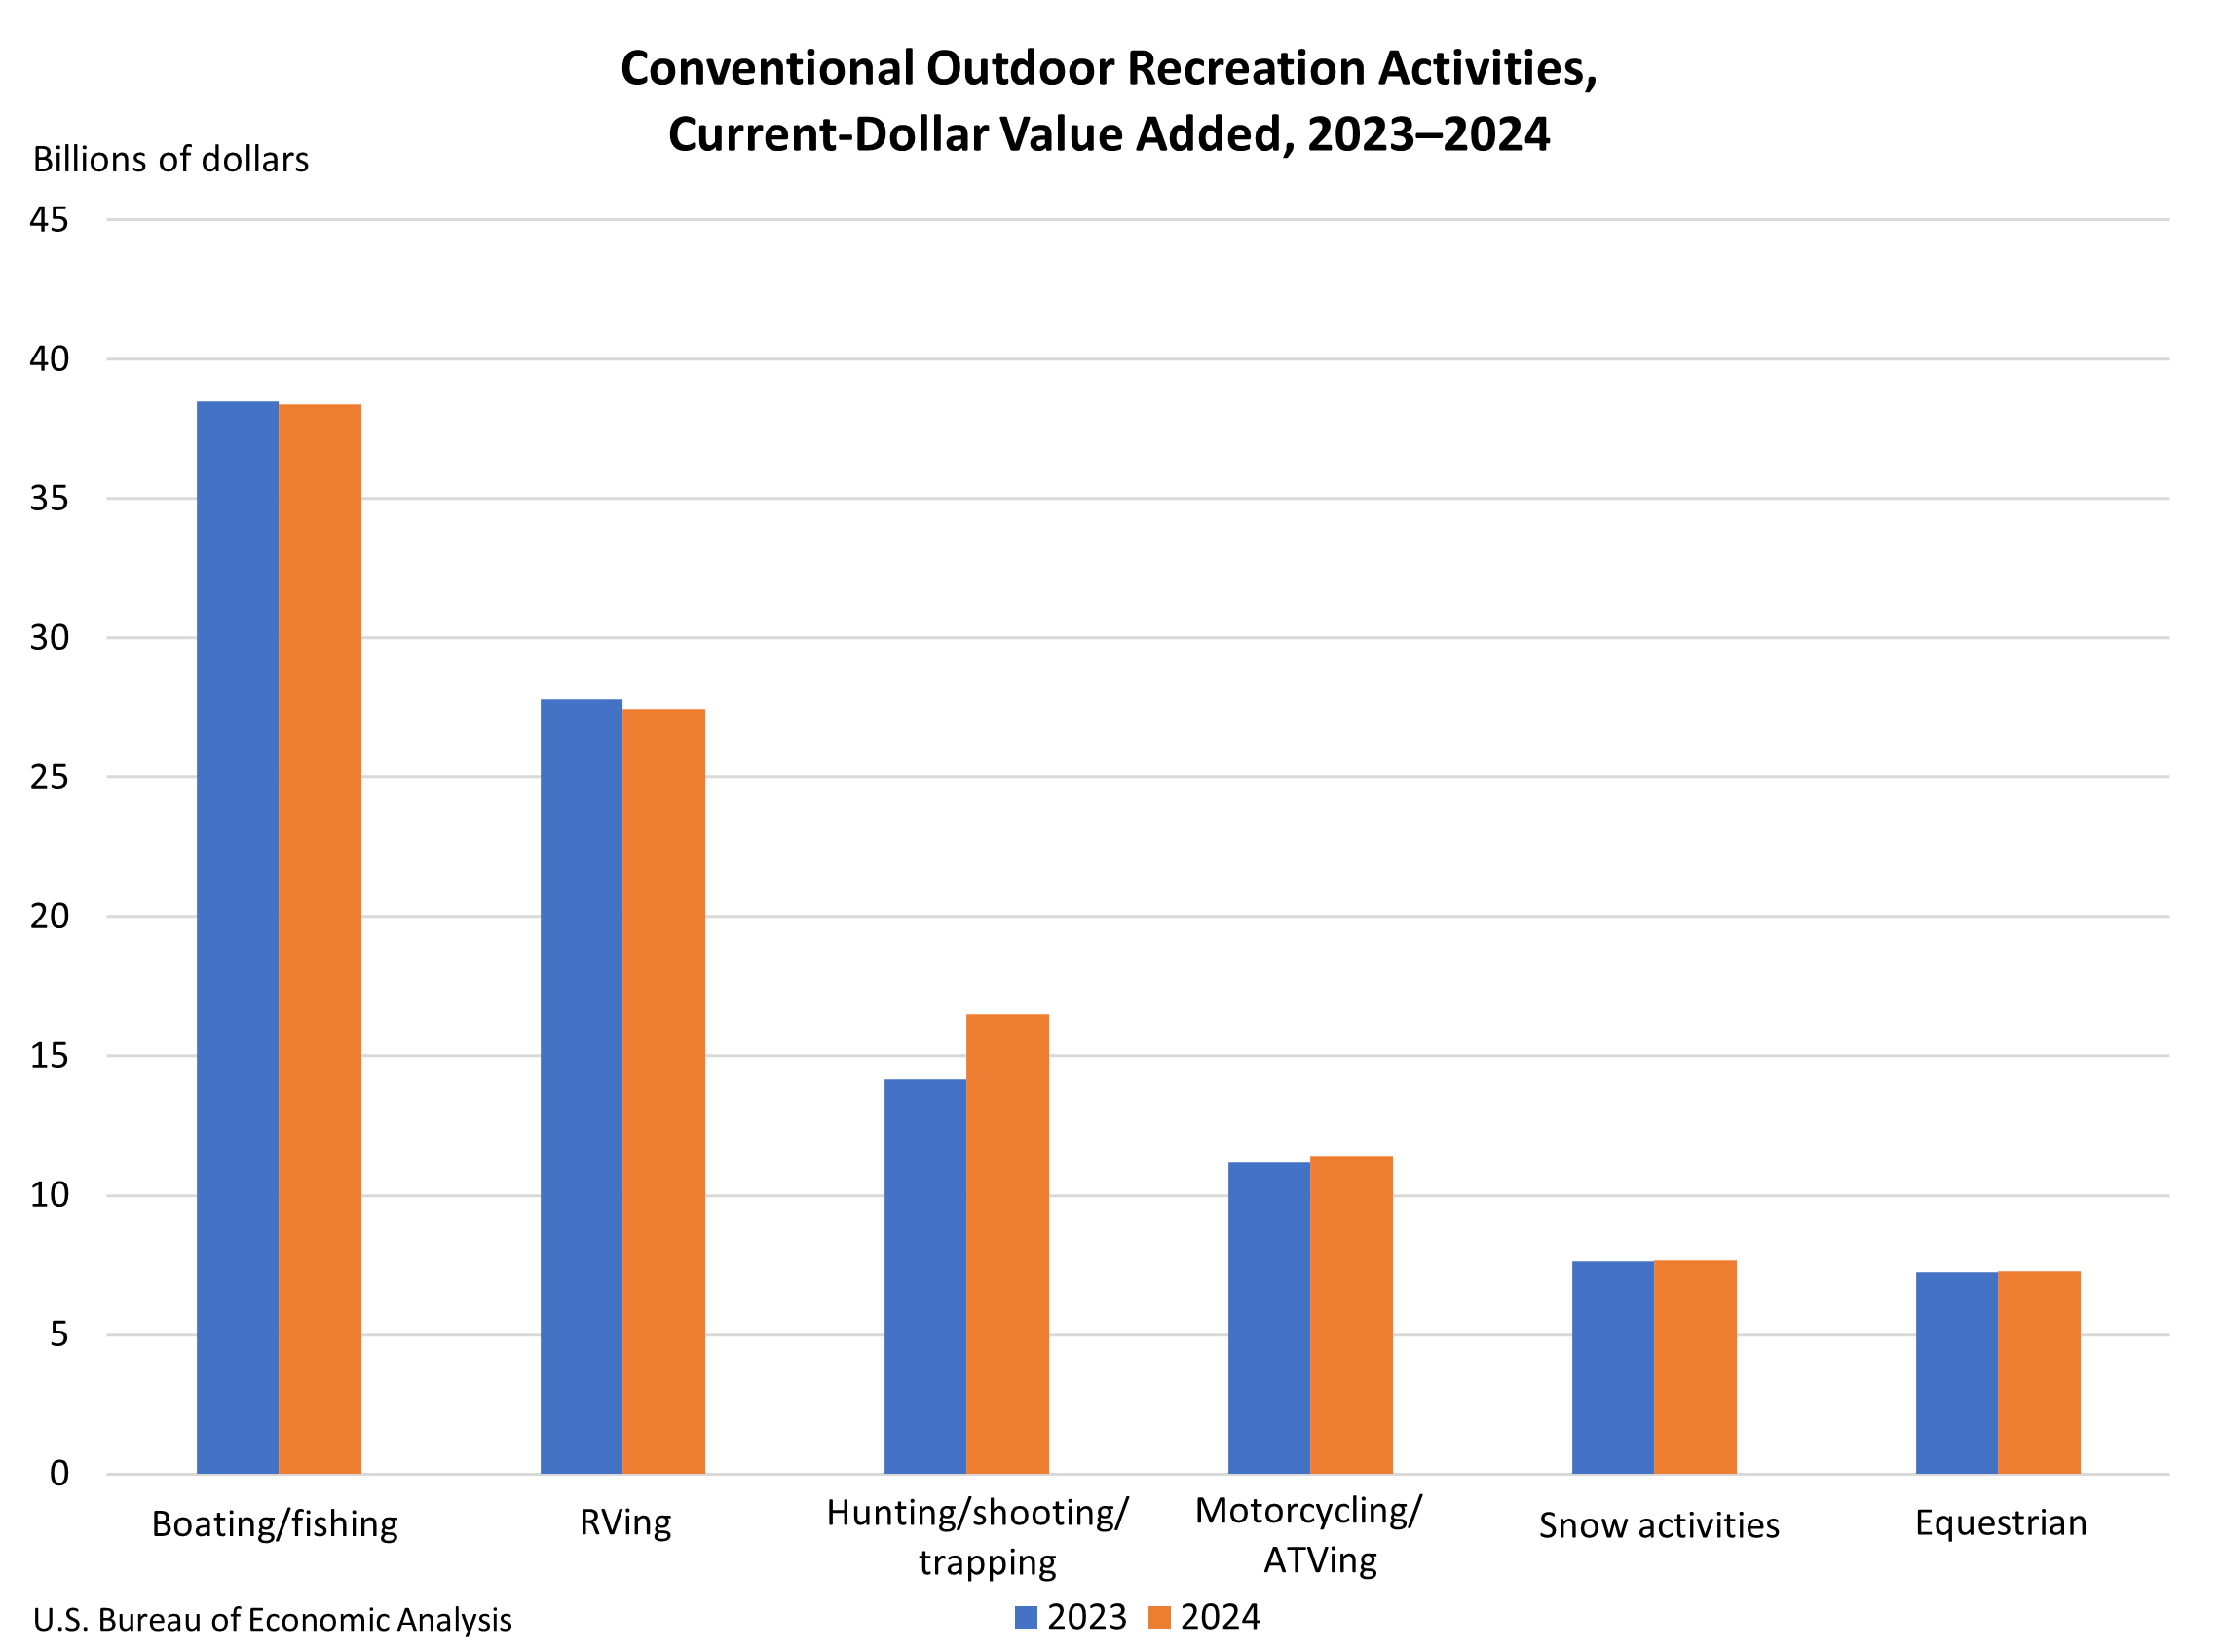
- Boating/fishing was the largest conventional activity for the nation at $38.4 billion in current-dollar value added and was the largest conventional activity in 34 states. The states with the largest contributions were Florida ($4.4 billion), California ($3.3 billion), and Texas ($3.0 billion).
- RVing was the second-largest conventional activity for the nation at $27.5 billion in current-dollar value added and was the largest conventional activity in nine states. The states with the largest contributions were Indiana ($5.2 billion), Texas ($2.7 billion), and California ($2.1 billion).
- Hunting/shooting/trapping was the third-largest conventional activity for the nation at $16.5 billion in current-dollar value added and was the largest conventional activity in Arizona and Wyoming. The states with the largest contributions were Texas ($2.0 billion), Florida ($974.6 million), and California ($817.5 million).
- Snow activities for the nation was $7.6 billion in current-dollar value added and was the largest conventional activity in four states (Colorado, New Hampshire, Utah, and Vermont). The states with the largest contributions were Colorado ($1.6 billion), California ($730.5 million), and Utah ($598.2 million).
Outdoor recreation by industry
The outdoor recreation by industry data show the contributions of industries to the outdoor recreation economy, including their impact on value added, gross output, employment, and compensation.
For the nation, the arts, entertainment, recreation, accommodation, and food services industry group was the largest contributor to U.S. outdoor recreation current-dollar value added in 2024, accounting for $174.4 billion, or 25.0 percent. At the state level, arts, entertainment, recreation, accommodation, and food services was the largest contributor to outdoor recreation value added in 23 states and the District of Columbia. The states with the largest contributions were California ($24.1 billion), Florida ($22.7 billion), and New York ($11.8 billion) (state table 3).
Retail trade was the second-largest industry group for the nation, at $169.1 billion, or 24.3 percent of value added, and was the largest industry group in 24 states. The states with the largest contributions were California ($19.3 billion), Texas ($14.4 billion), and Florida ($13.4 billion).
Manufacturing was the third-largest industry group for the nation, at $91.3 billion, or 13.1 percent of value added, and was the largest industry group in two states (Indiana and Louisiana). The states with the largest contributions were Texas ($13.1 billion), California ($11.6 billion), and Indiana ($9.1 billion).
Annual update of outdoor recreation economic statistics
Estimates for 2020 to 2023 were updated as a part of this release. At the national level, gross output, value added, employment, and compensation now incorporate the results of the 2025 annual update of the National Economic Accounts, which include the National Income and Product Accounts and the Industry Economic Accounts, and newly available and revised source data. The state statistics now reflect these updated national data as well as the 2025 annual update of the Regional Economic Accounts and newly available and revised regional source data.
Previously published estimates are available in BEA’s Data Archive.
For definitions, statistical conventions, BEA regions, uses of these statistics, and more, visit "Additional Information"
Next release: Fall 2026
Outdoor Recreation Economic Statistics, U.S. and States, 2025