
News Release
Real Personal Consumption Expenditures by State and Real Personal Income by State, 2024
Today, the U.S. Bureau of Economic Analysis released new annual statistics on real personal consumption expenditures, real personal income, and regional price parities for all 50 states and the District of Columbia for 2024.
Real personal consumption expenditures (PCE) highlights
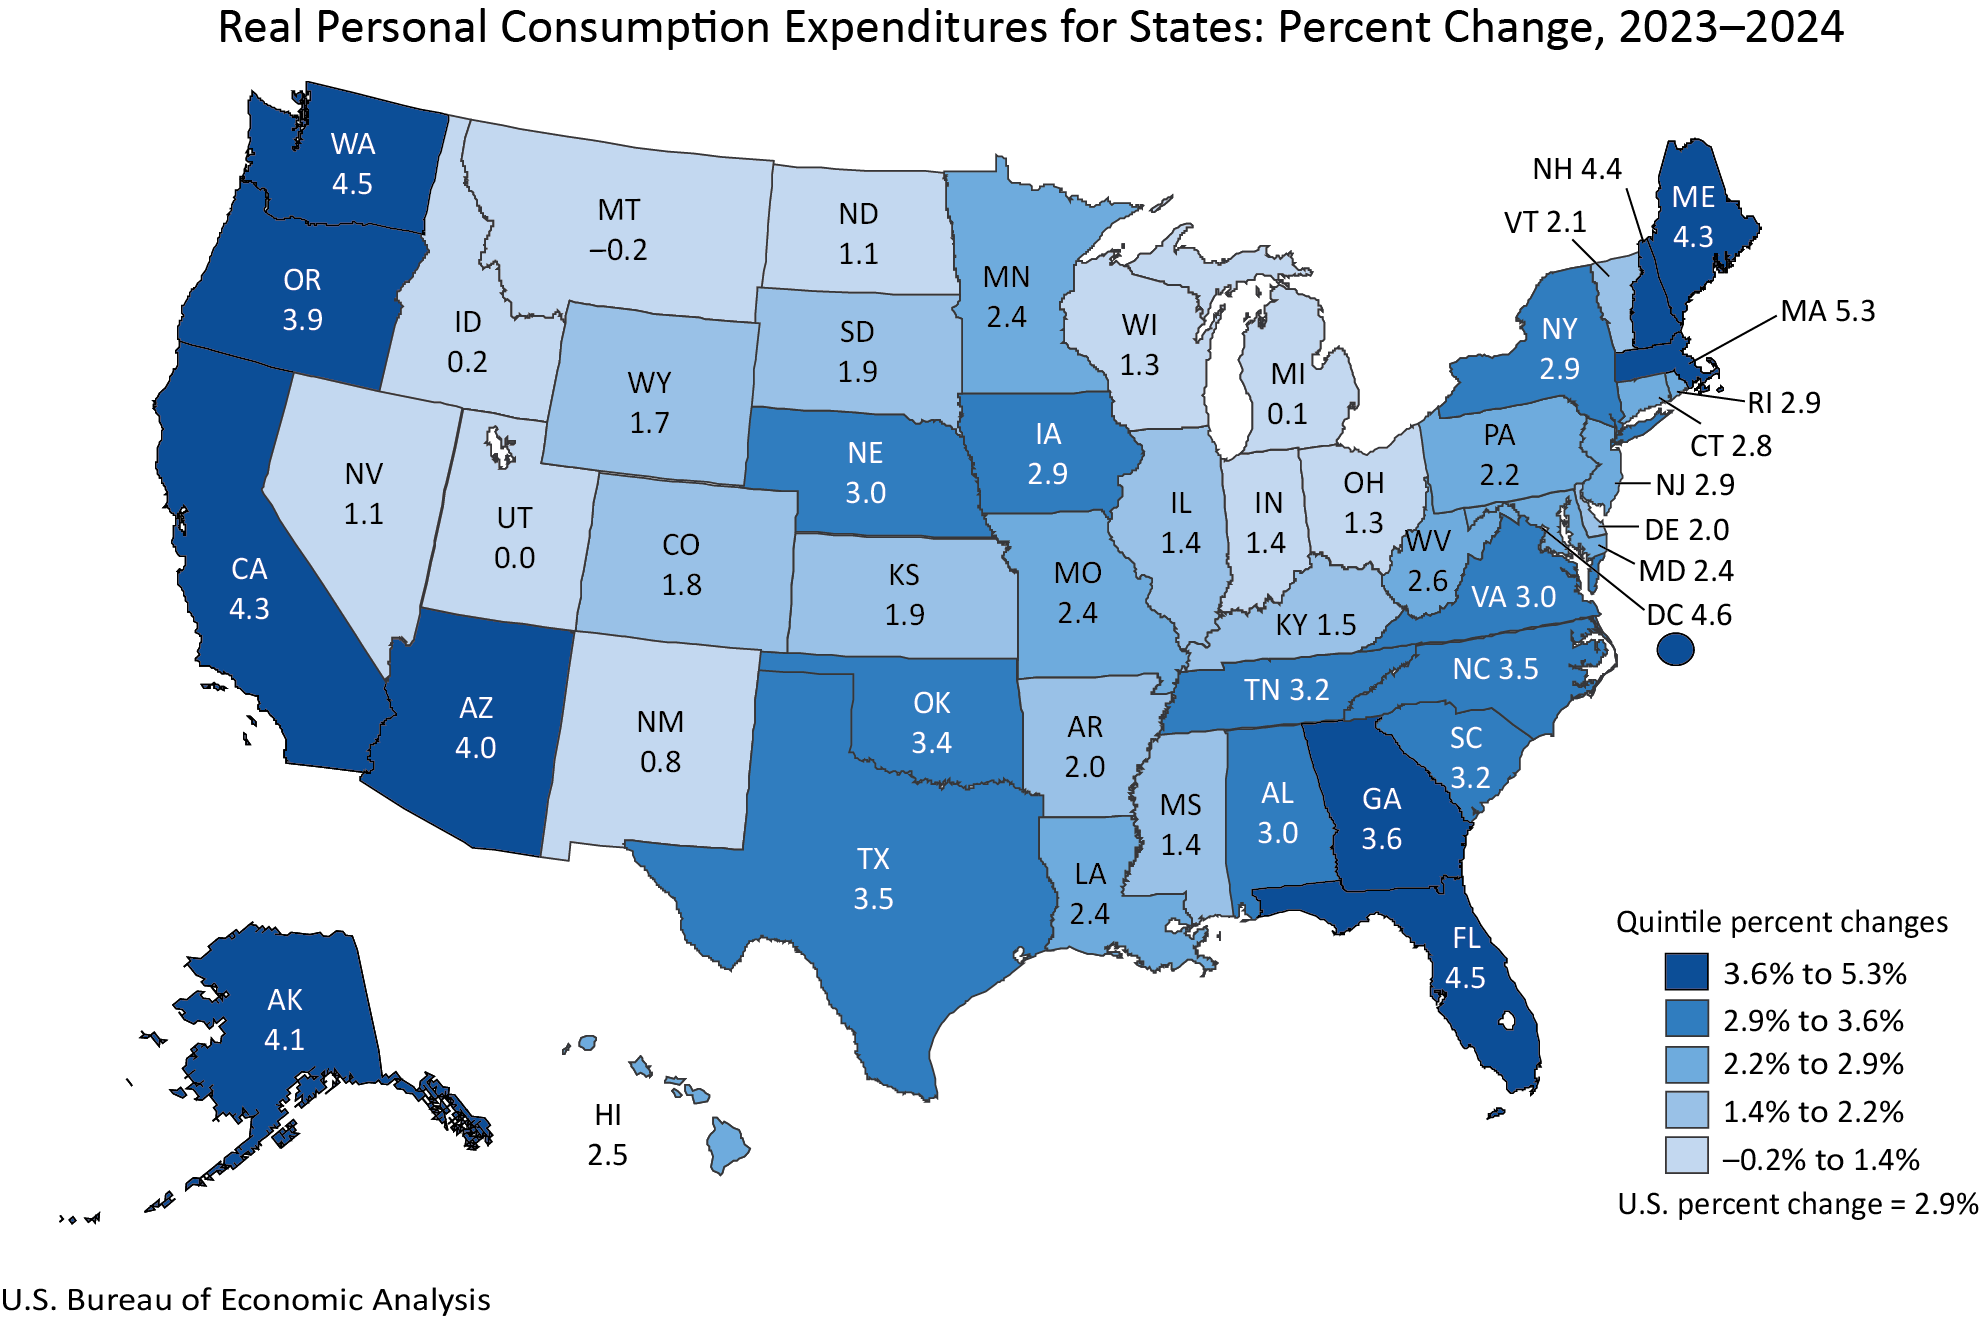
Real PCE by state increased in 48 states and the District of Columbia in 2024. The percent change in real PCE ranged from 5.3 percent in Massachusetts to –0.2 percent in Montana.
Regional estimates of real PCE are the current-dollar estimates adjusted by the corresponding regional price parity (RPP) and the national PCE price index.
Real PCE for the nation increased 2.9 percent in 2024. Current-dollar PCE (see "Consumer Spending by State") increased 5.6 percent, more than the national PCE price index of 2.6 percent.
- Massachusetts had the largest increase in real PCE, at 5.3 percent. Current-dollar PCE increased 6.1 percent, while its implicit regional price deflator increased 0.8 percent.
- The District of Columbia had the second-largest increase in real PCE, at 4.6 percent. Current-dollar PCE increased 6.6 percent, while its implicit regional price deflator increased 1.9 percent.
- Montana had the largest decline in real PCE, at –0.2 percent. Current-dollar PCE increased 6.5 percent, while its implicit regional price deflator increased 6.7 percent.
Real personal income highlights
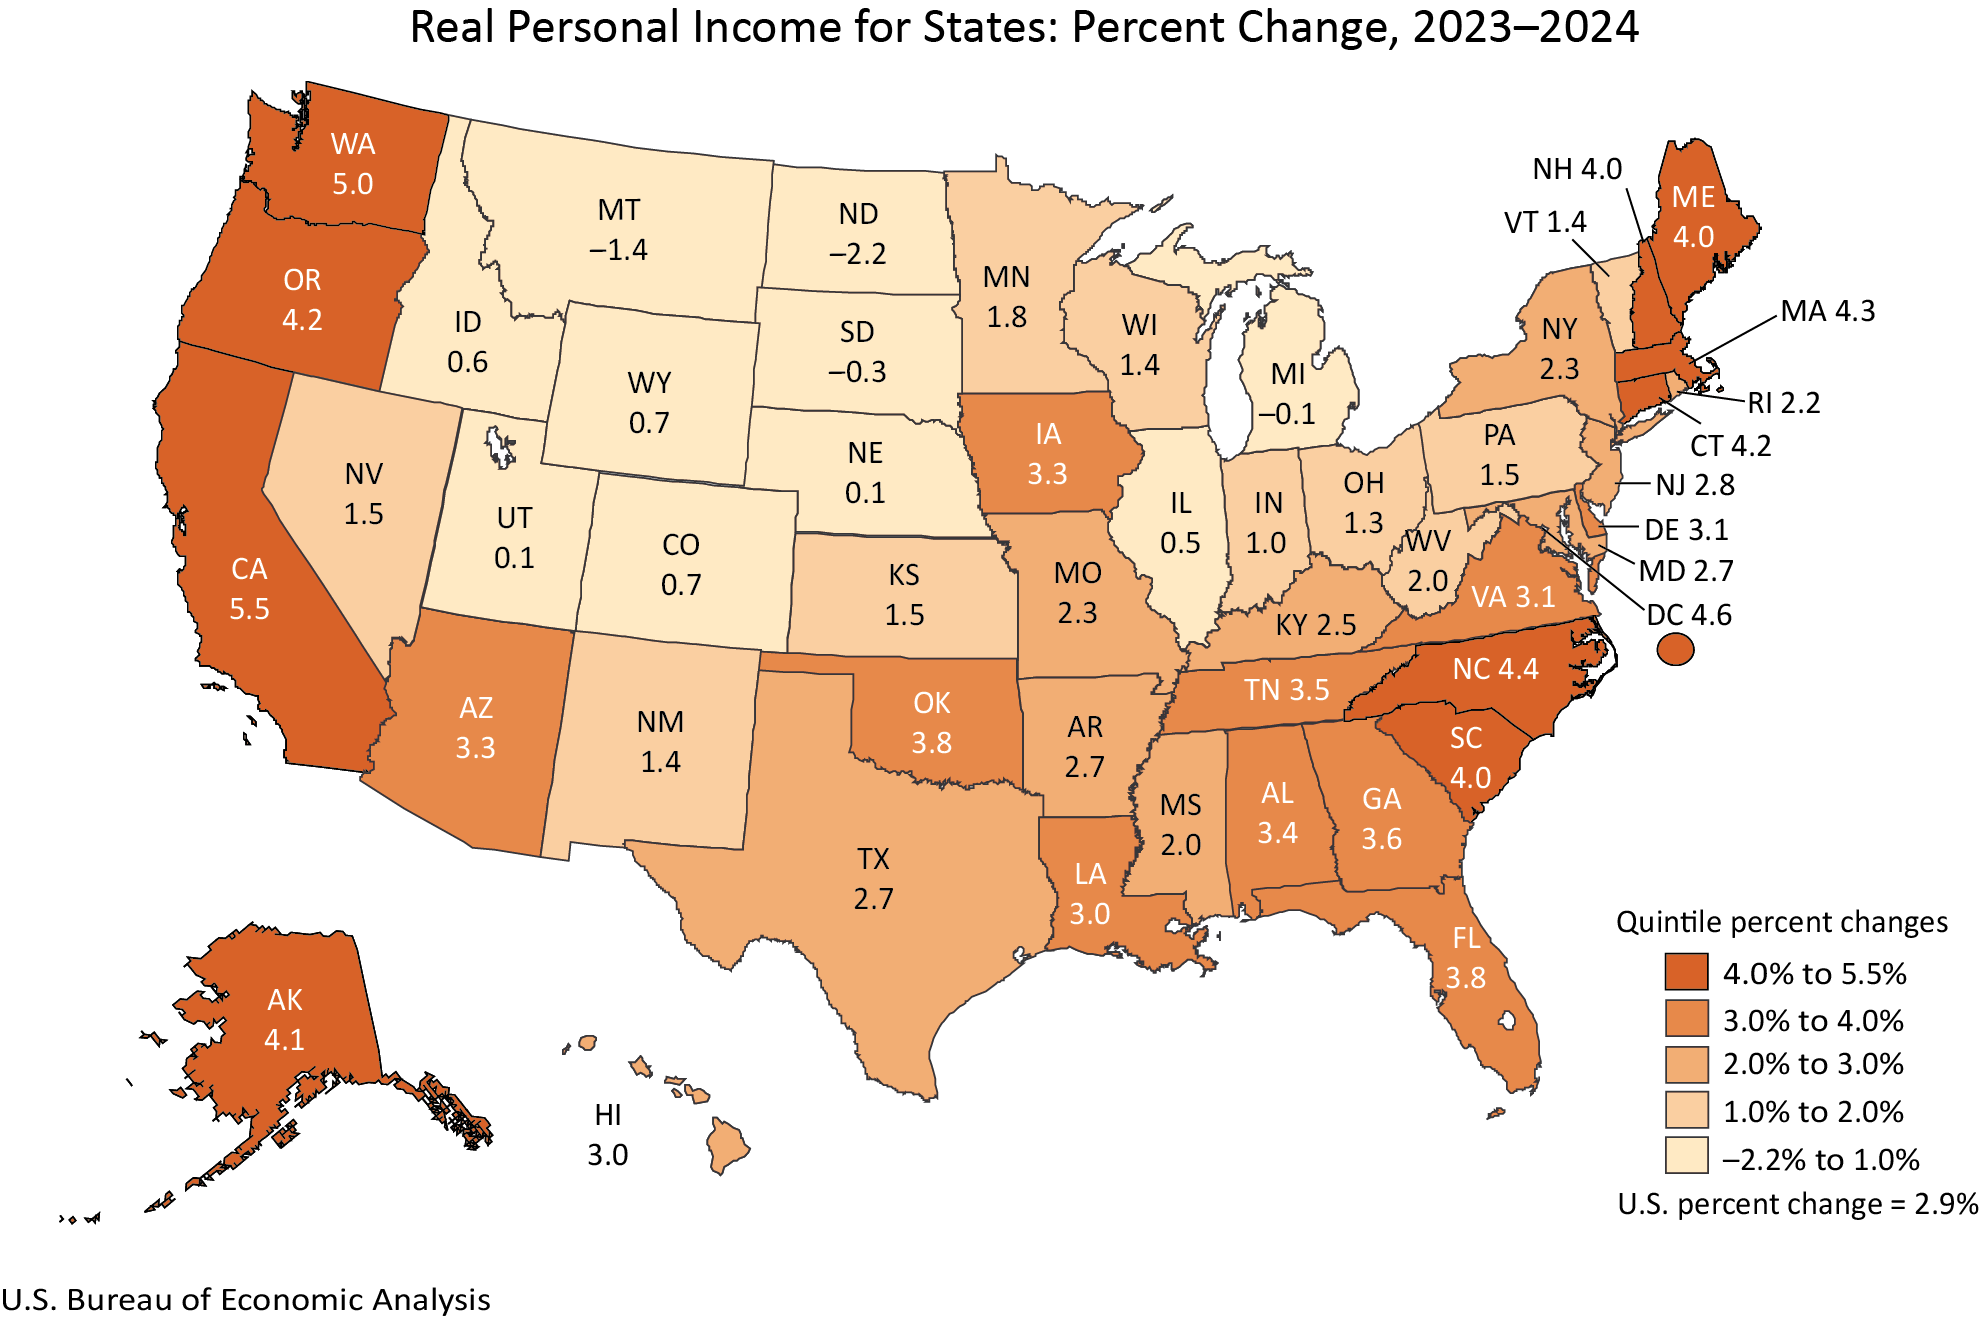
Real personal income increased in 46 states and the District of Columbia in 2024, with the percent change in real personal income ranging from 5.5 percent in California to –2.2 percent in North Dakota.
Regional estimates of real personal income are the current-dollar estimates adjusted by the corresponding regional price parity (RPP) and the national PCE price index.
Real personal income for the nation increased 2.9 percent in 2024. Current-dollar personal income (see "Personal Income by State") increased 5.6 percent, more than the national PCE price index.
- California had the largest increase in real personal income, at 5.5 percent. Current-dollar personal income increased 6.8 percent, while its implicit regional price deflator increased 1.3 percent.
- Washington had the second-largest increase in real personal income, at 5.0 percent. Current-dollar personal income increased 6.4 percent, while its implicit regional price deflator increased 1.3 percent.
- North Dakota had the largest decline in real personal income, at –2.2 percent. Current-dollar personal income increased 1.2 percent, while its implicit regional price deflator increased 3.5 percent.
Regional price parities highlights
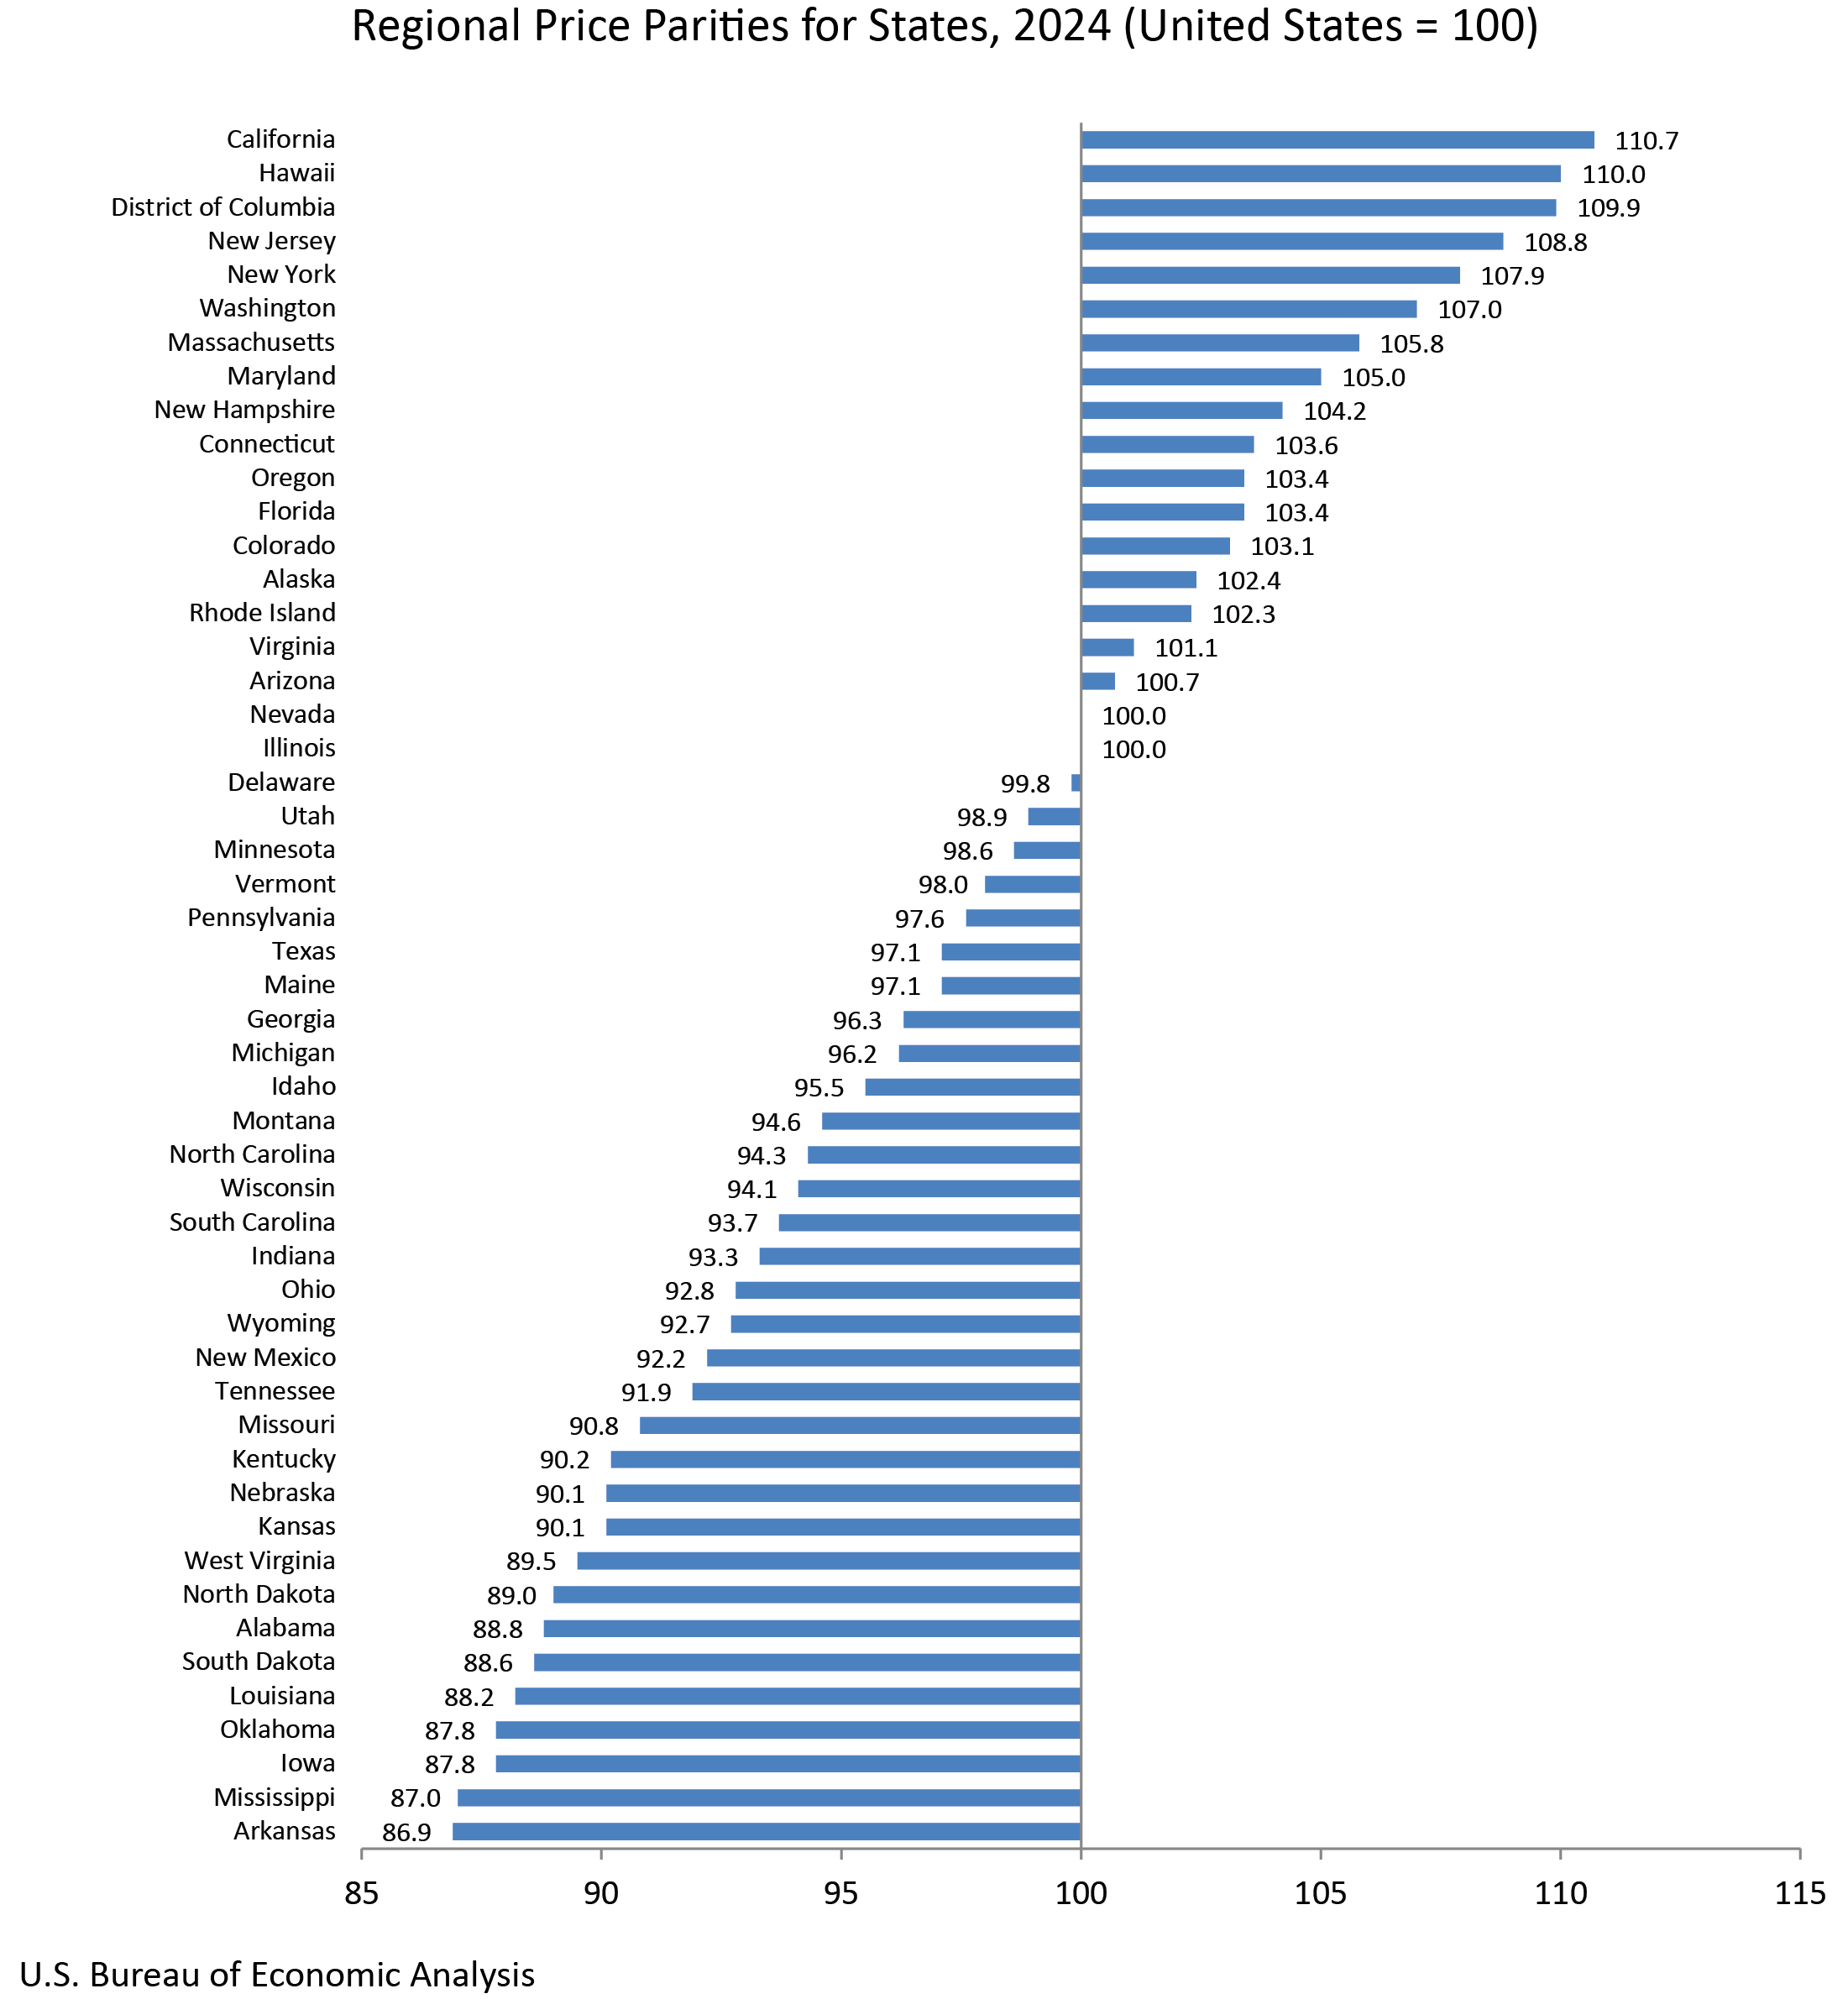
Regional price parities measure the differences in price levels across states for a given year and are expressed as a percentage of the overall national price level.
The all items RPP covers all consumption goods and services including housing rents. Housing rents are often the main driver in differences in RPPs.
- States with the highest RPPs in 2024 were California, at 110.7; Hawaii, at 110.0; and New Jersey, at 108.8. The RPP in the District of Columbia was 109.9.
- States with the lowest RPPs were Arkansas, at 86.9; Mississippi, at 87.0; Iowa, at 87.8; and Oklahoma, at 87.8.
- Across states, California had the highest RPP for housing rents, at 154.3, and West Virginia had the lowest, at 54.2. The RPP for housing rents in the District of Columbia was 155.0.
Metropolitan area RPP statistics are available on the BEA website.
Updates of regional real PCE and real personal income statistics
With today’s release, the annual estimates of real PCE by state and real personal income by state from 2008 to 2023 were revised. This update incorporates new and revised source data that are more complete and more detailed than previously available and aligns the states with the annual update of the National Income and Product Accounts and the gross domestic product (GDP) by industry statistics released on September 25, 2025, and the GDP, personal income, and PCE by state statistics released on September 26, 2025.
BEA released new estimates of real per capita PCE and real per capita personal income for 2024. BEA used U.S. Census Bureau population figures to calculate per capita estimates for 2020 through 2024.
Discontinuation of statistics for metropolitan areas
With the release of real PCE by state and real personal income by state for 2024, BEA has discontinued publication of statistics for metropolitan statistical areas and metropolitan and nonmetropolitan portions. Real PCE and real personal income estimates will continue to be published by state. RPPs will continue to be published by state and local areas. For more information, see the corresponding FAQ.
Recent changes in the presentation of tables
Data previously published as tables within the real PCE and real personal income by state release are updated and available simultaneously with today’s release in BEA’s online Interactive Data Application. However, tables are no longer included within the news release. This reduces duplication, increases efficiency, and points data users directly to BEA’s most complete and flexible data tables, via links in the release. These customizable tables include full time series and can be downloaded as PDFs, in Excel, or in CSV format.
Related Interactive Data Tables
For the 2024 real PCE, real personal income, and RPP by state statistics highlighted in this release, as well as historical time series for these estimates, see the below data tables in BEA’s Interactive Data Application.
Real PCE by state
Table SARPI. Real PCE by State—Percent Change From Preceding Period
Table SAIRPD. Implicit Regional Price Deflator—Percent Change From Preceding Period
Real personal income by state
Table SARPI. Real Personal Income by State—Percent Change From Preceding Period
RPPs
Table SARPP. RPPs by State—All Items (Index)
Table SARPP. RPPs by State—Services: Rents (Index)
Note. With the release of 2025 real PCE, real personal income, and RPP by state statistics on December 10, 2026, the 2024 data will be superseded, and the links above will reflect the latest data. The original data featured in this release can then be accessed in BEA’s Data Archive.
Next release: December 10, 2026, at 8:30 a.m. EST
Real Personal Consumption Expenditures by State and
Real Personal Income by State, 2025
For resources, definitions, and the steps for estimating real PCE,
visit “Additional Information.”
For technical information on the RPPs and implicit regional price deflators,
visit “Technical Notes on Regional Price Parities and Implicit Regional Price Deflators.”