
March 24, 2016
State personal income grew on average 4.4 percent in 2015, the same rate as in 2014. Growth of state personal income—the sum of net earnings by place of residence, property income, and personal current transfer receipts—ranged from -0.2 percent in North Dakota to 6.3 percent in California.
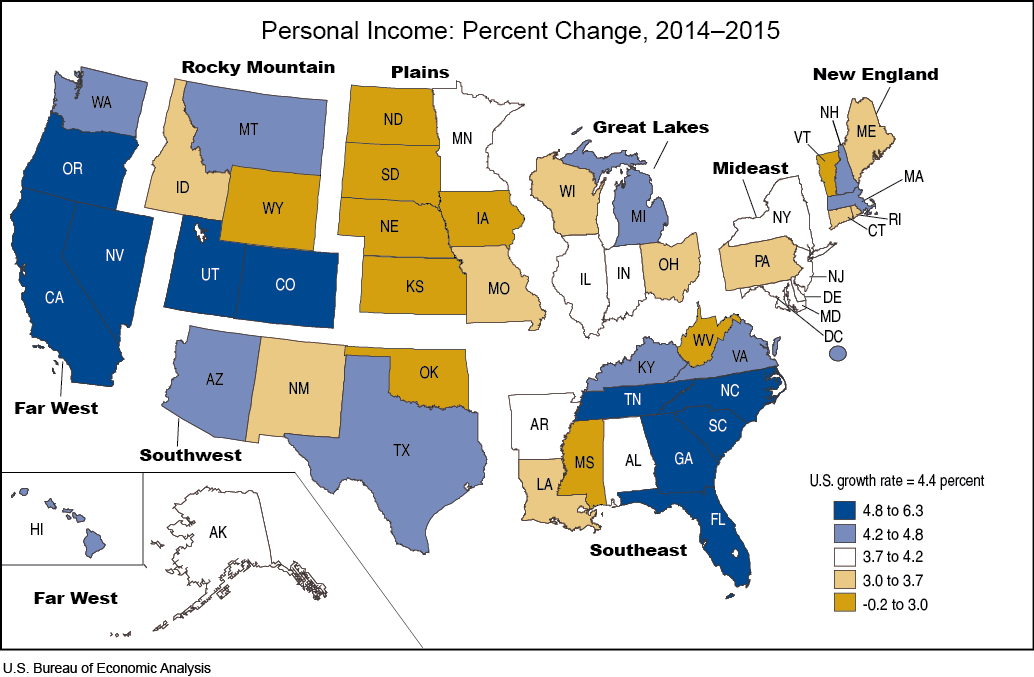
2015 State Personal Income Growth and Ranks
| State | Growth | Rank |
|---|---|---|
| Alabama | 4.1 | 22 |
| Alaska | 3.8 | 28 |
| Arizona | 4.6 | 14 |
| Arkansas | 3.9 | 26 |
| California | 6.3 | 1 |
| Colorado | 5.1 | 7 |
| Connecticut | 3.1 | 39 |
| Delaware | 3.9 | 27 |
| District of Columbia | 4.5 | -- |
| Florida | 5.2 | 6 |
| Georgia | 5.3 | 5 |
| Hawaii | 4.6 | 13 |
| Idaho | 3.4 | 34 |
| Illinois | 3.7 | 30 |
| Indiana | 4.0 | 25 |
| Iowa | 0.6 | 48 |
| Kansas | 2.5 | 43 |
| Kentucky | 4.5 | 15 |
| Louisiana | 3.4 | 35 |
| Maine | 3.2 | 37 |
| Maryland | 4.1 | 21 |
| Massachusetts | 4.7 | 12 |
| Michigan | 4.3 | 18 |
| Minnesota | 3.8 | 29 |
| Mississippi | 2.9 | 42 |
| Missouri | 3.0 | 40 |
| Montana | 4.4 | 16 |
| Nebraska | 1.7 | 46 |
| Nevada | 5.4 | 4 |
| New Hampshire | 4.2 | 20 |
| New Jersey | 4.0 | 24 |
| New Mexico | 3.7 | 32 |
| New York | 4.0 | 23 |
| North Carolina | 4.8 | 9 |
| North Dakota | -0.2 | 50 |
| Ohio | 3.1 | 38 |
| Oklahoma | 2.3 | 44 |
| Oregon | 5.8 | 2 |
| Pennsylvania | 3.3 | 36 |
| Rhode Island | 3.7 | 31 |
| South Carolina | 5.1 | 8 |
| South Dakota | 0.0 | 49 |
| Tennessee | 4.8 | 10 |
| Texas | 4.3 | 17 |
| Utah | 5.5 | 3 |
| Vermont | 3.0 | 41 |
| Virginia | 4.3 | 19 |
| Washington | 4.7 | 11 |
| West Virginia | 2.2 | 45 |
| Wisconsin | 3.5 | 33 |
| Wyoming | 1.7 | 47 |
For more information, read the full report.