
Arts and cultural economic activity grew at an inflation-adjusted 2.9 percent in 2016, increasing faster than the nation’s economy overall. For comparison, U.S. gross domestic product, or GDP, rose 1.6 percent that year.
Among state economies, Nevada posted the fastest arts and culture increase at 14.7 percent (not adjusted for inflation). Performing arts promoters and the movie industry led Nevada’s growth. The District of Columbia and all other states except Louisiana also saw increases in nominal value added; Louisiana’s arts and culture economy declined 13.1 percent.
The arts and cultural sector measured in today’s report from the Bureau of Economic Analysis includes a wide range of activities, such as music, dance, and theater; visual arts, design services, and fine arts education; and museums, historical sites, and nature parks. In addition to those core industries, it also includes supporting industries – such as broadcasting, retail, and government support – that account for a large portion of the economic output.
The leading contributor to the sector’s nationwide growth was information services, a group of supporting industries that includes broadcasting, motion pictures, and publishing. Retail was the next largest contributor.
Arts and culture accounted for 4.3 percent of the nation’s GDP, or $804.2 billion, in 2016, the most recent year for which statistics are available.
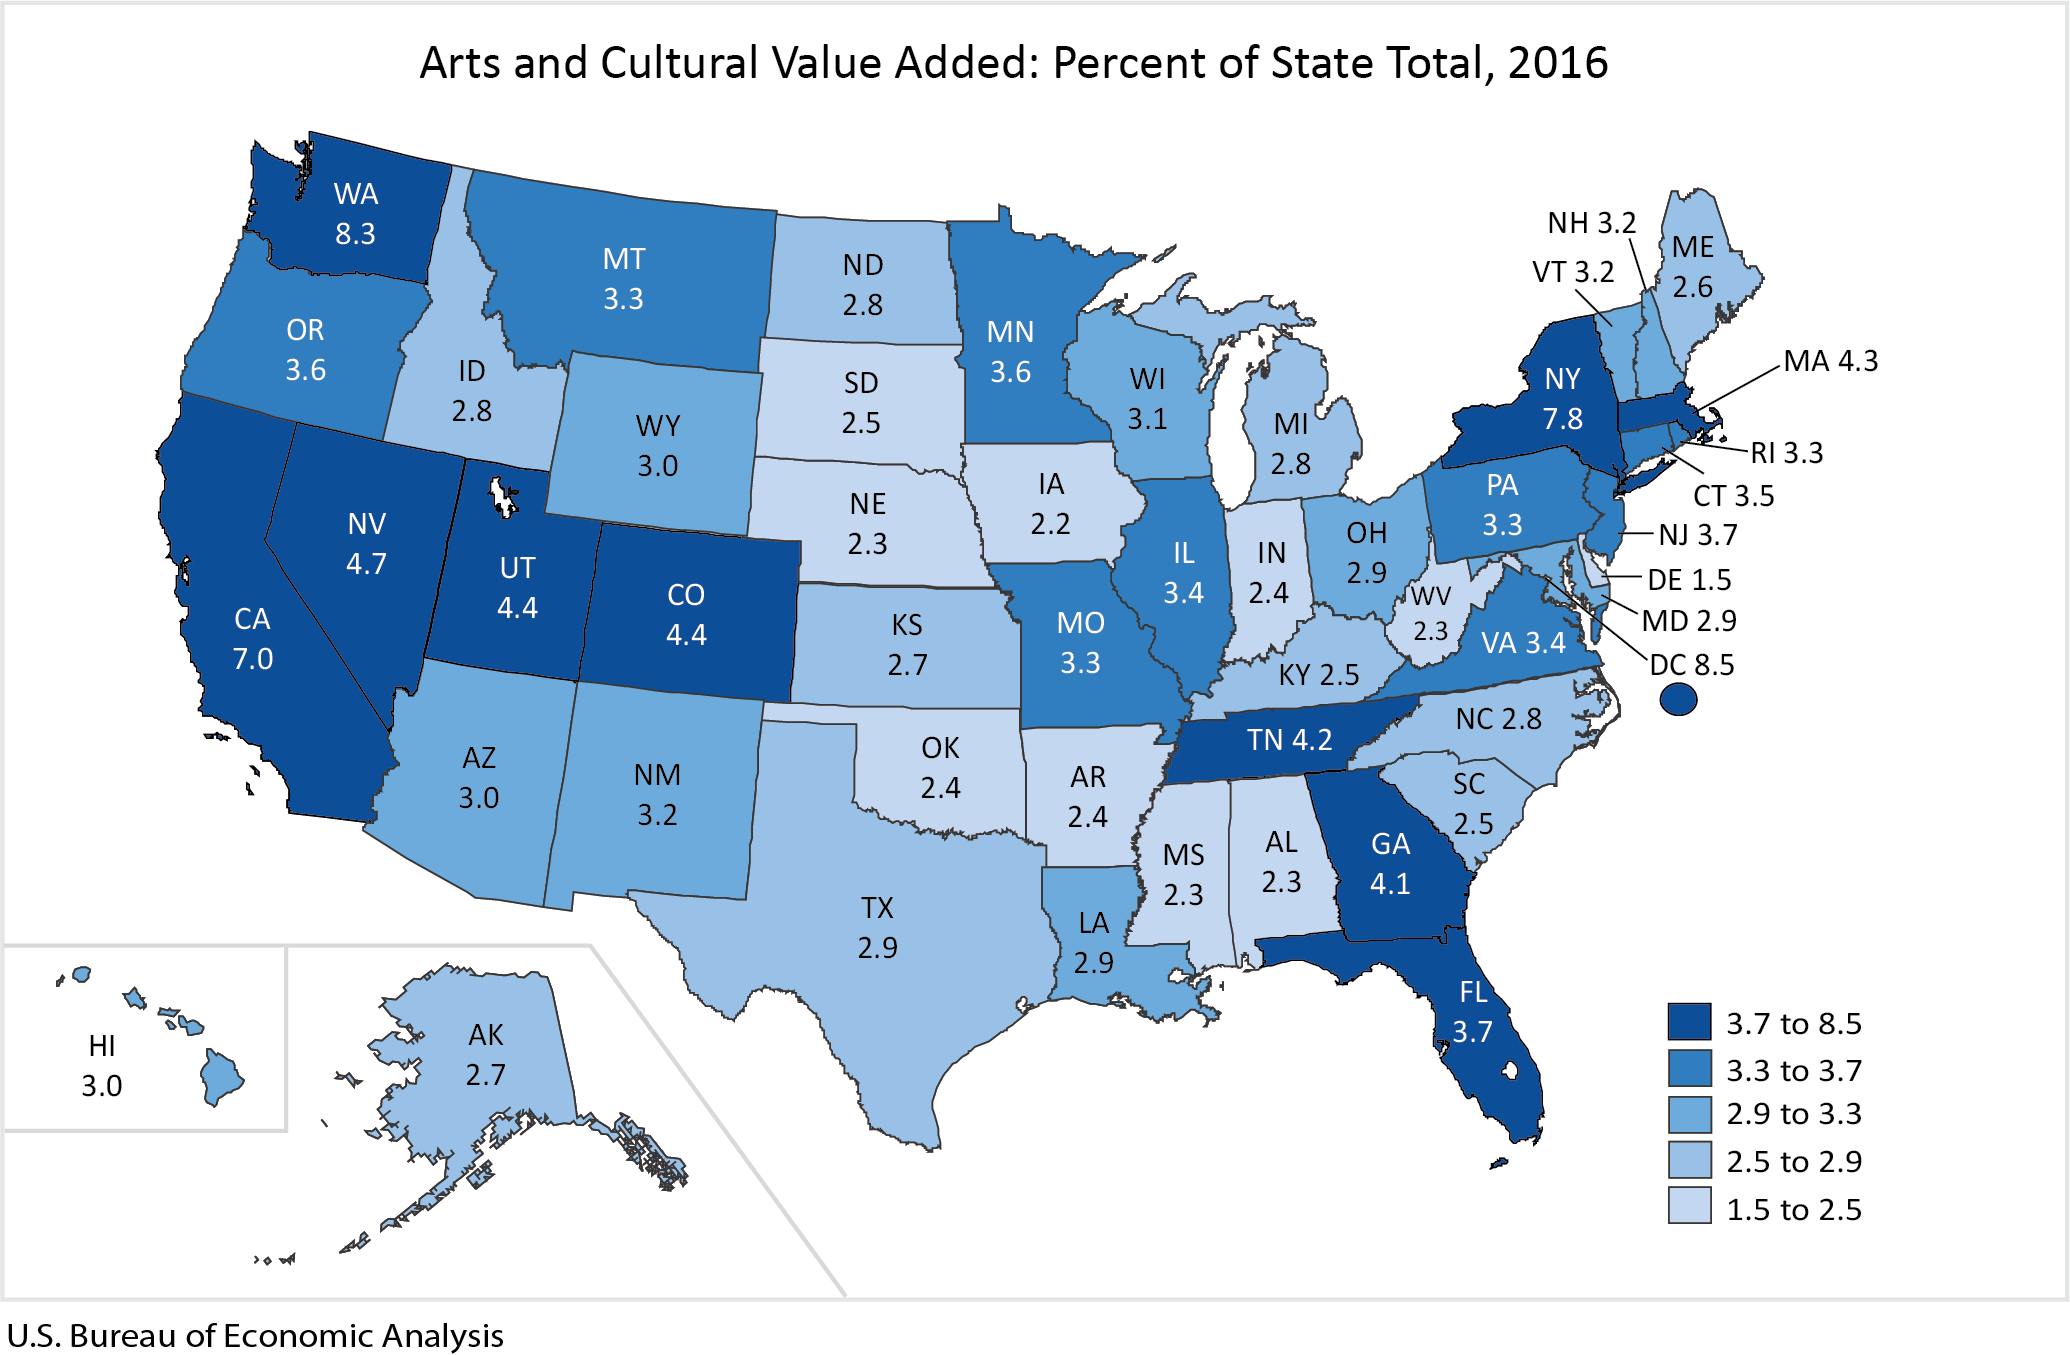
Arts and culture’s share of GDP ranged from 8.5 percent in the District of Columbia to 1.5 percent in Delaware. States where arts and culture accounted for more than 5 percent of the economy were Washington (8.3 percent), New York (7.8), and California (7.0).
Arts and cultural employment nationwide rose 2.5 percent, to 5 million jobs. Most states saw employment increase in the sector. Washington led with a 9.6 percent jump in arts and cultural jobs, with retail as the leading contributor.
For today’s news release and additional national and state data, see the arts and culture page on bea.gov. Summary sheets for each state show top arts and cultural industries, the sector’s growth rate in the state, employment, compensation of employees, national rankings, and other highlights.
Browse our interactive map for an overview of arts and culture’s impact across the 50 states.
BEA’s Arts and Cultural Production Satellite Account is sponsored by funding from the National Endowment for the Arts. It is one of several satellite accounts that complement BEA’s core statistics by pulling together additional detail on specific industries. Providing a more detailed picture of the arts and cultural economy benefits arts organizations, businesses, economic developers, policymakers, and others interested in this prominent sector.