
Arts and cultural economic activity, adjusted for inflation, increased 3.6 percent in 2017, according to the U.S. Bureau of Economic Analysis. That compares with a 5.3 percent increase in 2016. Arts and cultural economic activity accounted for 4.5 percent of gross domestic product (GDP), or $877.8 billion, in 2017.
The Arts and Cultural Production Satellite Account measures the economic contributions of a wide range of arts and cultural activities and the industries that support them. The information services category, which includes the broadcasting and publishing industries, was the leading contributor to the overall growth in arts and cultural production at the national level in 2017, followed by design services.
- Core arts and cultural production industries, which include performing arts, museums, design services, and fine arts education, grew 2.7 percent.
- Supporting arts and cultural production industries, including art support services and information services, increased 4.0 percent.
The arts and cultural share of total nominal (not adjusted for inflation) GDP ranged from 8.8 percent in the District of Columbia to 1.5 percent in Delaware. The share for most states in 2017 ranged between 2 and 5 percent. The District of Columbia, Washington, California, New York, and Nevada were the only areas where the arts and culture share of total GDP exceeded 5 percent.
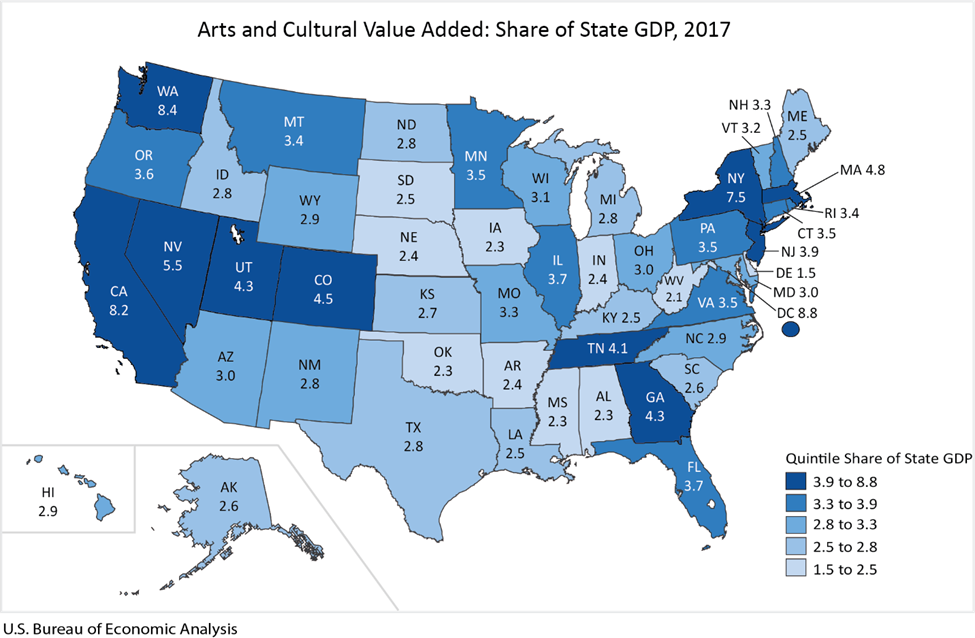
The top arts and cultural industries varied among the states. In the District of Columbia, government and broadcasting were the leading contributors to the share of total GDP. In Washington, publishing and retail industries were the leading contributors to the share of total GDP. In California, information services and independent artists, writers, and performers were the leading contributors to the share of total GDP.
Arts and cultural employment nationwide increased 0.9 percent in 2017. The total number of arts and cultural jobs for the nation was 5.1 million.
Arts and cultural employment increased in 29 states and the District of Columbia. The percent change in arts and cultural employment across all states ranged from 5.6 percent in Washington to -3.6 percent in West Virginia.
For the news release and additional national and state data, see the arts and culture page on bea.gov. Summary sheets for each state show top arts and cultural industries, the sector’s growth rate in the state, employment, compensation of employees, national rankings, and other highlights.
Browse our interactive map for an overview of arts and culture’s impact across the 50 states.
BEA’s Arts and Cultural Production Satellite Account is sponsored by funding from the National Endowment for the Arts. It is one of several satellite accounts that complement BEA’s core statistics by pulling together additional detail on specific industries. Providing a more detailed picture of the arts and cultural economy benefits arts organizations, businesses, economic developers, policymakers, and others interested in this prominent sector.