
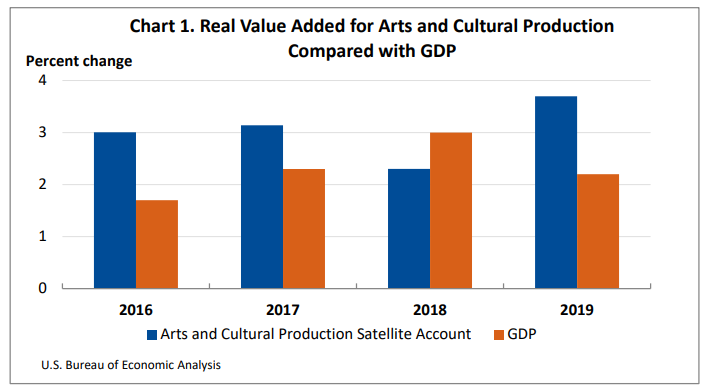
The Arts and Cultural Production Satellite Account released today by the U.S. Bureau of Economic Analysis shows that arts and cultural economic activity, adjusted for inflation, increased 3.7 percent in 2019 after increasing 2.3 percent in 2018. Arts and cultural economic activity accounted for 4.3 percent, or $919.7 billion, of current-dollar gross domestic product, in 2019.
Core arts and cultural production industries, which include performing arts, museums, design services, fine arts education, and education services, increased 3.2 percent, adjusted for inflation, in 2019. Supporting arts and cultural production industries, which includes art support services and information services, increased 3.9 percent in 2019. Information services was the leading contributor to the overall 4.4 percent current-dollar growth in arts and cultural production at the national level in 2019, followed by design services.
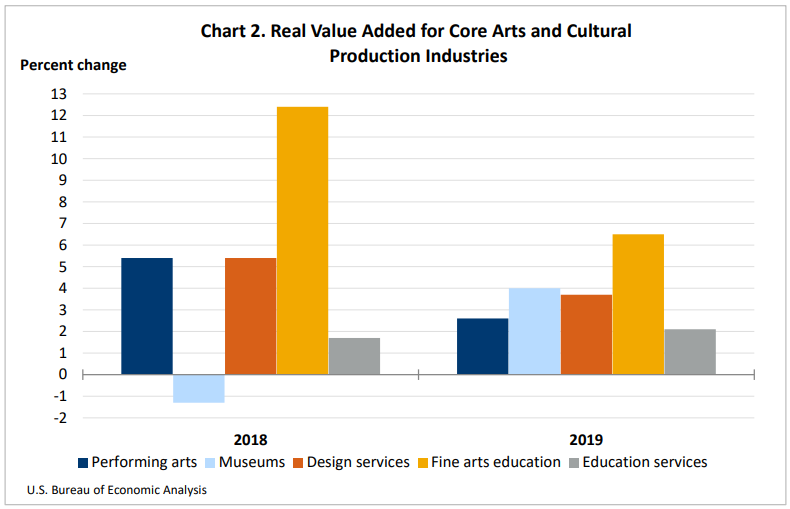
- For performing arts, real value added increased 2.6 percent in 2019 after increasing 5.4 percent in 2018. The leading contributor to the increase was independent artists, writers, and performers, which increased 2.2 percent in 2019 after increasing 5.6 percent in 2018.
- Museums increased 4.0 percent in 2019, after decreasing 1.3 percent in 2018.
- For design services, real value added increased 3.7 percent in 2019 after increasing 5.4 percent in 2018.
- Fine arts education increased 6.5 percent in 2019 after increasing 12.4 percent in 2018.
- Education services increased 2.1 percent in 2019 after increasing 1.7 percent in 2018.
Nominal value added
Nominal value added (not adjusted for inflation) increased 4.4 percent nationally in 2019. The leading contributor to the increase was information services, which includes the broadcasting and publishing industries. Core arts and cultural production industries increased 3.4 percent, to a level of $201.5 billion; the leading contributors to the increase were design services and performing arts. Supporting arts and cultural industries increased 4.8 percent in 2019, to a level of $696.0 billion; the leading contributor to the increase was information services. In 2019, nominal value added in arts and cultural industries increased in every state and the District of Columbia except West Virginia and Wyoming. The percent change in value added in arts and cultural industries across all states ranged from 10.5 percent in Washington to –5.0 percent in Wyoming.
In Washington, the state with the largest increase in value added, retail industries and publishing were the leading contributors to the increase in value added. Construction was the leading contributor to the decrease in value added in Wyoming and West Virginia.
For states and the District of Columbia, the arts and cultural share of total GDP ranged from 8.8 percent in the District of Columbia to 1.4 percent in Delaware. The share for most states ranged between 2 and 5 percent. The District of Columbia, Washington, California, New York, and Nevada were the only areas where the arts and culture share of total GDP exceeded 5 percent.
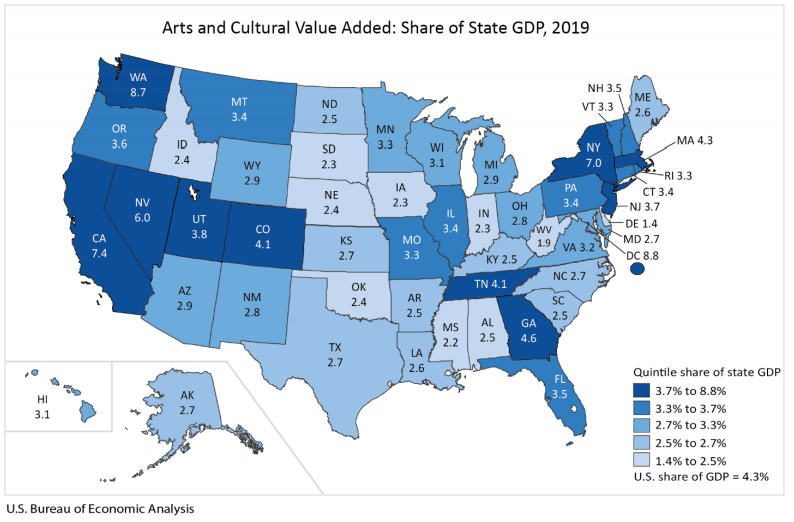
The top arts and cultural industries varied among the states. In the District of Columbia, government and broadcasting were the leading contributors to the share of total state GDP. Publishing and retail industries were the leading contributors to the share of GDP in Washington, while other information services and motion pictures were the leading contributors to the share of GDP in California.
For more information, read the full release.