
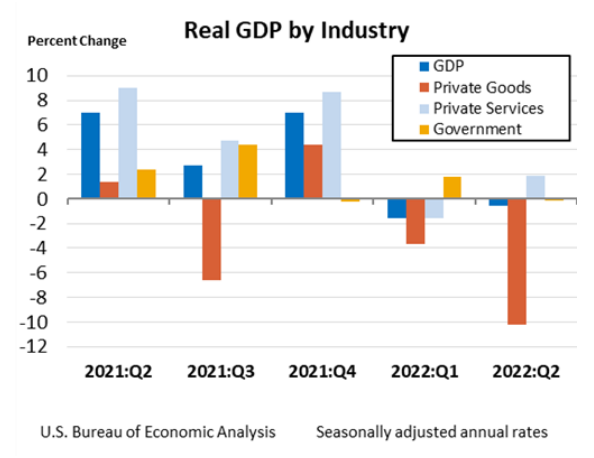
Real gross domestic product (GDP) decreased at an annual rate of 0.6 percent in the second quarter of 2022, following a decrease of 1.6 percent in the first quarter. The second-quarter decrease was the same as previously estimated in the “second” estimate released in August. The smaller decrease in the second quarter, compared to the first quarter, reflected an upturn in exports and an acceleration in consumer spending. For more details, including source data, refer to the Technical Note.
GDP Highlights
The second-quarter decrease in real GDP reflected decreases in inventory investment, housing investment, federal government spending, and state and local government spending. Exports and consumer spending increased. Imports, which are a subtraction in the calculation of GDP, increased.
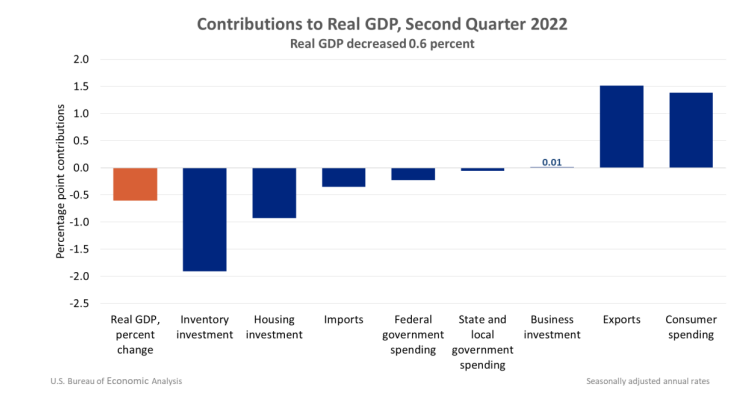
- The decrease in inventory investment primarily reflected a decrease in retail trade (led by “other” general merchandise stores).
- The decrease in housing investment primarily reflected a decrease in brokers’ commissions.
- The decrease in federal government spending primarily reflected a decrease in nondefense spending.
- The decrease in state and local government spending was led by a decrease in investment in structures (notably, educational and highway and street structures).
- The increase in imports reflected an increase in services (led by travel).
- The increase in exports reflected increases in both goods (led by industrial supplies and materials) and services (led by travel).
- The increase in consumer spending reflected an increase in services (led by food services and accommodations as well as “other” services) that was partly offset by a decrease in goods (led by food and beverages).
Updates to GDP
The update primarily reflects an upward revision to consumer spending that was offset by a downward revision to exports. Imports were revised down.
Personal Income
Real disposable personal income (DPI)—personal income adjusted for taxes and inflation—decreased 1.5 percent in the second quarter, a downward revision of 0.9 percentage point from the previous estimate.
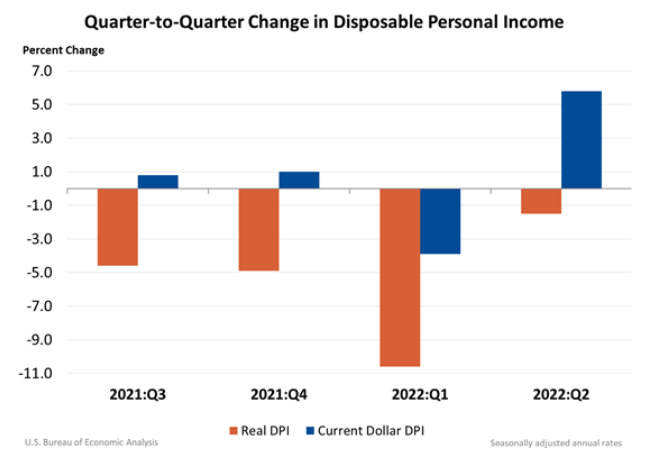
Current-dollar DPI increased 5.7 percent, a downward revision of 0.8 percentage point. The increase in current-dollar DPI primarily reflected increases in compensation and personal income receipts on assets.
Personal saving as a percentage of DPI was 3.4 percent, a downward revision of 0.4 percentage point.
Gross Domestic Income and Corporate Profits
Real gross domestic income (GDI) increased 0.1 percent in the second quarter, a downward revision of 1.3 percentage points from the previous estimate. The average of real GDP and real GDI, a supplemental measure of U.S. economic activity that equally weights GDP and GDI, decreased 0.3 percent, a downward revision of 0.7 percentage point.
Profits increased 4.6 percent at a quarterly rate in the second quarter after increasing 0.1 percent in the first quarter.
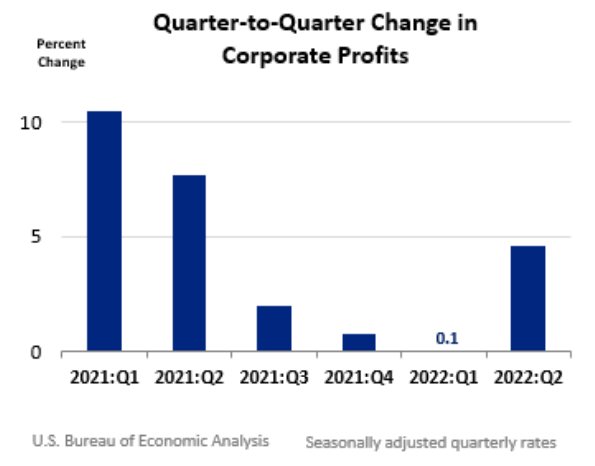
- Profits of domestic nonfinancial corporations increased 7.9 percent after increasing 0.9 percent.
- Profits of domestic financial corporations decreased 9.0 percent after decreasing 5.0 percent.
- Profits from the rest of the world increased 5.8 percent after increasing 3.4 percent.
Corporate profits increased 7.7 percent in the second quarter from one year ago.
Prices
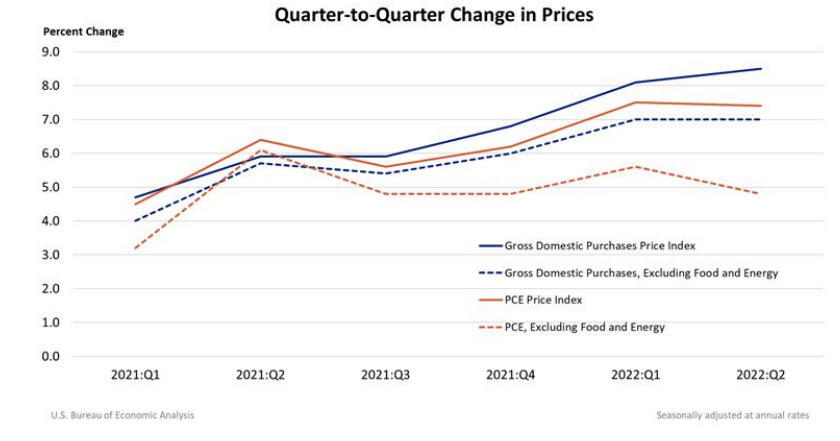
Gross domestic purchases prices, the prices of goods and services purchased by U.S. residents, increased 8.5 percent in the second quarter, an upward revision of 0.1 percentage point from the previous estimate. Excluding food and energy, prices increased 6.9 percent, an upward revision of 0.1 percentage point.
Personal consumption expenditure (PCE) prices increased 7.3 percent, an upward revision of 0.2 percentage point. Excluding food and energy, the PCE “core” price index increased 4.7 percent, an upward revision of 0.3 percentage point.
Gross Domestic Product by Industry
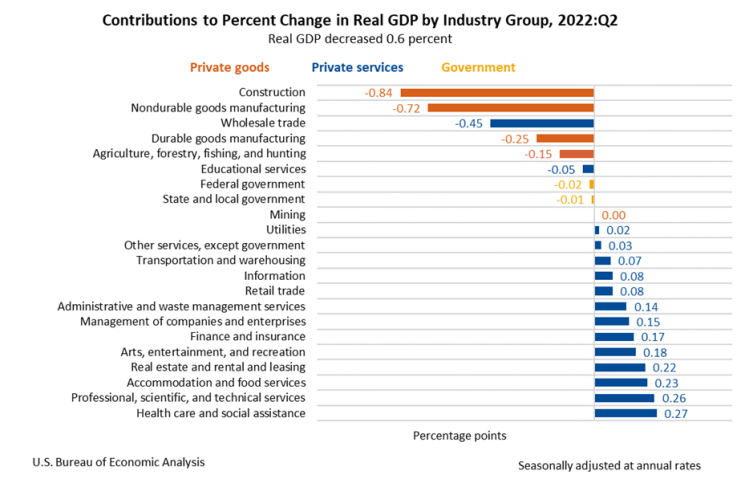
Today’s release includes estimates of GDP by industry, or value added—a measure of an industry’s contribution to GDP. Private goods-producing industries decreased 10.4 percent, private services producing industries increased 2.0 percent, and government decreased 0.2 percent. Overall, 9 of 22 industry groups contributed to the second-quarter decline in real GDP.
- The decrease in private goods-producing industries primarily reflected decreases in construction and nondurable goods manufacturing (led by chemical products manufacturing).
- The increase in private services-producing industries primarily reflected increases in health care and social assistance (led by hospitals); professional, scientific, and technical services (led by computer systems design); real estate and rental and leasing (led by real estate); and accommodation and food services (led by food services). Partly offsetting these increases was a decrease in wholesale trade.
- The decrease in government reflected decreases in federal (led by federal government enterprises) as well as state and local governments.
Annual Update of the National Economic Accounts
Today’s release presents results from the Annual Update of the National Economic Accounts and includes revised estimates for the first quarter of 2017 through the first quarter of 2022 and resulted in revisions to GDP, GDP by industry, GDI, and their major components. Refer to Information on Updates to the National Economic Accounts for the complete table release schedule and a summary of results through 2021, which includes a discussion of methodology changes. A table showing the major current-dollar revisions and their sources for each component of GDP, national income, and personal income is also provided. For more information on the NEA Annual Update, refer to the Technical Note.
For more information, read the full release.