
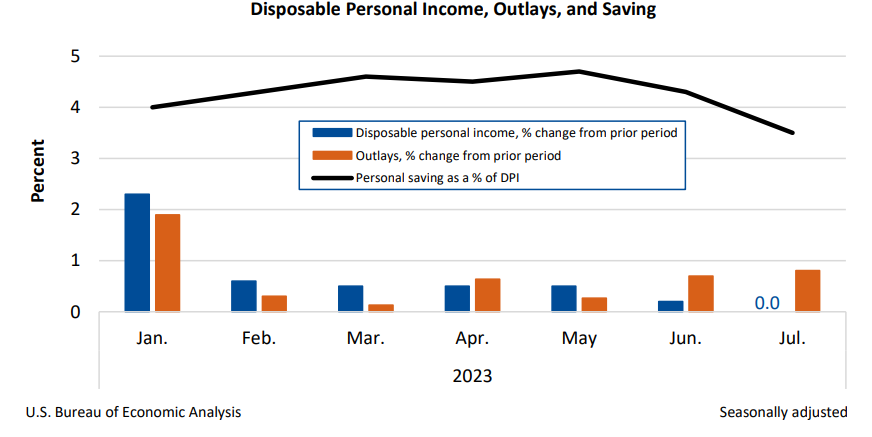
Personal income increased $45.0 billion (0.2 percent at a monthly rate) in July. Disposable personal income (DPI)—personal income less personal current taxes— increased $7.3 billion (less than 0.1 percent). Personal outlays—the sum of personal consumption expenditures (PCE), personal interest payments, and personal current transfer payments—increased $153.8 billion (0.8 percent) and consumer spending increased $144.6 billion (0.8 percent). Personal saving was $705.6 billion and the personal saving rate—personal saving as a percentage of disposable personal income—was 3.5 percent in July.
Personal income
In July, personal income increased, primarily reflecting an increase in compensation that was partly offset by a decrease in personal current transfer receipts.
- Within compensation, the increase was led by private wages and salaries, based on data from the Bureau of Labor Statistics (BLS) Current Employment Statistics (CES). Services-producing industries increased $27.0 billion and goods-producing industries increased $9.8 billion.
- The decrease in personal current transfer receipts primarily reflected decreases in Medicaid and “other” government social benefits.
Consumer spending
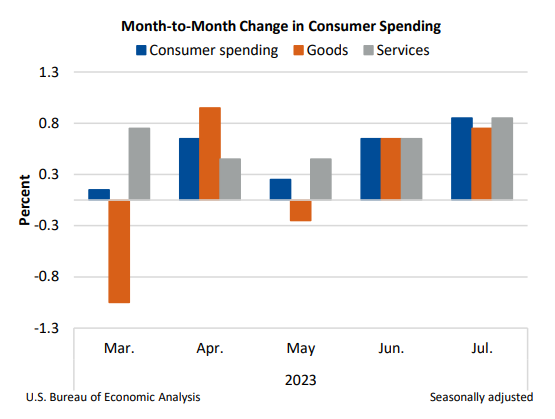
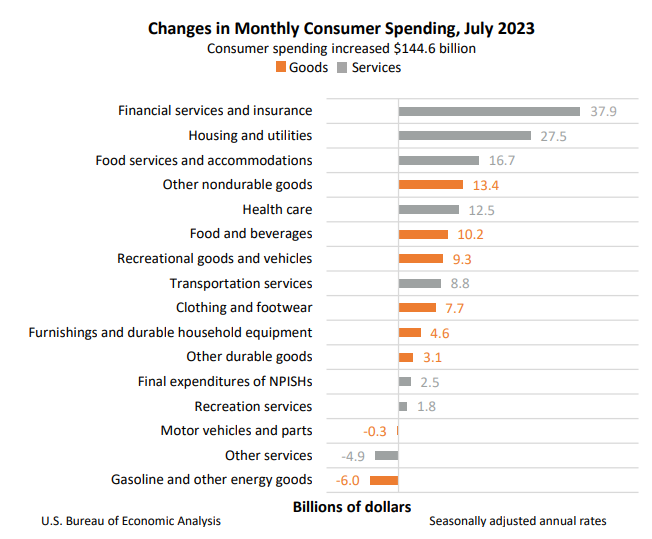
The $144.6 billion increase in July reflected increases in spending for both services and goods.
- Within services, the largest contributors to the increase were financial services and insurance (led by portfolio management and investment advice services), based on market indicators and BLS price data; housing and utilities (led by housing); food services and accommodation (led by food services), based on Census Monthly Retail Trade Survey (MRTS) data; and health care (led by outpatient services), based on BLS CES data.
- Within goods, the largest contributors to the increase were “other” nondurable goods (led by pharmaceuticals and recreational items), based on private trade data as well as MRTS data, and food and beverages (led by groceries), based on MRTS data.
PCE price index
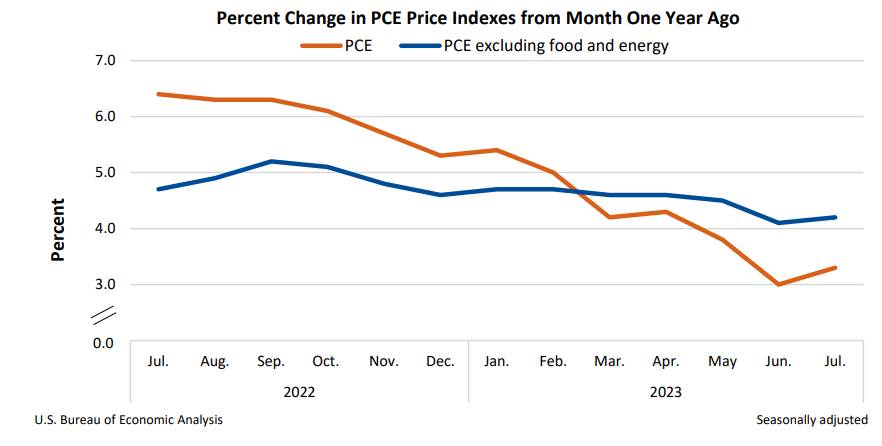
From the preceding month, the PCE price index for July increased 0.2 percent. Food prices increased 0.2 percent and energy prices increased 0.1 percent. Excluding food and energy, the PCE price index increased 0.2 percent. For a comparison of PCE prices to BLS consumer price indexes, refer to NIPA Table 9.1U. Reconciliation of Percent Change in the CPI with Percent Change in the PCE Price Index.
From the same month one year ago, the PCE price index for July increased 3.3 percent. Prices for goods decreased 0.5 percent and prices for services increased 5.2 percent. Food prices increased 3.5 percent and energy prices decreased 14.6 percent. Excluding food and energy, the PCE price index increased 4.2 percent from one year ago.
Real disposable personal income and consumer spending
Real DPI decreased 0.2 percent in July. Real consumer spending increased 0.6 percent, reflecting increases in spending on goods of 0.9 percent and spending on services of 0.4 percent. Within goods, the largest contributors to the increase were “other” nondurable goods (led by games, toys, and hobbies) and recreational goods and vehicles (led by video, audio, photographic, and information processing equipment and media). Within services, the leading contributors to the increase were food services and accommodations (led by food services); financial services and insurance (led by portfolio management and investment advice services); and housing and utilities (led by utilities).
For more information, read the full release.