
Real gross domestic product (GDP) increased at an annual rate of 2.1 percent in the second quarter of 2023, according to the “third” estimate. In the first quarter, real GDP increased 2.2 percent (revised). The increase in the second quarter primarily reflected increases in business investment, consumer spending, and state and local government spending that were partly offset by a decrease in exports. Imports, which are a subtraction in the calculation of GDP, decreased.
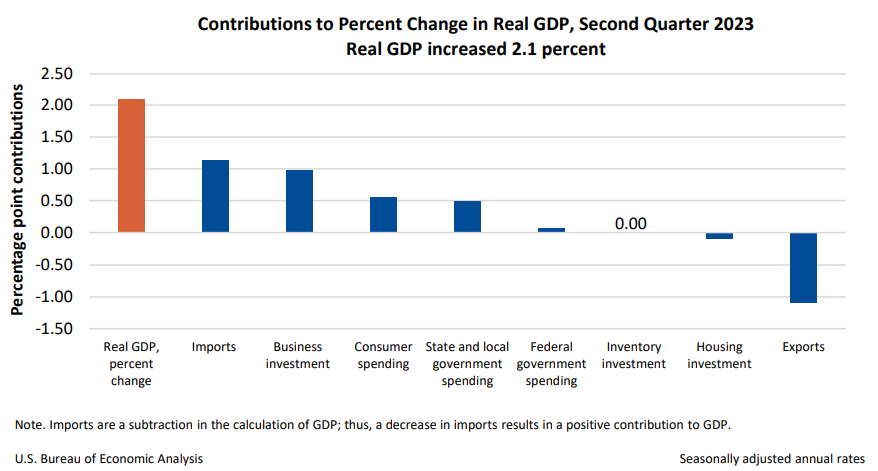
- The increase in business investment reflected increases in structures, equipment, and intellectual property products.
- The increase in consumer spending reflected increases in both services (led by health care, as well as financial services and insurance) and goods (led by recreational goods and vehicles, as well as gasoline and other energy goods).
- The increase in state and local government spending reflected increases in investment in structures and compensation of state and local government employees.
- The decrease in exports reflected a decrease in goods (led by industrial supplies and materials; consumer goods, except food and automotive; and foods, feeds, and beverages) that was partly offset by an increase in services (led by travel).
Compared to the first quarter, the deceleration in GDP in the second quarter primarily reflected a deceleration in consumer spending, a downturn in exports, and a deceleration in federal government spending. These movements were partly offset by an upturn in inventory investment, an acceleration in business investment, and a smaller decrease in housing investment. Imports turned down.
Prices
Gross domestic purchases prices, the prices of goods and services purchased by U.S. residents, increased 1.4 percent in the second quarter after increasing 3.6 percent in the first quarter. Excluding food and energy, prices increased 2.1 percent after increasing 4.1 percent.
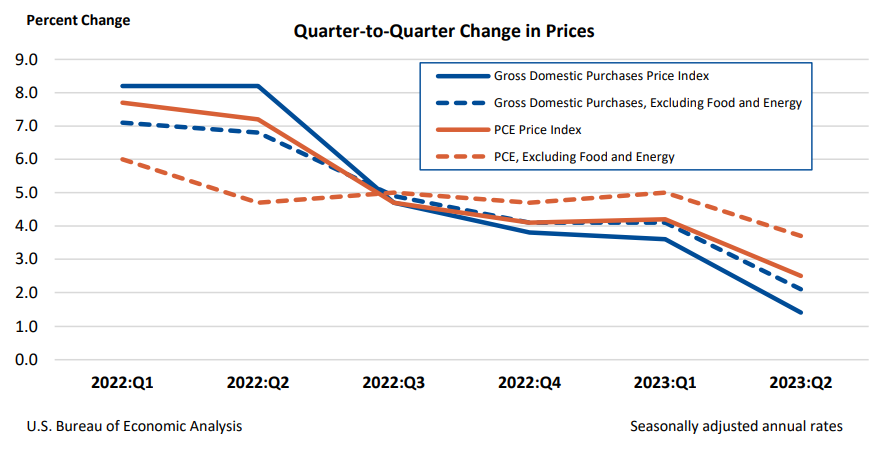
Personal consumption expenditure (PCE) prices increased 2.5 percent in the second quarter after increasing 4.2 percent in the first quarter. Excluding food and energy, the PCE “core” price index increased 3.7 percent after increasing 5.0 percent.
Personal income and saving
Real disposable personal income (DPI)— personal income adjusted for taxes and inflation—increased 3.5 percent in the second quarter after increasing 10.8 percent in the first quarter.
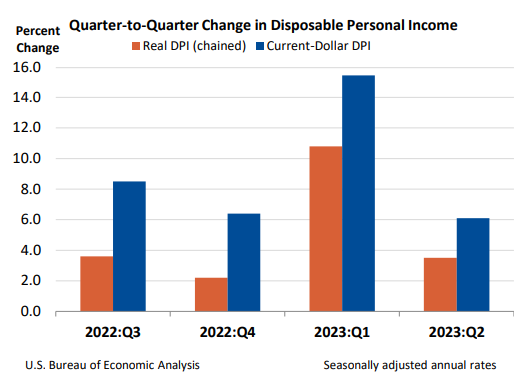
Current-dollar DPI increased 6.1 percent in the second quarter, following an increase of 15.5 percent in the first quarter. The increase in the second quarter primarily reflected increases in compensation, personal income receipts on assets, personal current transfer receipts, and rental income of persons, as well as a decrease in personal current taxes, which are a subtraction in the calculation of DPI.
Personal saving as a percentage of DPI was 5.2 percent in the second quarter, compared with 4.8 percent in the first quarter.
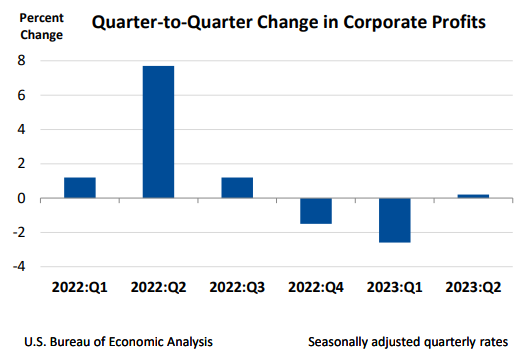
Corporate profits from current production
Profits increased 0.2 percent at a quarterly rate in the second quarter after decreasing 2.6 percent in the first quarter.
- Profits of domestic financial corporations decreased 10.9 percent after increasing 3.6 percent.
- Profits of domestic nonfinancial corporations increased 1.8 percent after decreasing 4.1 percent.
- Profits from the rest of the world (net) increased 4.5 percent after decreasing 1.6 percent.
Corporate profits decreased 2.7 percent from the second quarter one year ago.
Updates to GDP
The update from the “second” estimate primarily reflected a downward revision to consumer spending that was partly offset by upward revisions to business investment, exports, and inventory investment. Imports were revised down.
For additional details on the estimates, refer to the Technical Note.
Comprehensive Update of the National Economic Accounts
Today’s release presents results from the comprehensive update of the National Economic Accounts (NEAs), which include the National Income and Product Accounts (NIPAs) and the Industry Economic Accounts (IEAs). The update includes revised statistics for GDP, GDP by industry, GDI, and their major components. Current-dollar measures of GDP and related components are revised from the first quarter of 2013 through the first quarter of 2023. GDI and selected income components are revised from the first quarter of 1979 through the first quarter of 2023.
The reference year for chain-type quantity and price indexes and for the chain-dollar estimates is updated to 2017 from 2012. More information on the 2023 Comprehensive Update is found in the "Preview of the 2023 Comprehensive Update of the National Economic Accounts" in the Survey of Current Business.
With today's release, most data are available through BEA’s Interactive Data application on the BEA website (www.bea.gov). Refer to Information on Updates to the National Economic Accounts for the complete table release schedule and a summary of results through 2022, which includes information on methodology changes. A table showing the major current-dollar revisions and their sources for each component of GDP, national income, and personal income is also provided. An article describing the update in more detail will be forthcoming in the Survey of Current Business.
Additional GDP by industry statistics will be released this fall. BEA will send an advisory with the exact date and time when available.
For more information, read the full release.