BEA has significantly expanded its global value chain statistics to help policymakers and the public better understand international supply chains.
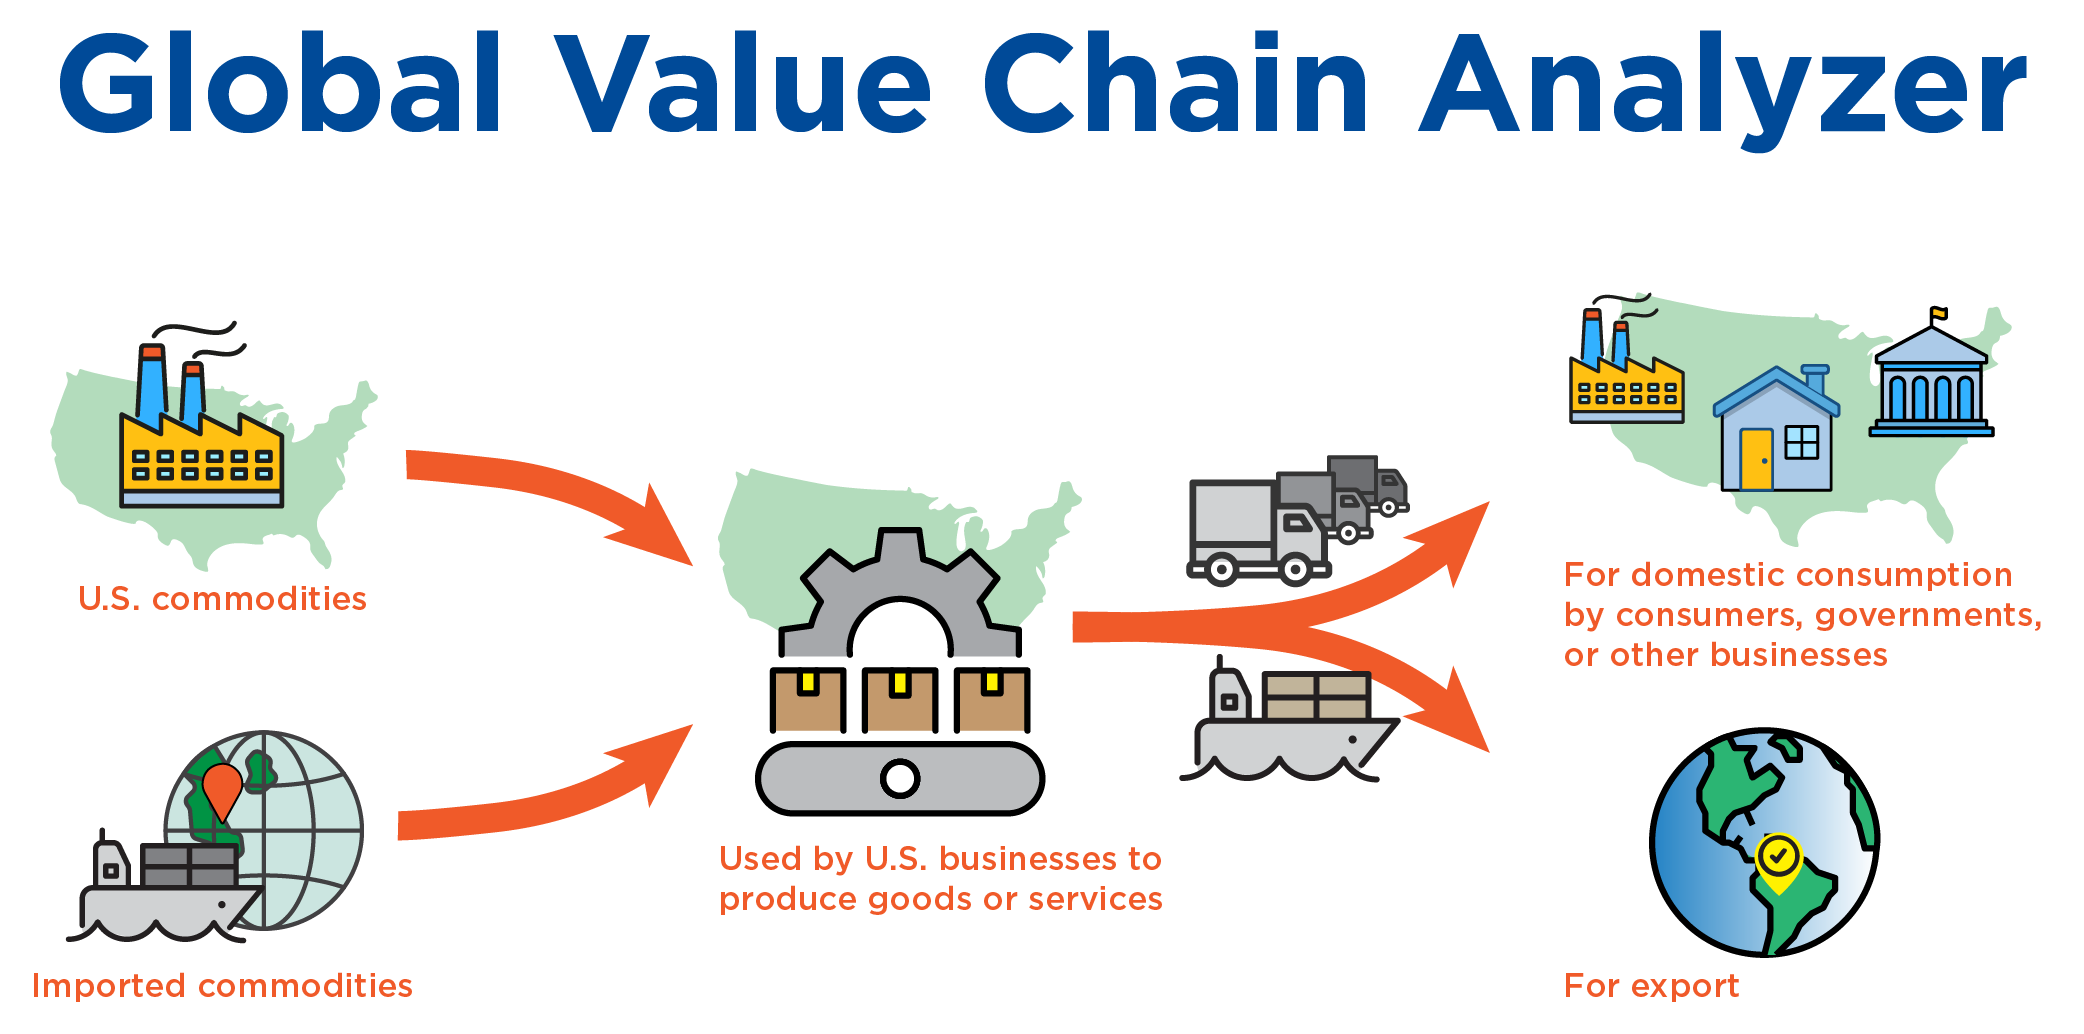
Global value chain statistics lay out the mix of domestic and imported value included in the cross-border production chains of goods and services. They are also known as statistics measuring trade in value added.
On May 21, BEA expanded these data to encompass the domestic and imported sources of value throughout the U.S. economy. This provides a powerful supplement to our core statistics on trade, industries, and the components of gross domestic product (GDP).
Because GDP is a measure of domestic production, BEA subtracts the total value of imports when estimating GDP. Little detail was available until now on the mix of imports embedded within the individual components of GDP: consumer spending, business investment, government spending, and exports.
When BEA began providing its first global value chain data in 2021, only the production chains for U.S. exports were covered.
With our newly expanded tool, renamed the Global Value Chain Analyzer, you can explore the data and create custom tables to answer a broad range of questions. View the data by type of commodity, by U.S. industry, and by import from or export to seven countries and regions: Canada, China, Europe, Japan, Mexico, the rest of Asia and the Pacific, and the rest of the world.
The data cover value created in the United States by domestic industries; imported intermediate inputs, such as imported metal used in U.S. construction; and imported final goods and services, such as foreign autos sold to U.S. consumers. Annual data are available for 2007-2024.
You can use the analyzer to look upstream from a final good or service to its sources of value through various lenses. For example, this table shows pharmaceuticals purchased by U.S. consumers (line 1) broken into domestic value added; imports of intermediate products (those imports embedded in domestic production); and imports of final products.
Digging deeper, this table shows how much each country and domestic industry contributes to the value of pharmaceuticals sold to U.S. consumers. By using the filter tab, you can further narrow the results to separately view imported intermediate products (imports embedded in domestically-produced pharmaceuticals) or imported final products (finished pharmaceuticals ready for immediate use).
You also can look downstream from an industry to identify the ultimate destination of the industry’s value added. For example, this table shows the domestic value added in the U.S. production of automobiles and light trucks. The U.S. value is shown broken down by the components of GDP, including exports. This table shows the destination of those exports, along with the amount of value staying in the United States.
BEA produces the statistics on global value chains, or trade in value added, by using our detailed supply and use tables, import matrices, and international transactions data.
For more information, see BEA’s Global Value Chains webpage.