GDP by State
Gross Domestic Product by State and Personal Income by State, 3rd Quarter 2025
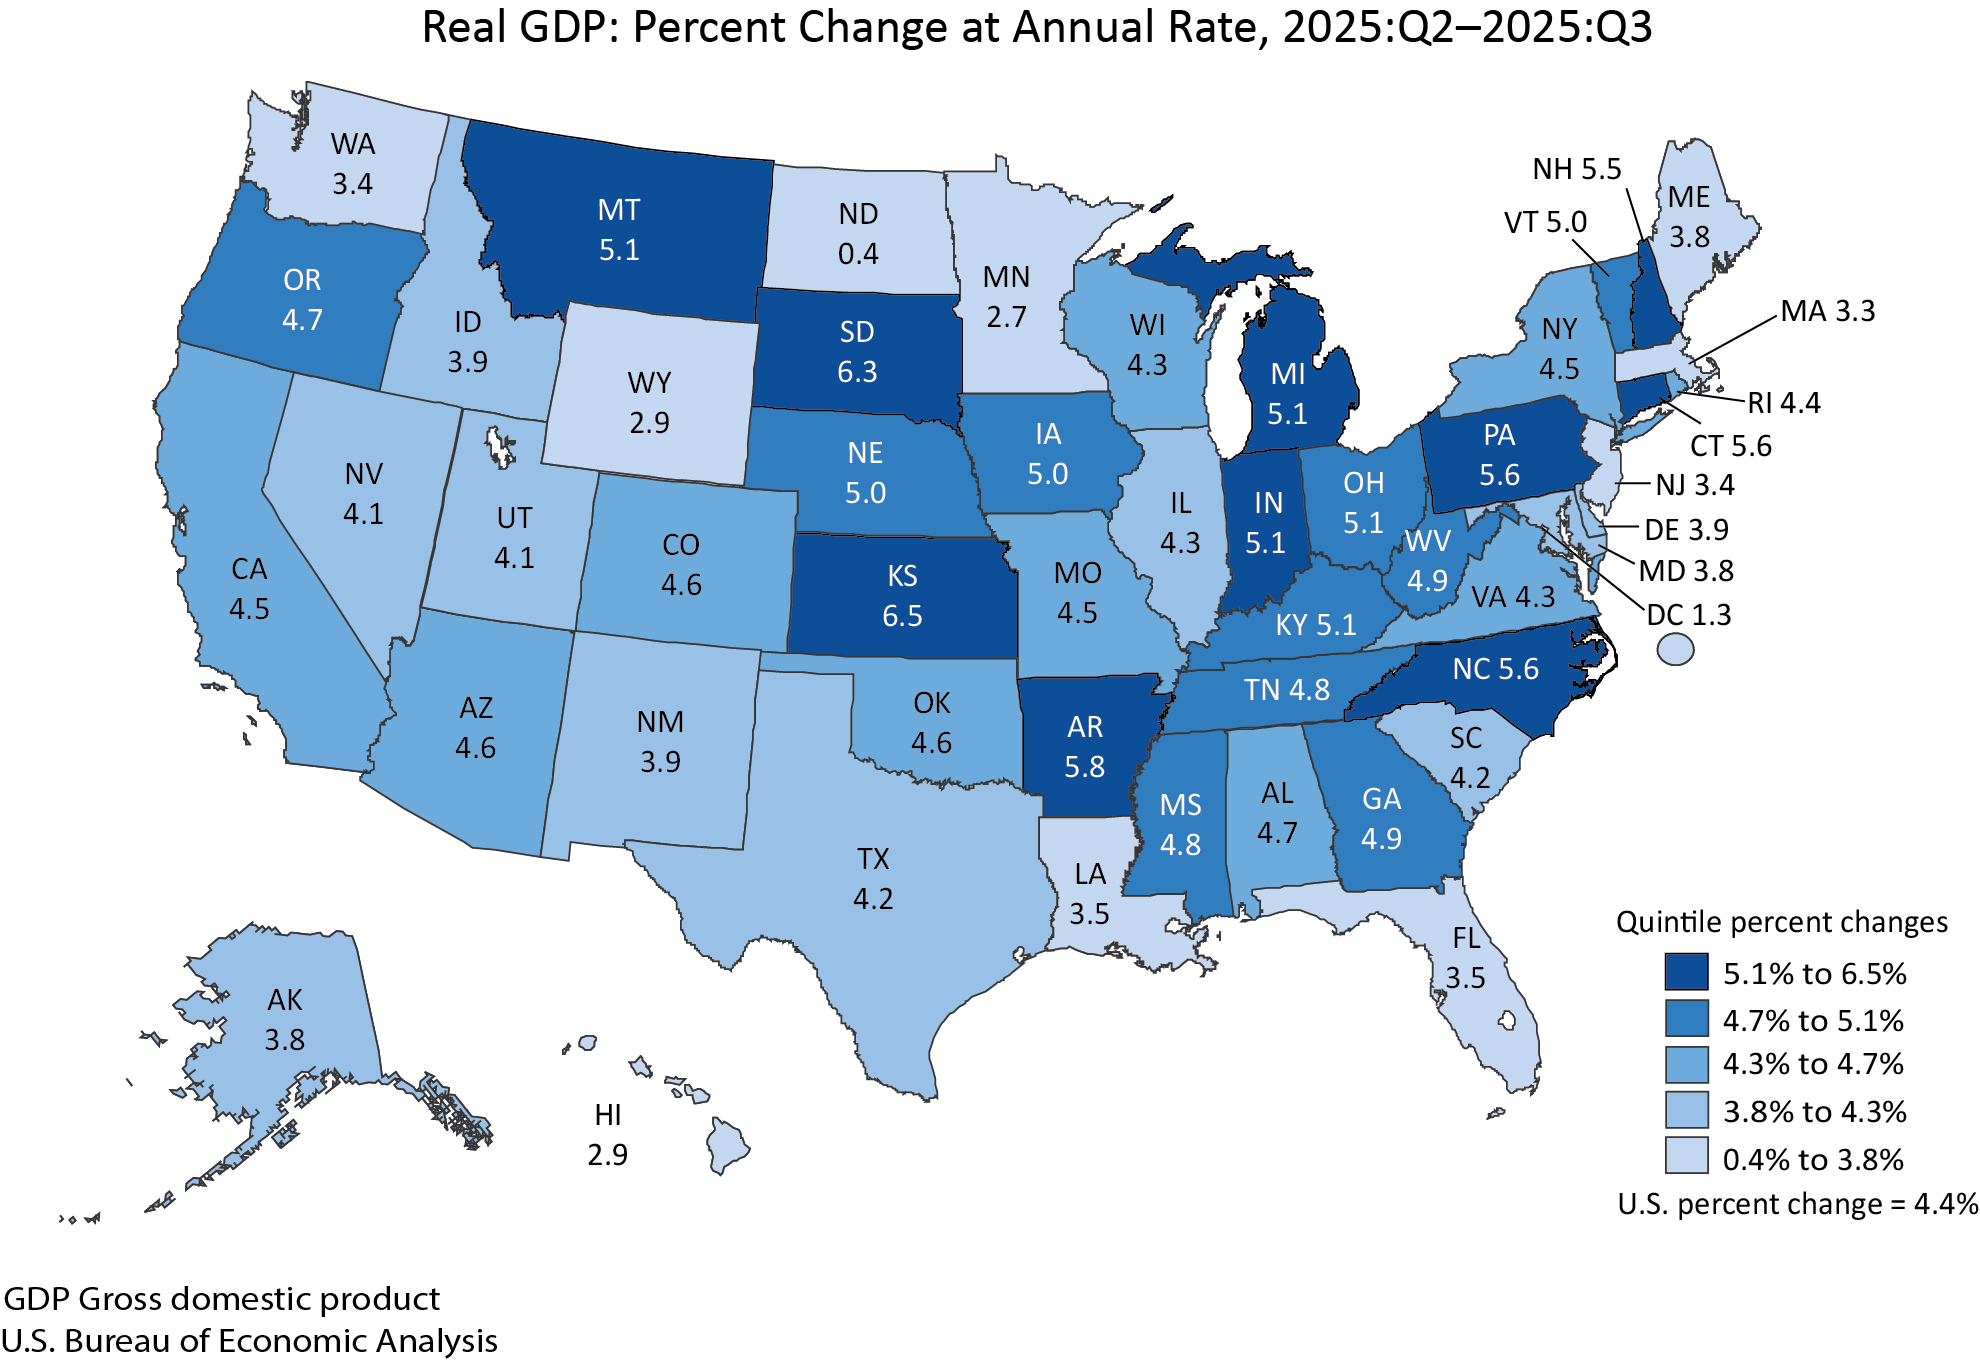
Real gross domestic product (GDP) increased in all 50 states and the District of Columbia in the third quarter of 2025. State-level changes ranged from a 6.5 percent increase in Kansas to a 0.4 percent increase in North Dakota.
Personal income increased in all 50 states and the District of Columbia in the third quarter of 2025. State-level changes ranged from a 6.3 percent increase in Kansas to a 0.1 percent increase in Louisiana.
- Current Release: January 23, 2025
- Next Release: April 9, 2026
- 2023 Comprehensive Update of the Regional Economic Accounts Provides details about the update, including background materials, data availability, and table changes.
- Regional Data Archives Access previously published regional data.
- Interactive Tables: GDP by state
- Interactive Maps: GDP by state
- BEARFACTS BEA Regional Fact Sheet about personal income and gross domestic product.
- SCB, Results of the 2025 Annual Update of the Regional Economic Accounts, January 2026
- New and Updated Estimates of the Regional Economic Accounts: Results of the 2023 Comprehensive Update | SCB, December 2023
- The 2022 Annual Update of the Regional Economic Accounts: New Statistics for 2021 and Updated Statistics for 2017–2020: Toward Regional Economic Recovery from the COVID–19 Pandemic | SCB, November 2022
- Regional Quarterly Report, November 2020
- Regional Quarterly Report, May 2019
- Regional Quarterly Report, March 2019
- Data Archive Previously published estimates contain historical data and have since been revised.
What is GDP by State?
A comprehensive measure of the economies of each state and the District of Columbia. GDP estimates the value of the goods and services produced in a state. The data include breakdowns of industries' contributions to each state economy.
Contact Personnel
-
Technical (GDP)Todd Siebeneck
-
Technical (Income)Matthew von Kerczek
-
MediaConnie O'Connell

