BEA 26-42
Scheduled Date
December 2 08:30:am
Release Title
GDP by County and Personal Income by County, 2025

An official website of the United States government
Real gross domestic product (GDP) increased in 2,273 counties, decreased in 809 counties, and was unchanged in 24 counties in 2024. County-level changes ranged from a 76.6 percent increase in Carter County, MT, to a 46.3 percent decline in Baca County, CO.
Personal income, in current dollars, increased in 2,768 counties, decreased in 331, and was unchanged in 7 counties in 2024. County-level changes ranged from a 22.6 percent increase in Harding County, SD, to a 23.3 percent decline in Issaquena County, MS.
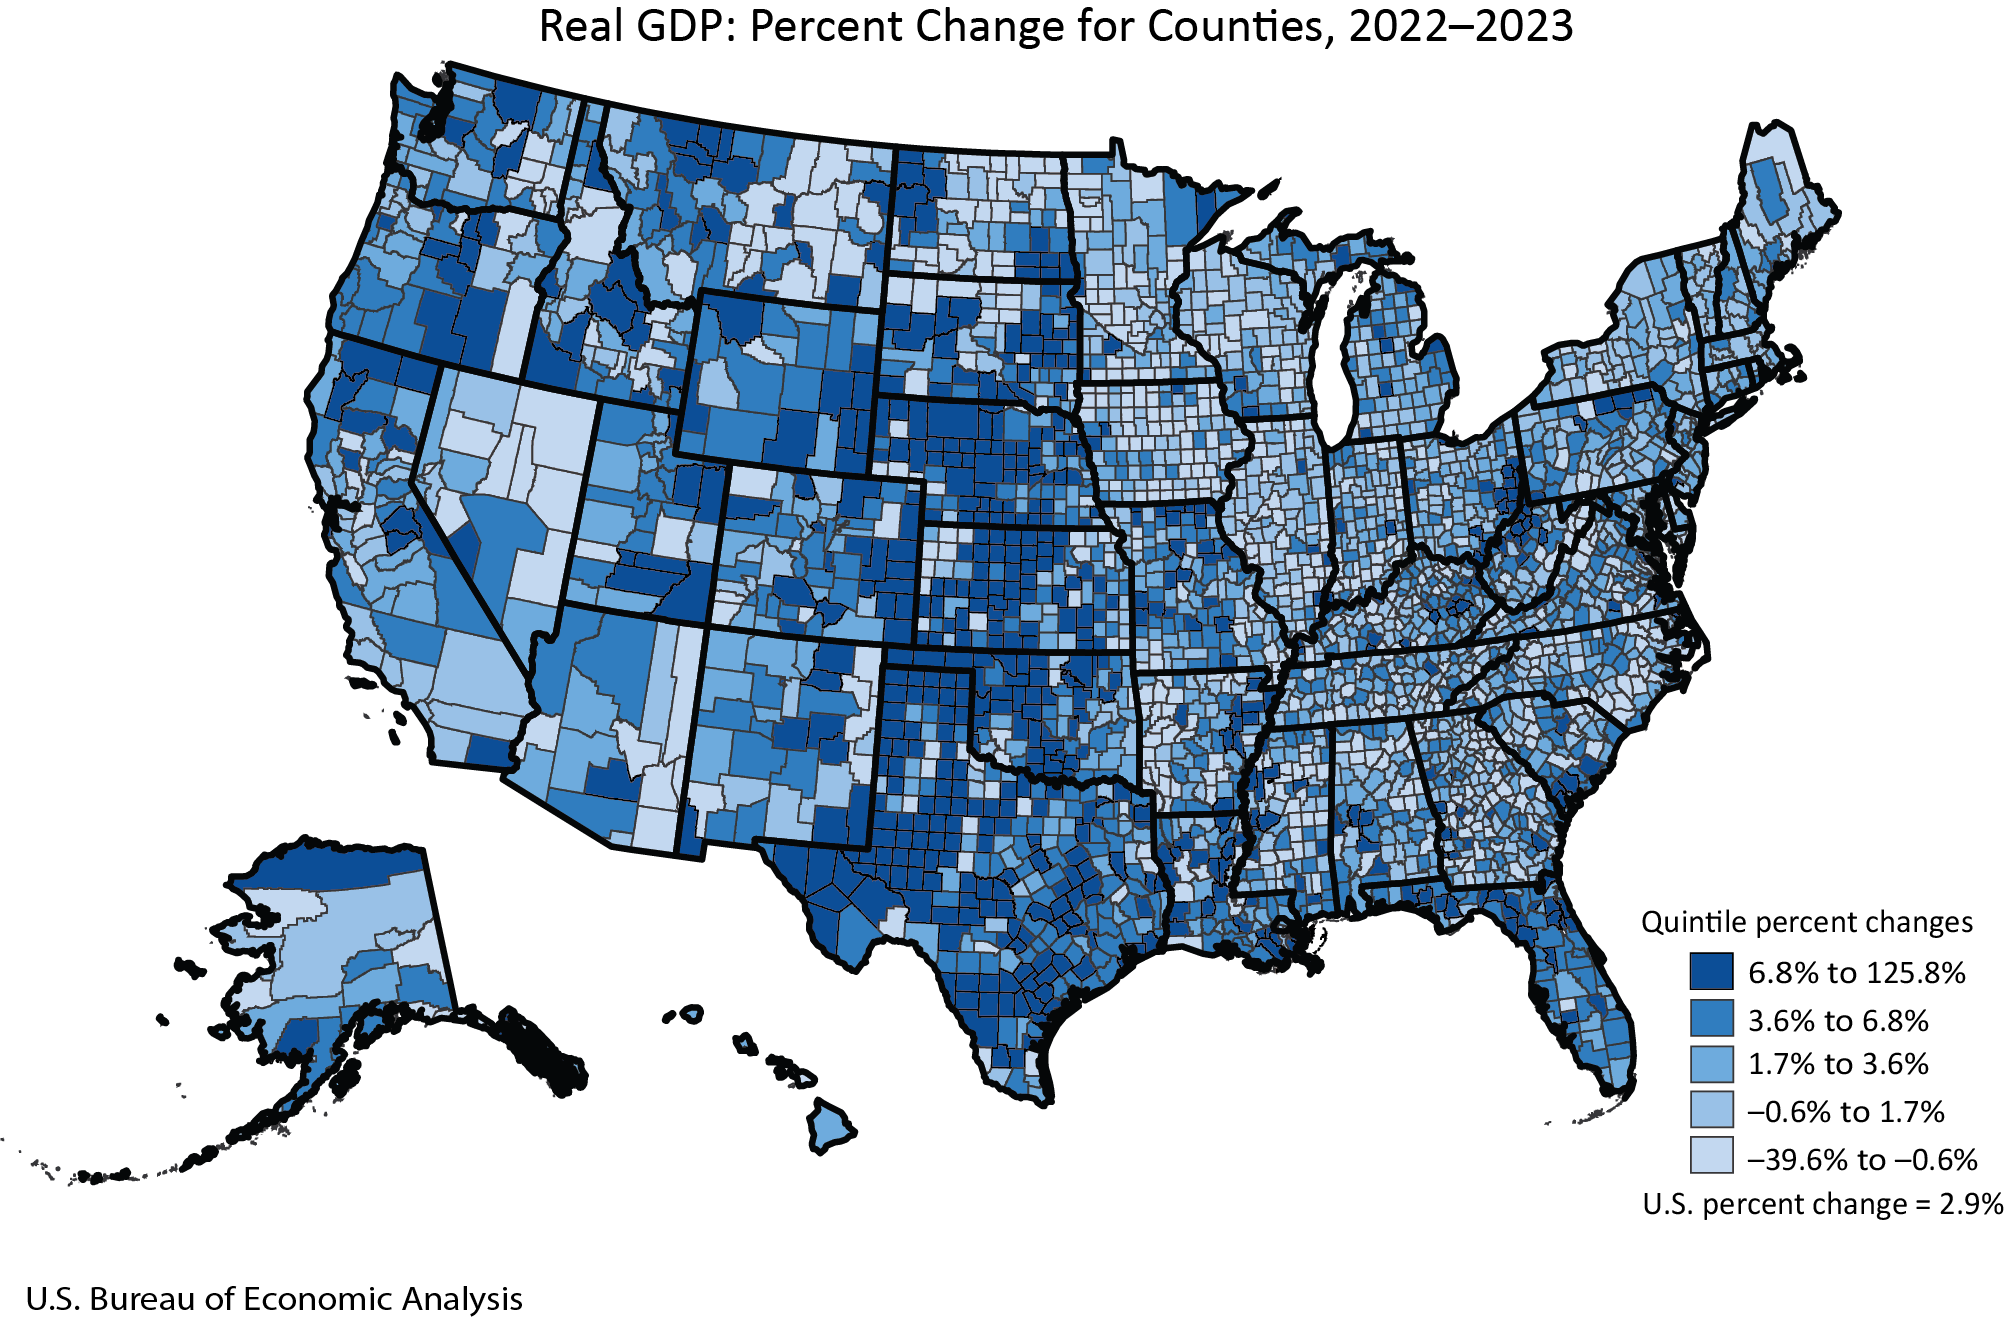
In 2023, real gross domestic product (GDP) increased in 2,357 counties, decreased in 734 counties, and was unchanged in 23 counties. The percent change in real GDP ranged from 125.8 percent in Throckmorton County, TX, to –39.6 percent in Lincoln County, WA.
In 2022, real gross domestic product (GDP) increased in 1,780 counties, decreased in 1,296 counties, and was unchanged in 38 counties. The percent change in real GDP ranged from 71.1 percent in Chouteau County, MT, to -57.6 percent in Kiowa County, CO.
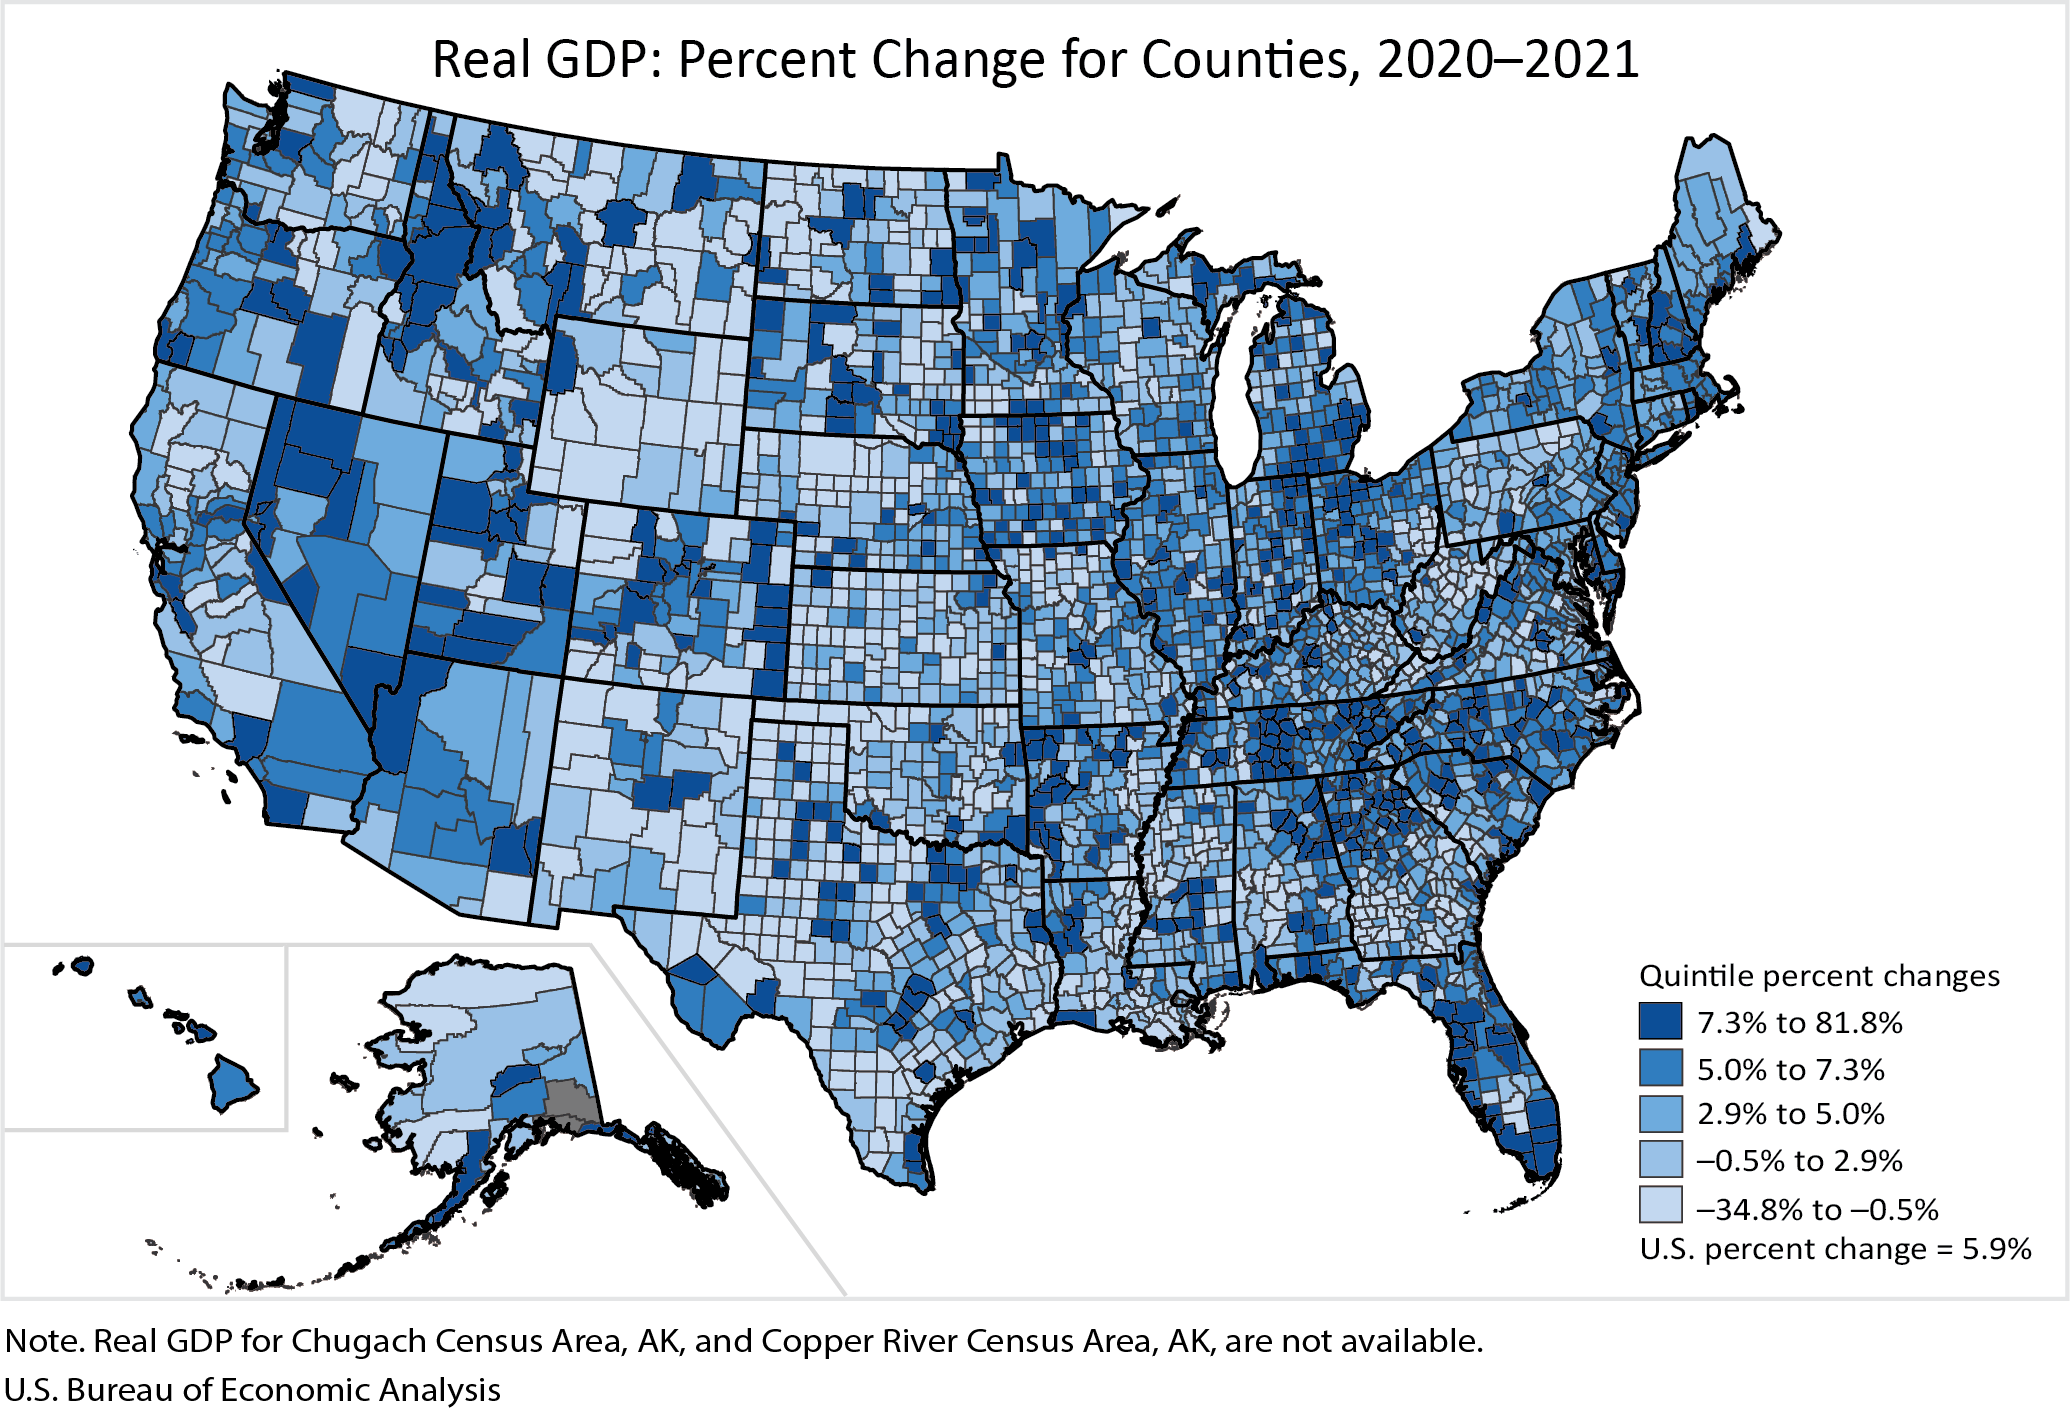
Real gross domestic product (GDP) increased in 2,404 counties, decreased in 691 counties, and was unchanged in 17 counties in 2021. The percent change in real GDP ranged from 81.8 percent in Coke County, TX, to –34.8 percent in Chouteau County, MT.
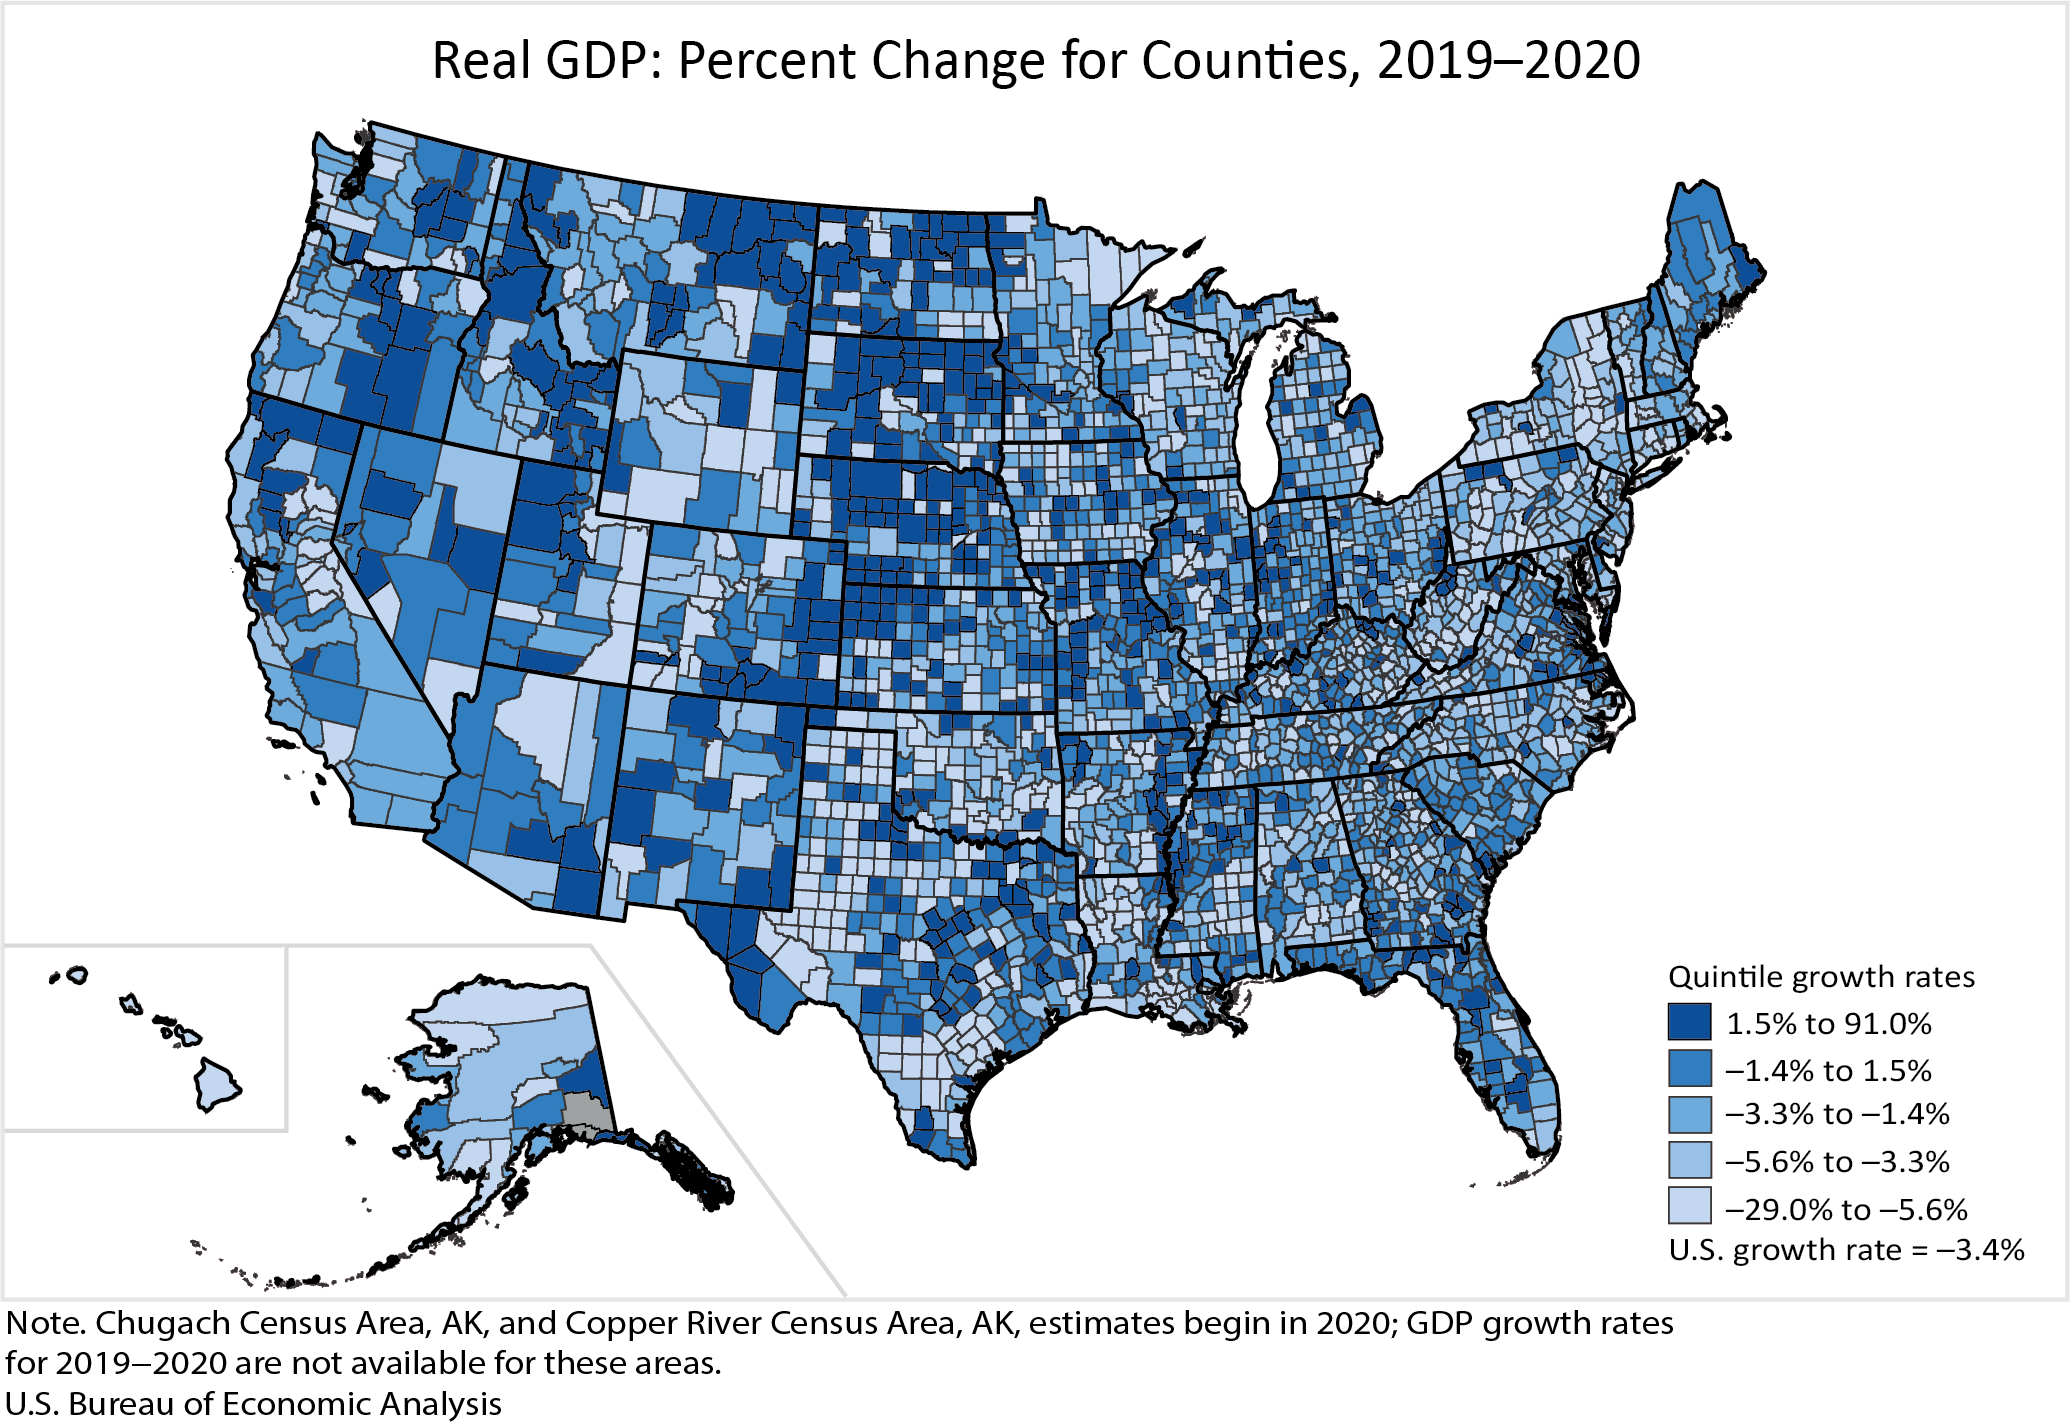
Real gross domestic product (GDP) increased in 864 counties, decreased in 2,234 counties, and was unchanged in 14 counties in 2020. The percent change in real GDP ranged from 91.0 percent in Foard County, TX, to –29.0 percent in Skagway Municipality, AK.