BEA 21-63
Scheduled Date
December 8 08:30:am
Release Title
Gross Domestic Product by County and Metropolitan Area, 2020
Release URL

An official website of the United States government
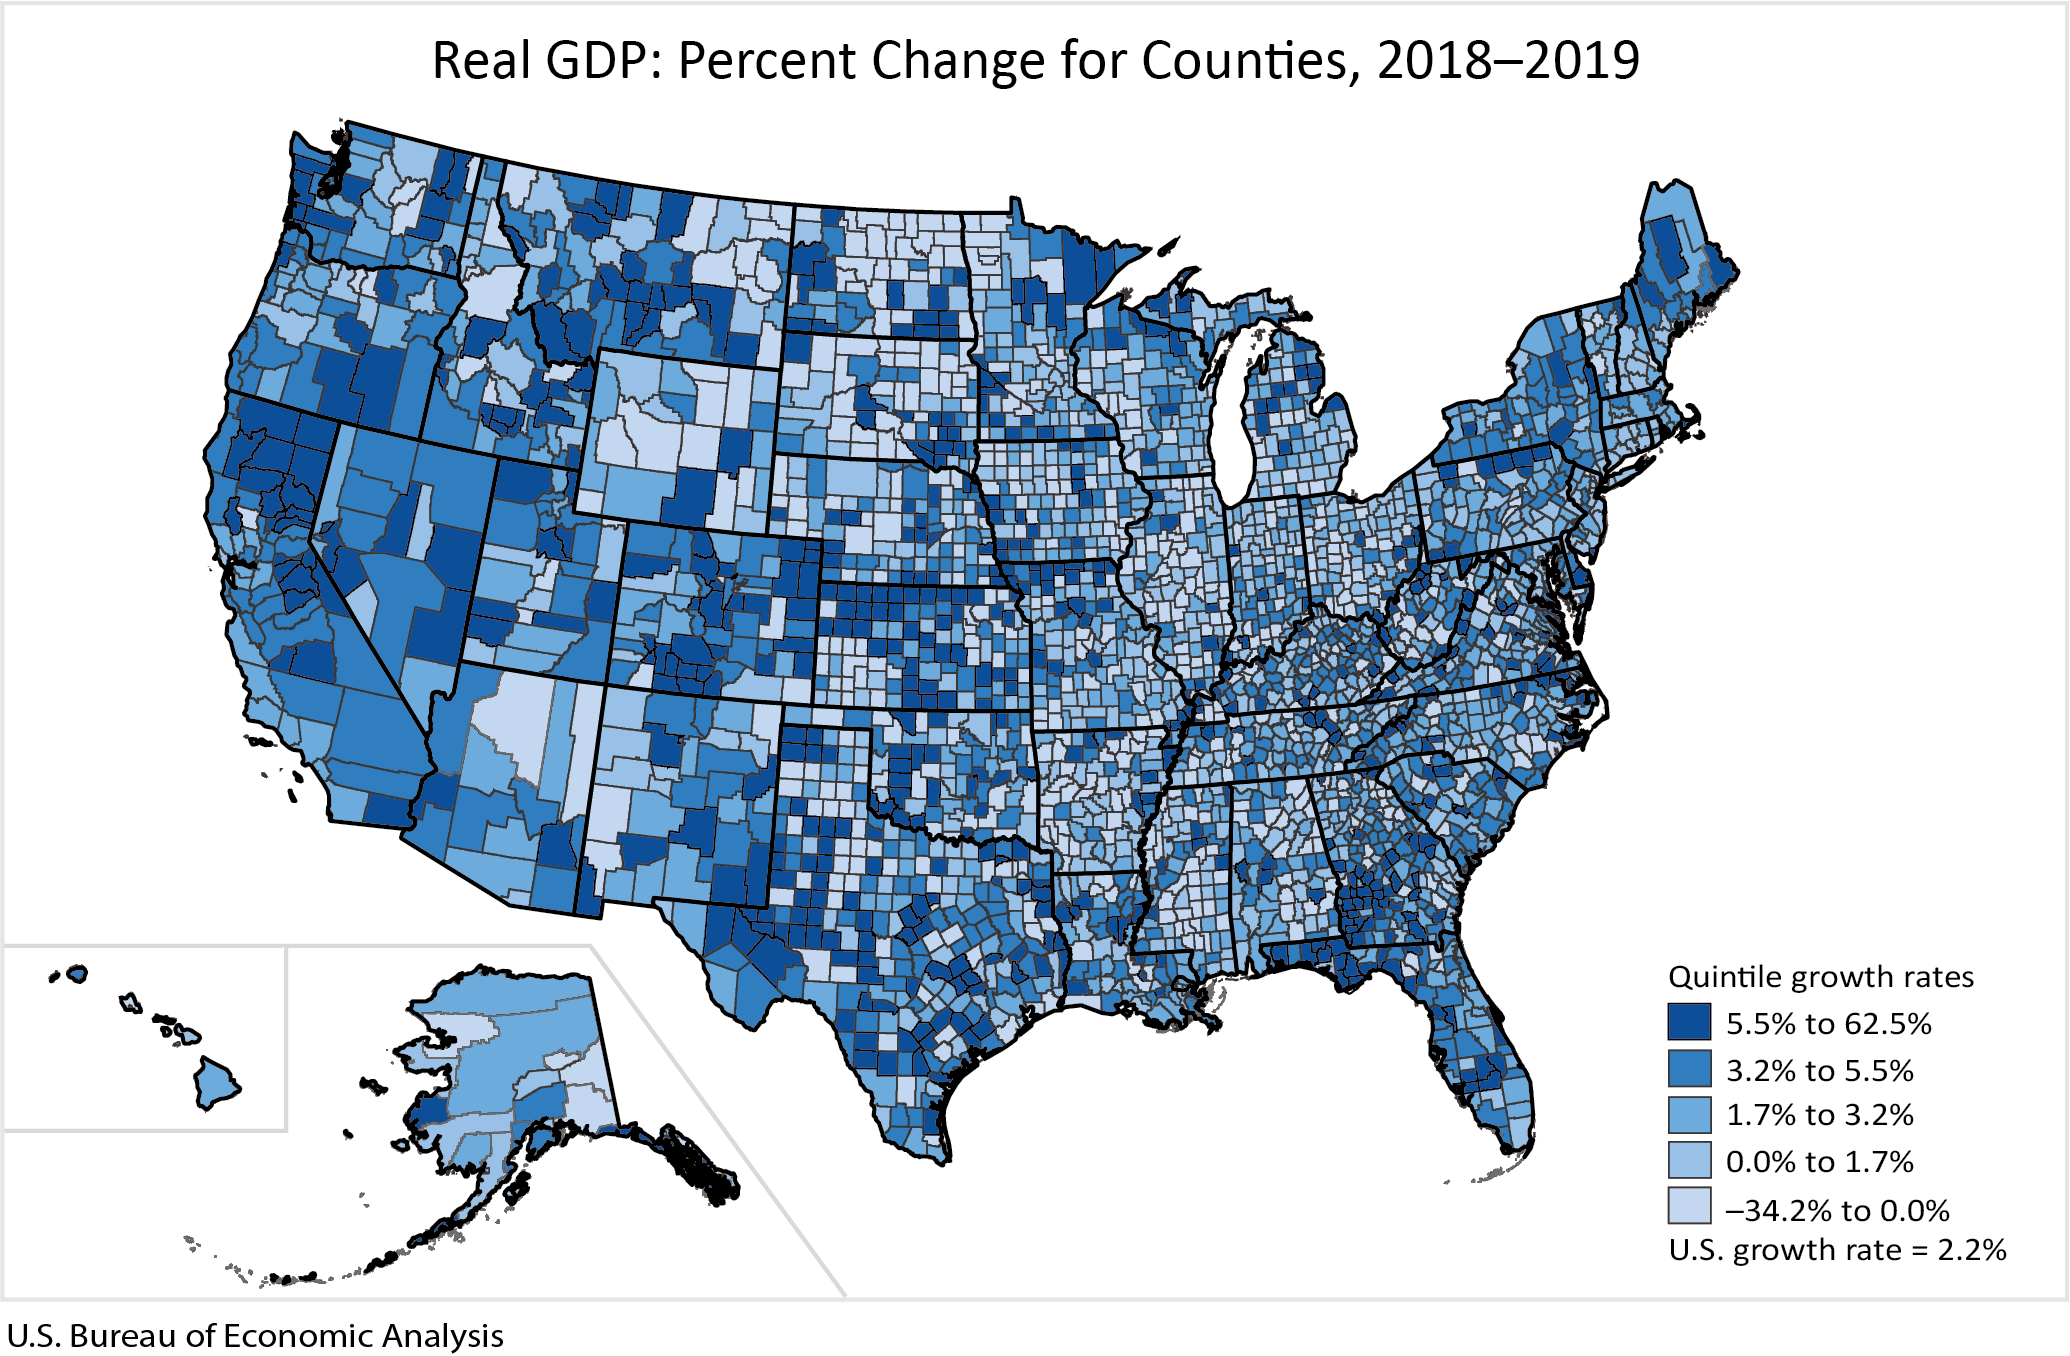
Real gross domestic product (GDP) increased in 2,484 counties, decreased in 612 counties, and was unchanged in 17 counties in 2019. The percent change in real GDP ranged from 62.5 percent in Greensville + Emporia, VA, to –34.2 percent in Jackson County, WV.
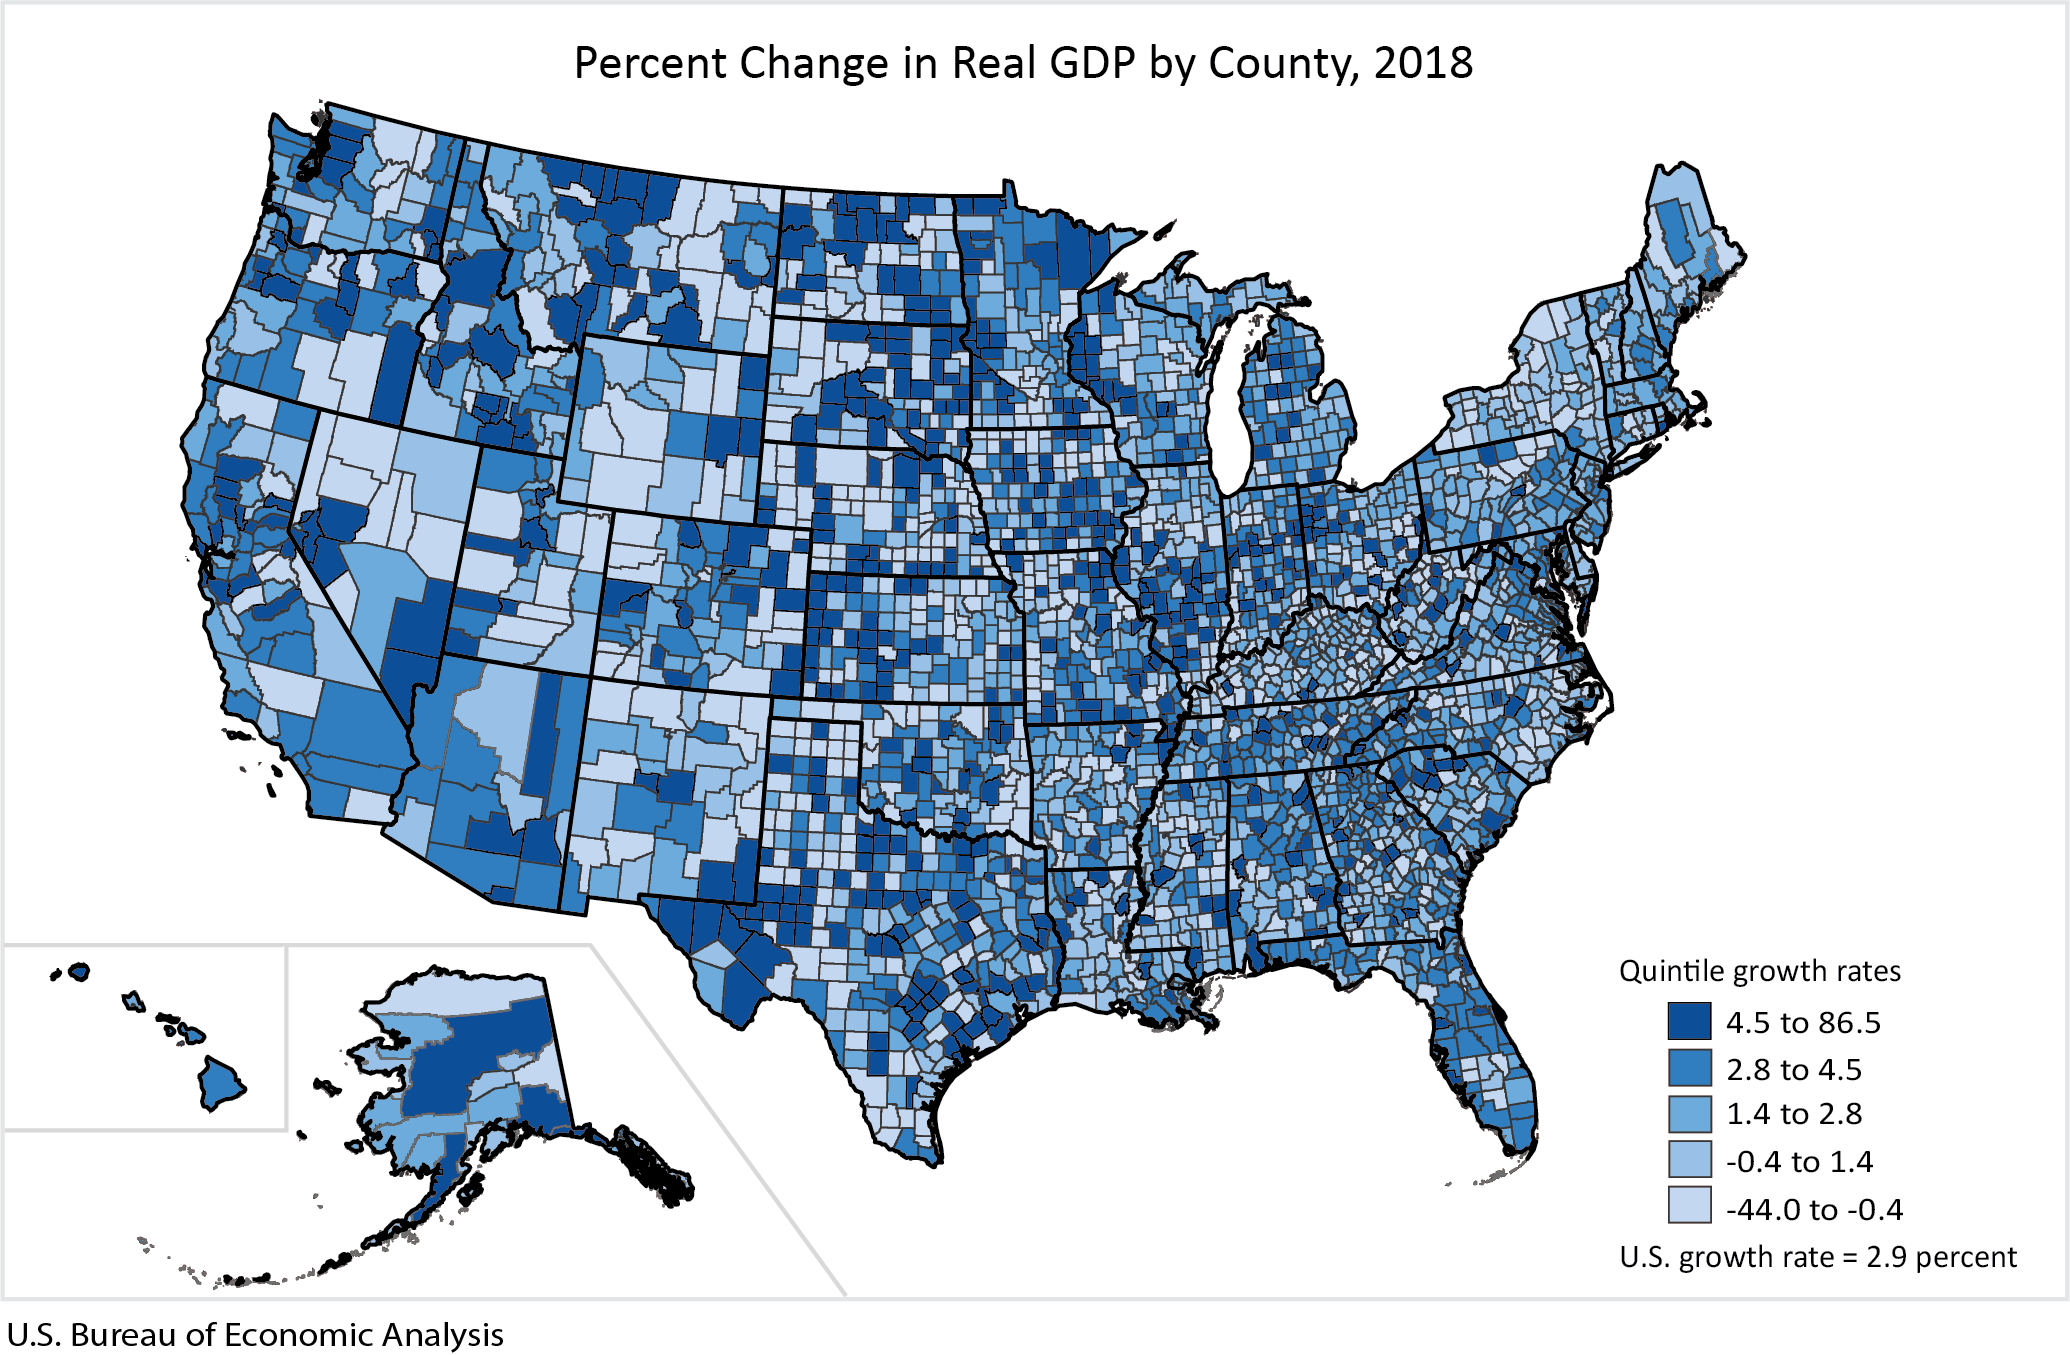
Real gross domestic product (GDP) increased in 2,375 counties, decreased in 717, and was unchanged in 21 in 2018, according to estimates released today by the U.S. Bureau of Economic Analysis (BEA). The percentage change in real GDP ranged from 86.5 percent in Jackson County, WV, to -44.0 percent in Grant County, ND.
In 2020, data for counties and metropolitan areas will be contained in a news release called Gross Domestic Product by County and Metropolitan Area.
The Bureau of Economic Analysis released prototype statistics for gross domestic product (GDP) by county in December 2018. The first official county GDP statistics will be released Dec. 12, 2019, and will include additional detail about industries in each county. The new annual data will cover 2001-2018.
Sample Table Format With Industry Detail
Comparing County GDP to Personal Income