BEA 20-50
Scheduled Date
October 2 08:30:am
Release Title
Gross Domestic Product by State, 2nd Quarter 2020 and Annual Update, 2019

An official website of the United States government
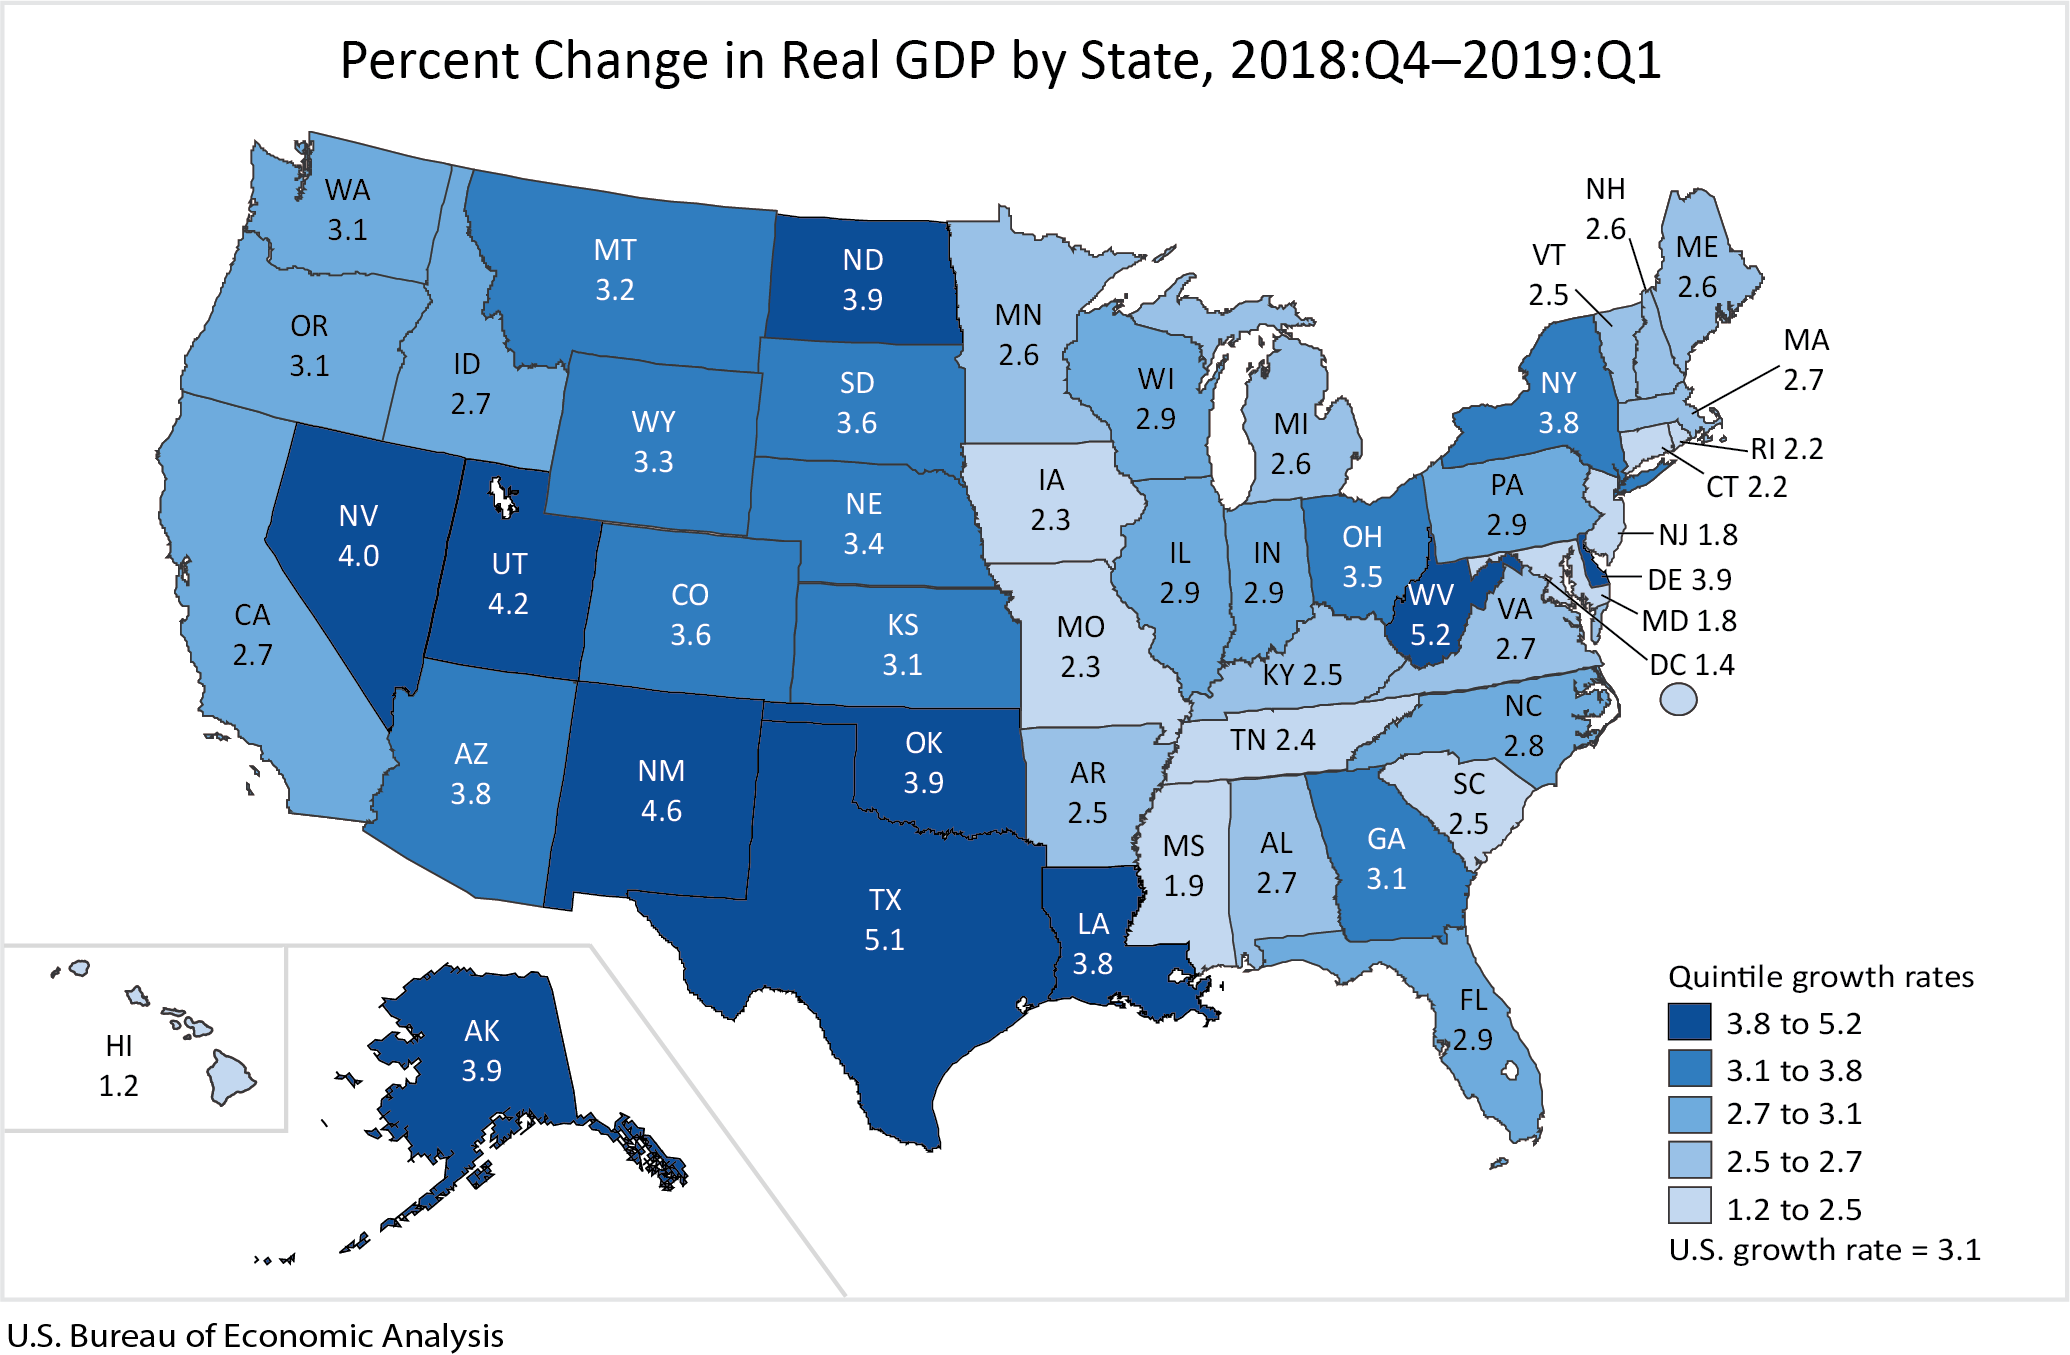
Real gross domestic product (GDP) increased in all 50 states and the District of Columbia in the first quarter of 2019. The percent change in real GDP in the first quarter ranged from 5.2 percent in West Virginia to 1.2 percent in Hawaii.
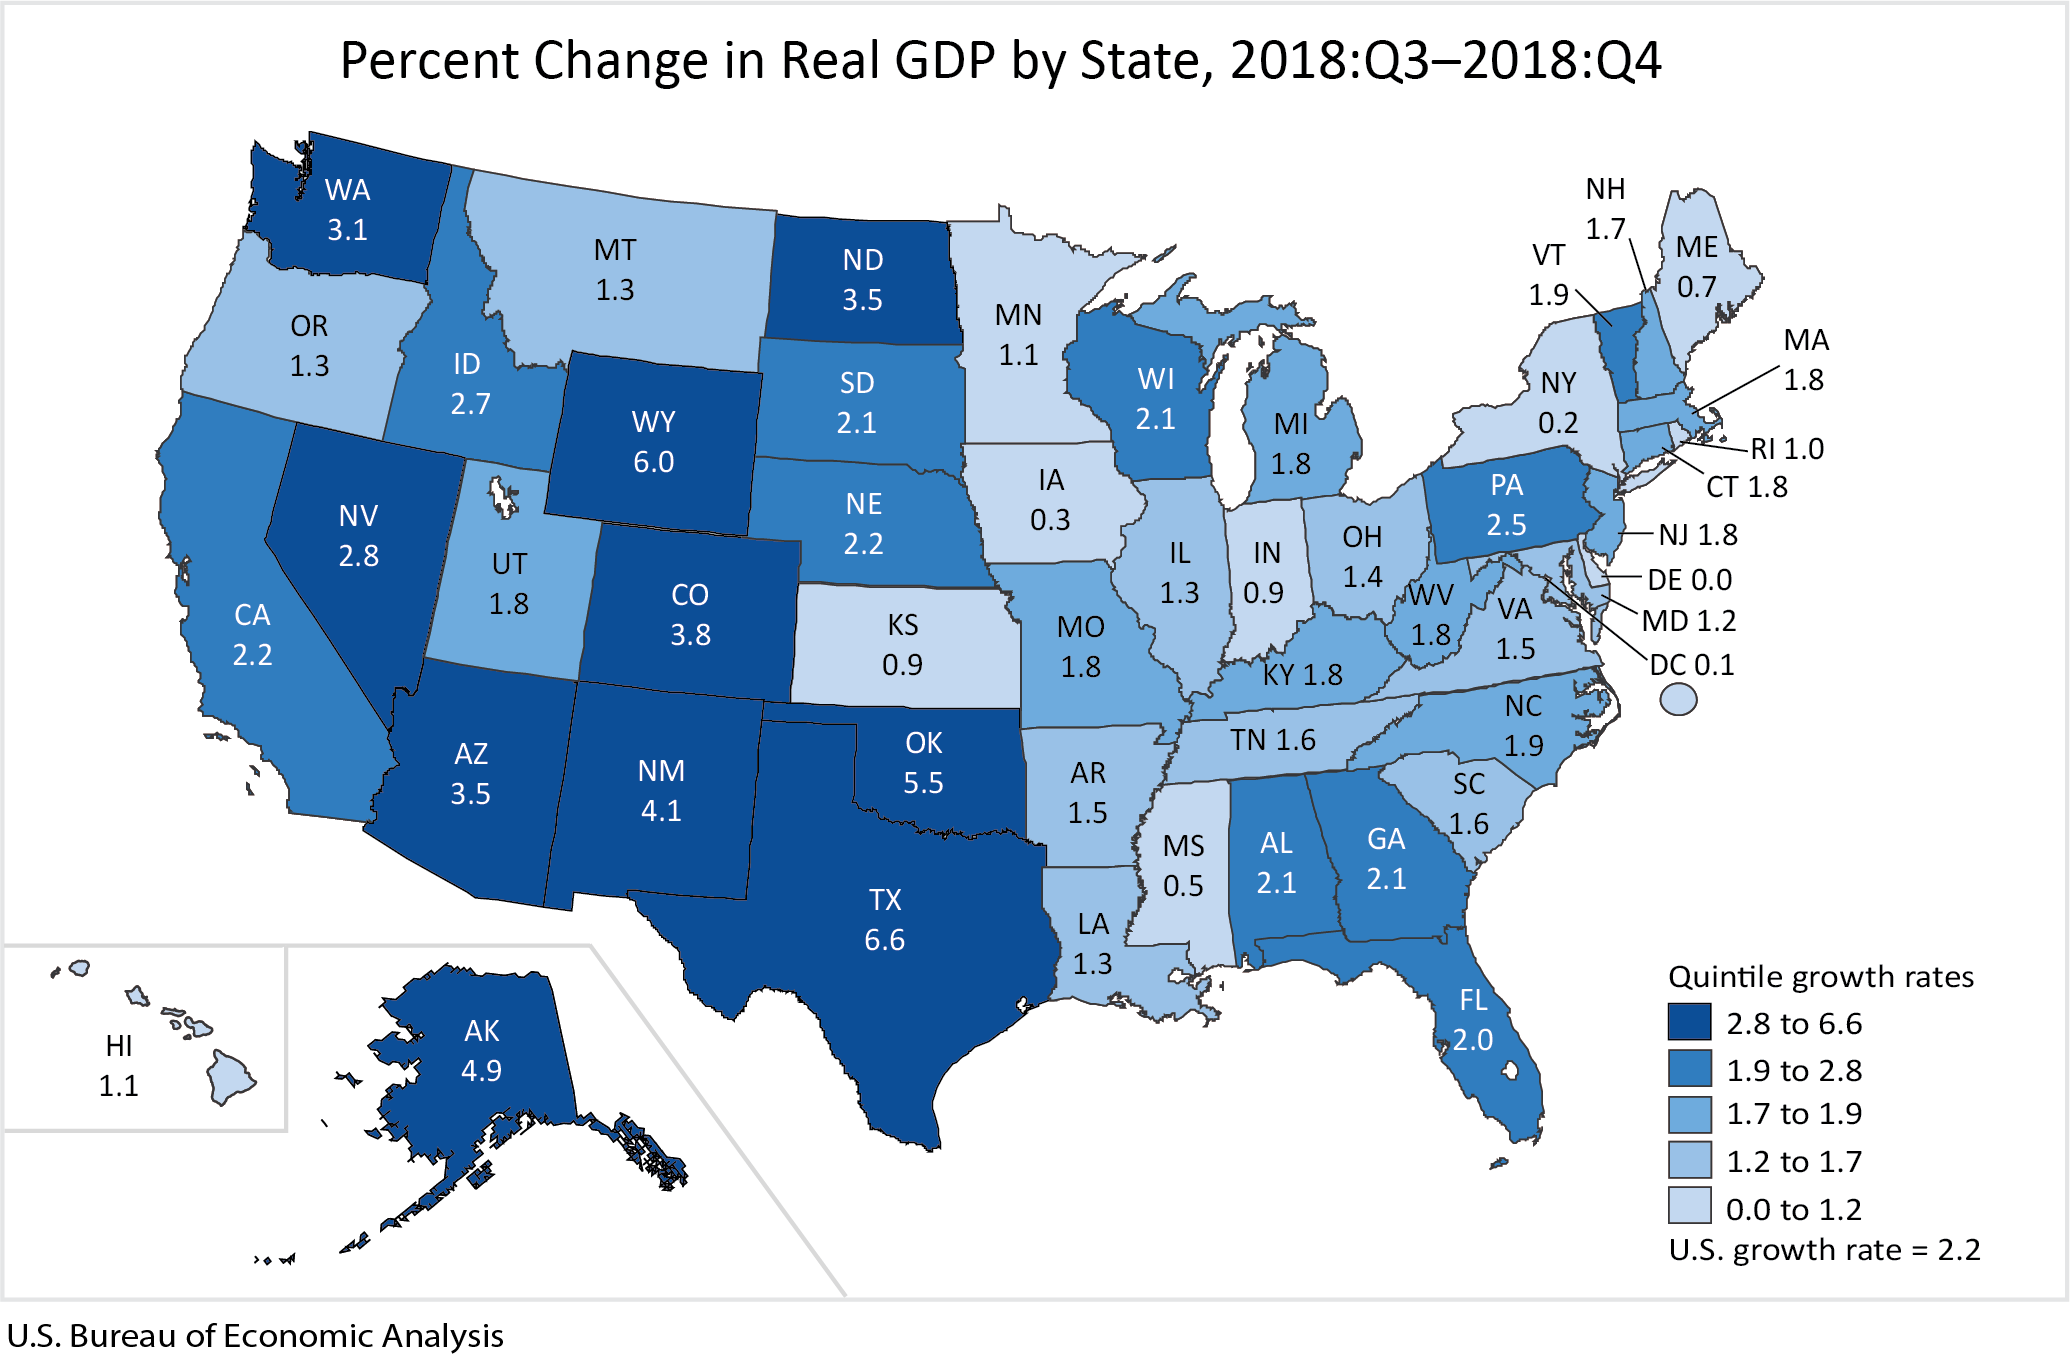
Real gross domestic product (GDP) increased in 49 states and the District of Columbia in the fourth quarter of 2018. The percent change in real GDP in the fourth quarter ranged from 6.6 percent in Texas to 0.0 percent in Delaware.
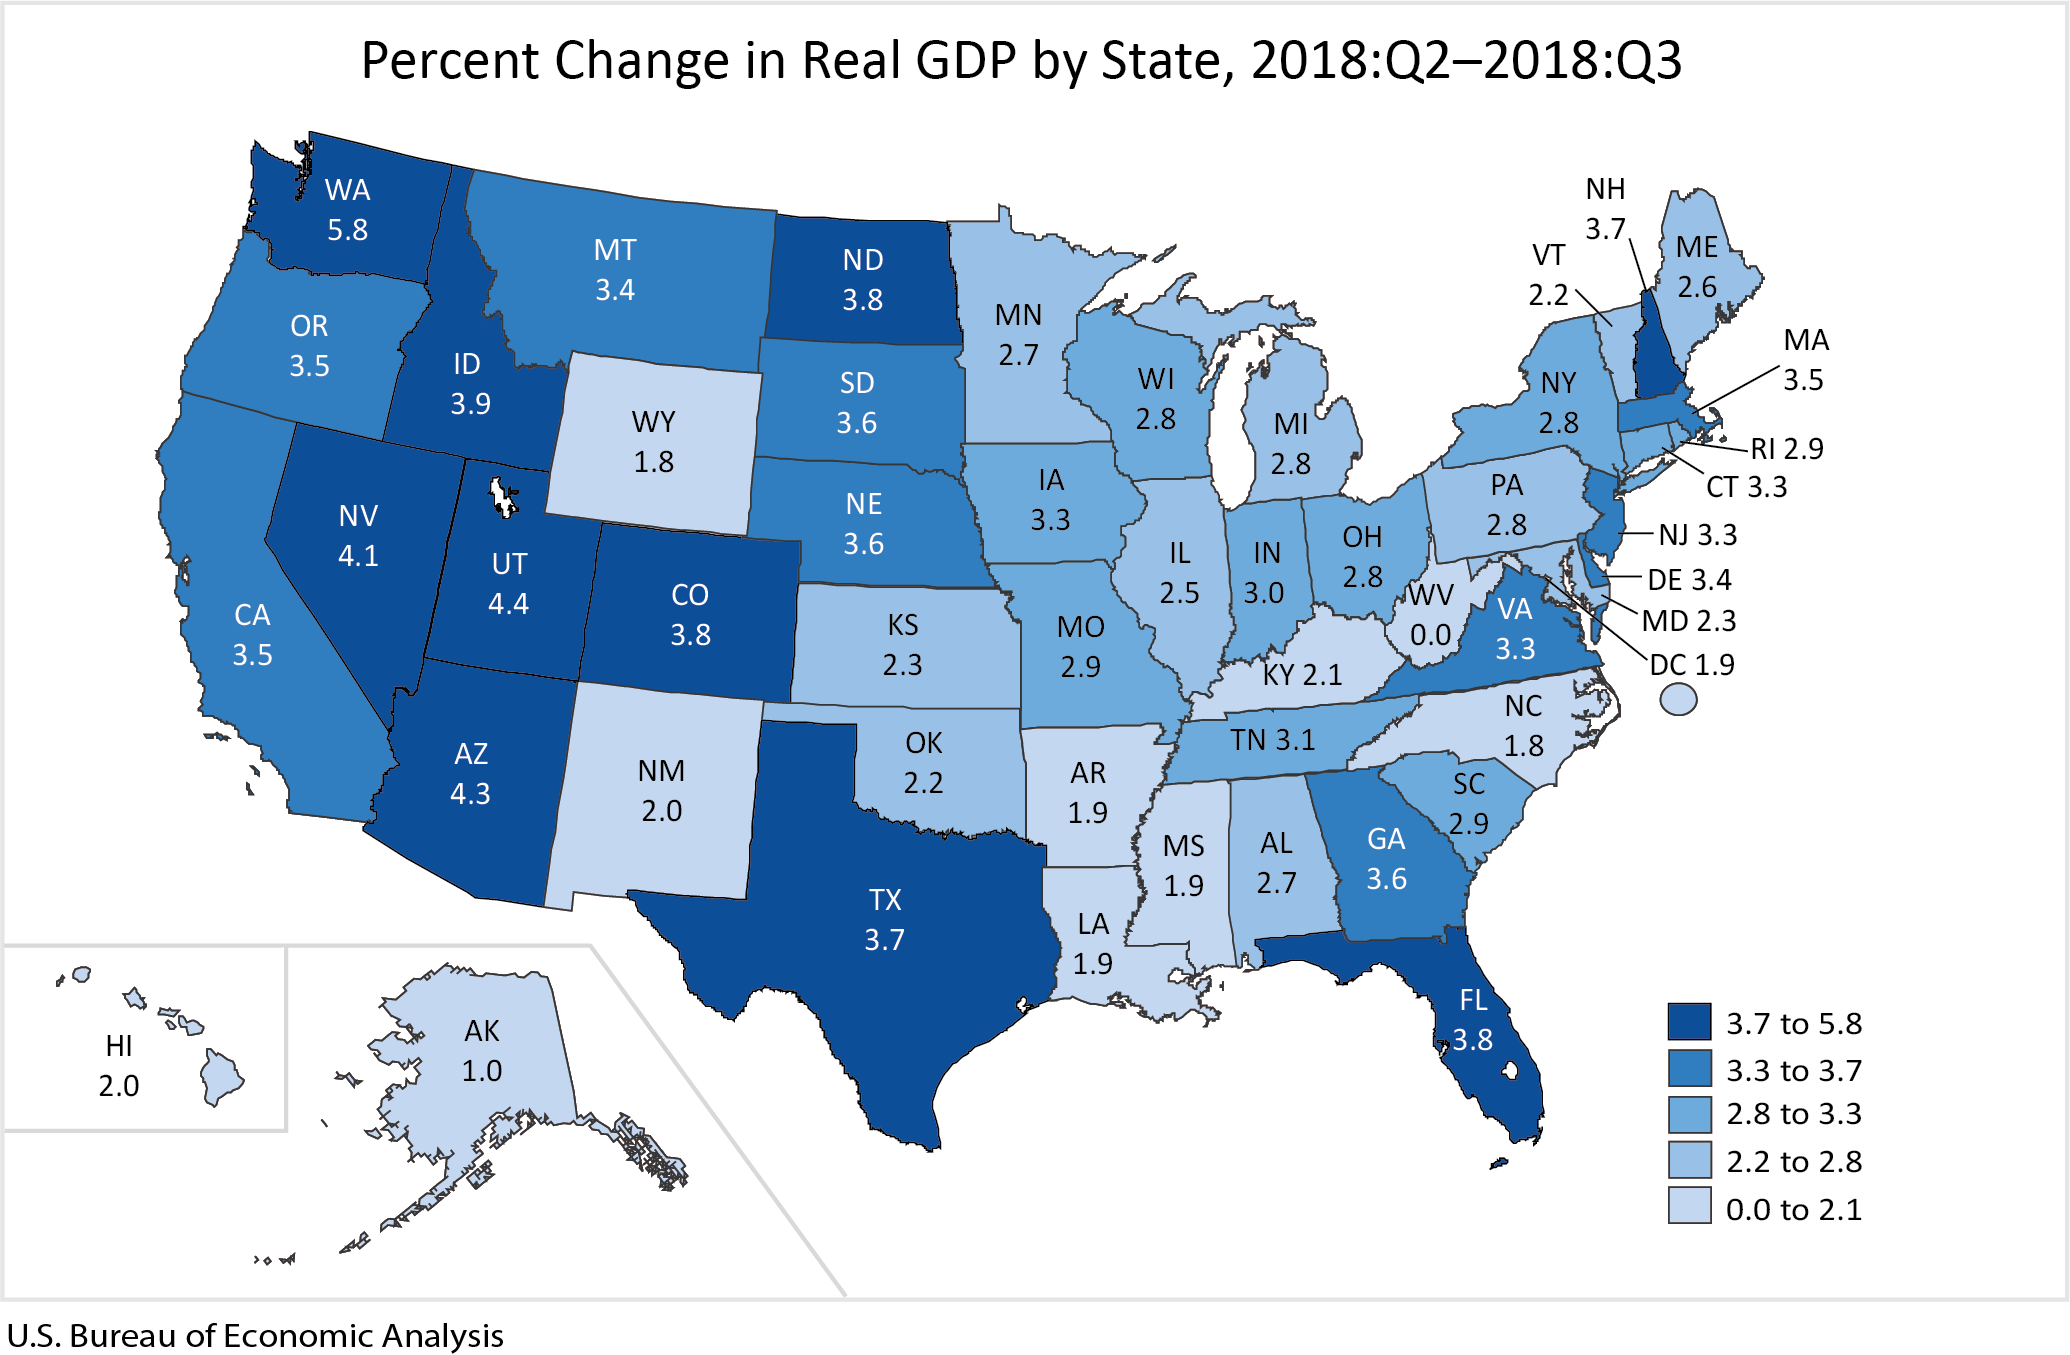
Real gross domestic product (GDP) increased in 49 states and the District of Columbia in the third quarter of 2018. The percent change in real GDP in the third quarter ranged from 5.8 percent in Washington to 0.0 percent in West Virginia.
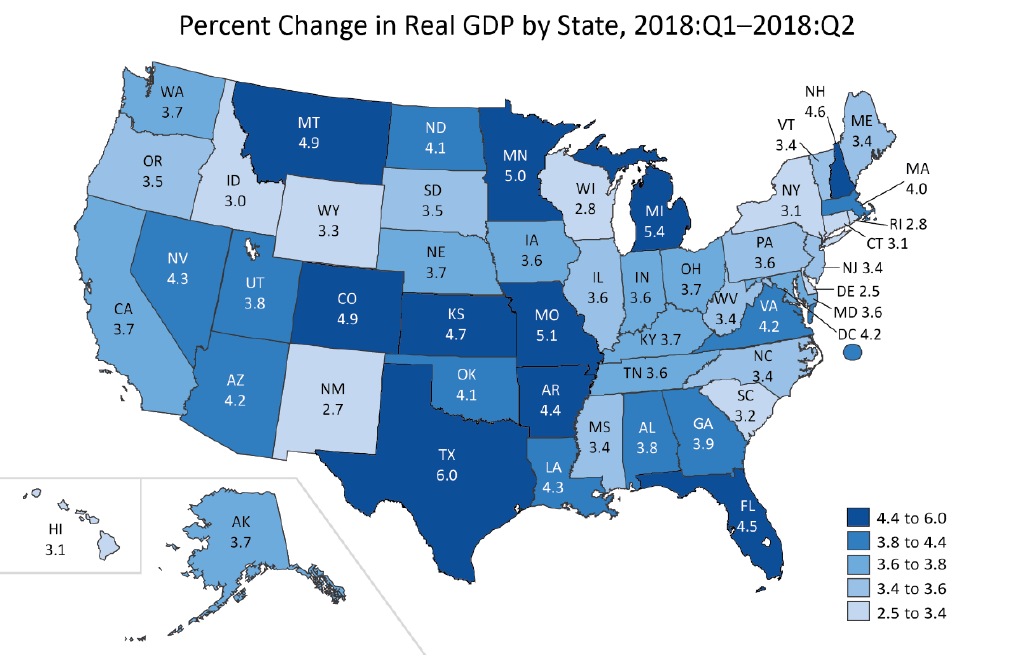
Real gross domestic product (GDP) increased in all 50 states and the District of Columbia in the second quarter of 2018, according to statistics released today by the U.S. Bureau of Economic Analysis. The percent change in real GDP in the second quarter ranged from 6.0 percent in Texas to 2.5 percent in Delaware.