BEA 19-19
Scheduled Date
May 1 08:30:am
Release Title
Gross Domestic Product by State, 4th quarter 2018 and annual 2018 (preliminary)

An official website of the United States government
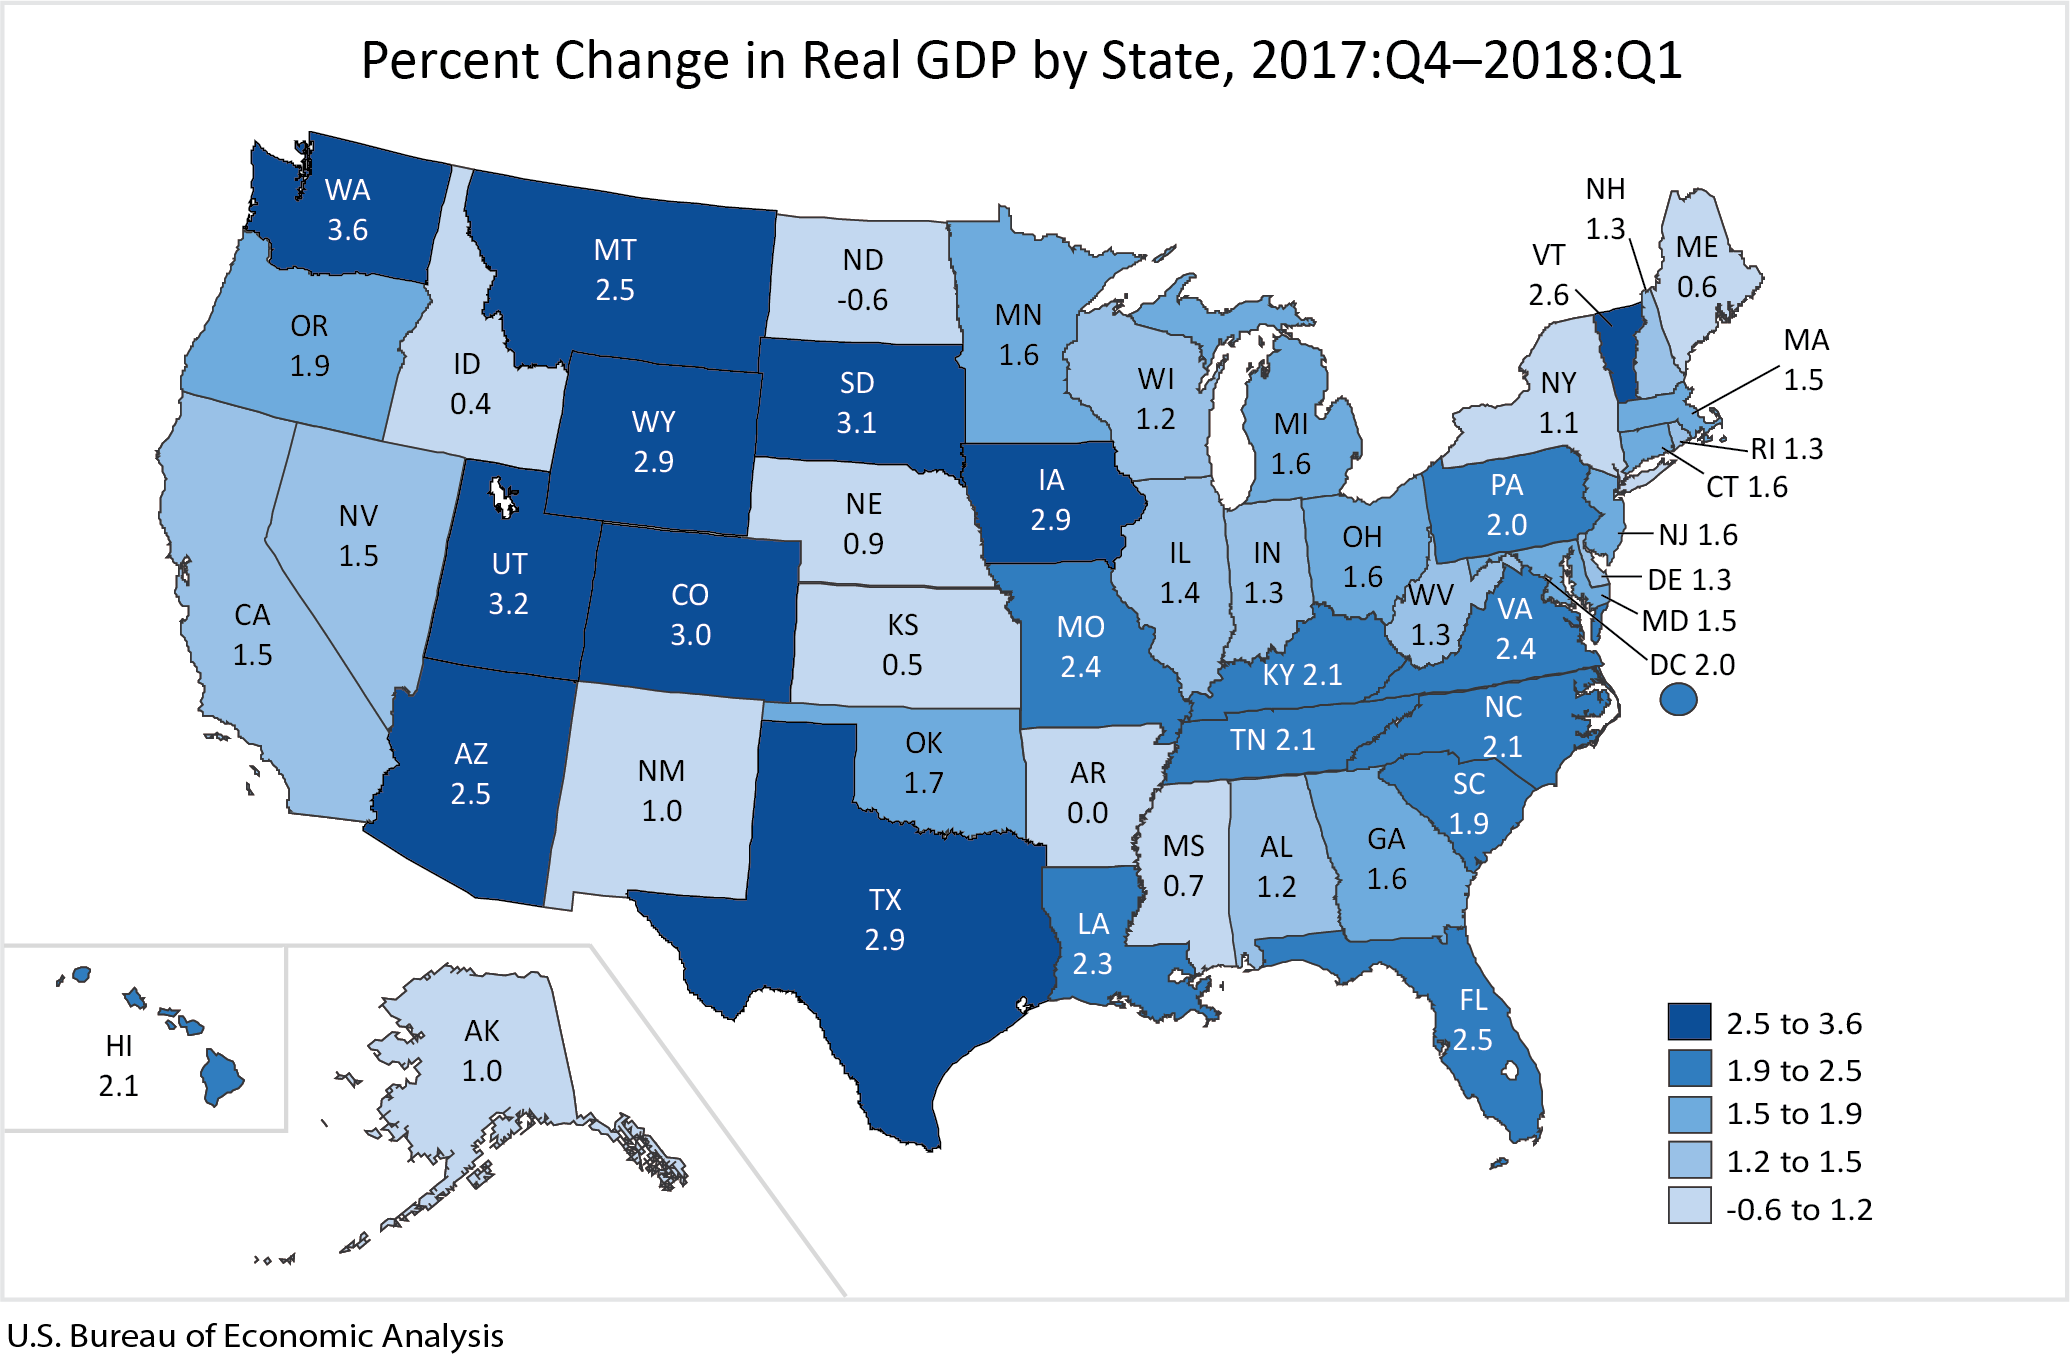
Real gross domestic product (GDP) increased in 48 states and the District of Columbia in the first quarter of 2018, according to statistics released today by the U.S. Bureau of Economic Analysis. The percent change in real GDP in the first quarter ranged from 3.6 percent in Washington to -0.6 percent in North Dakota.
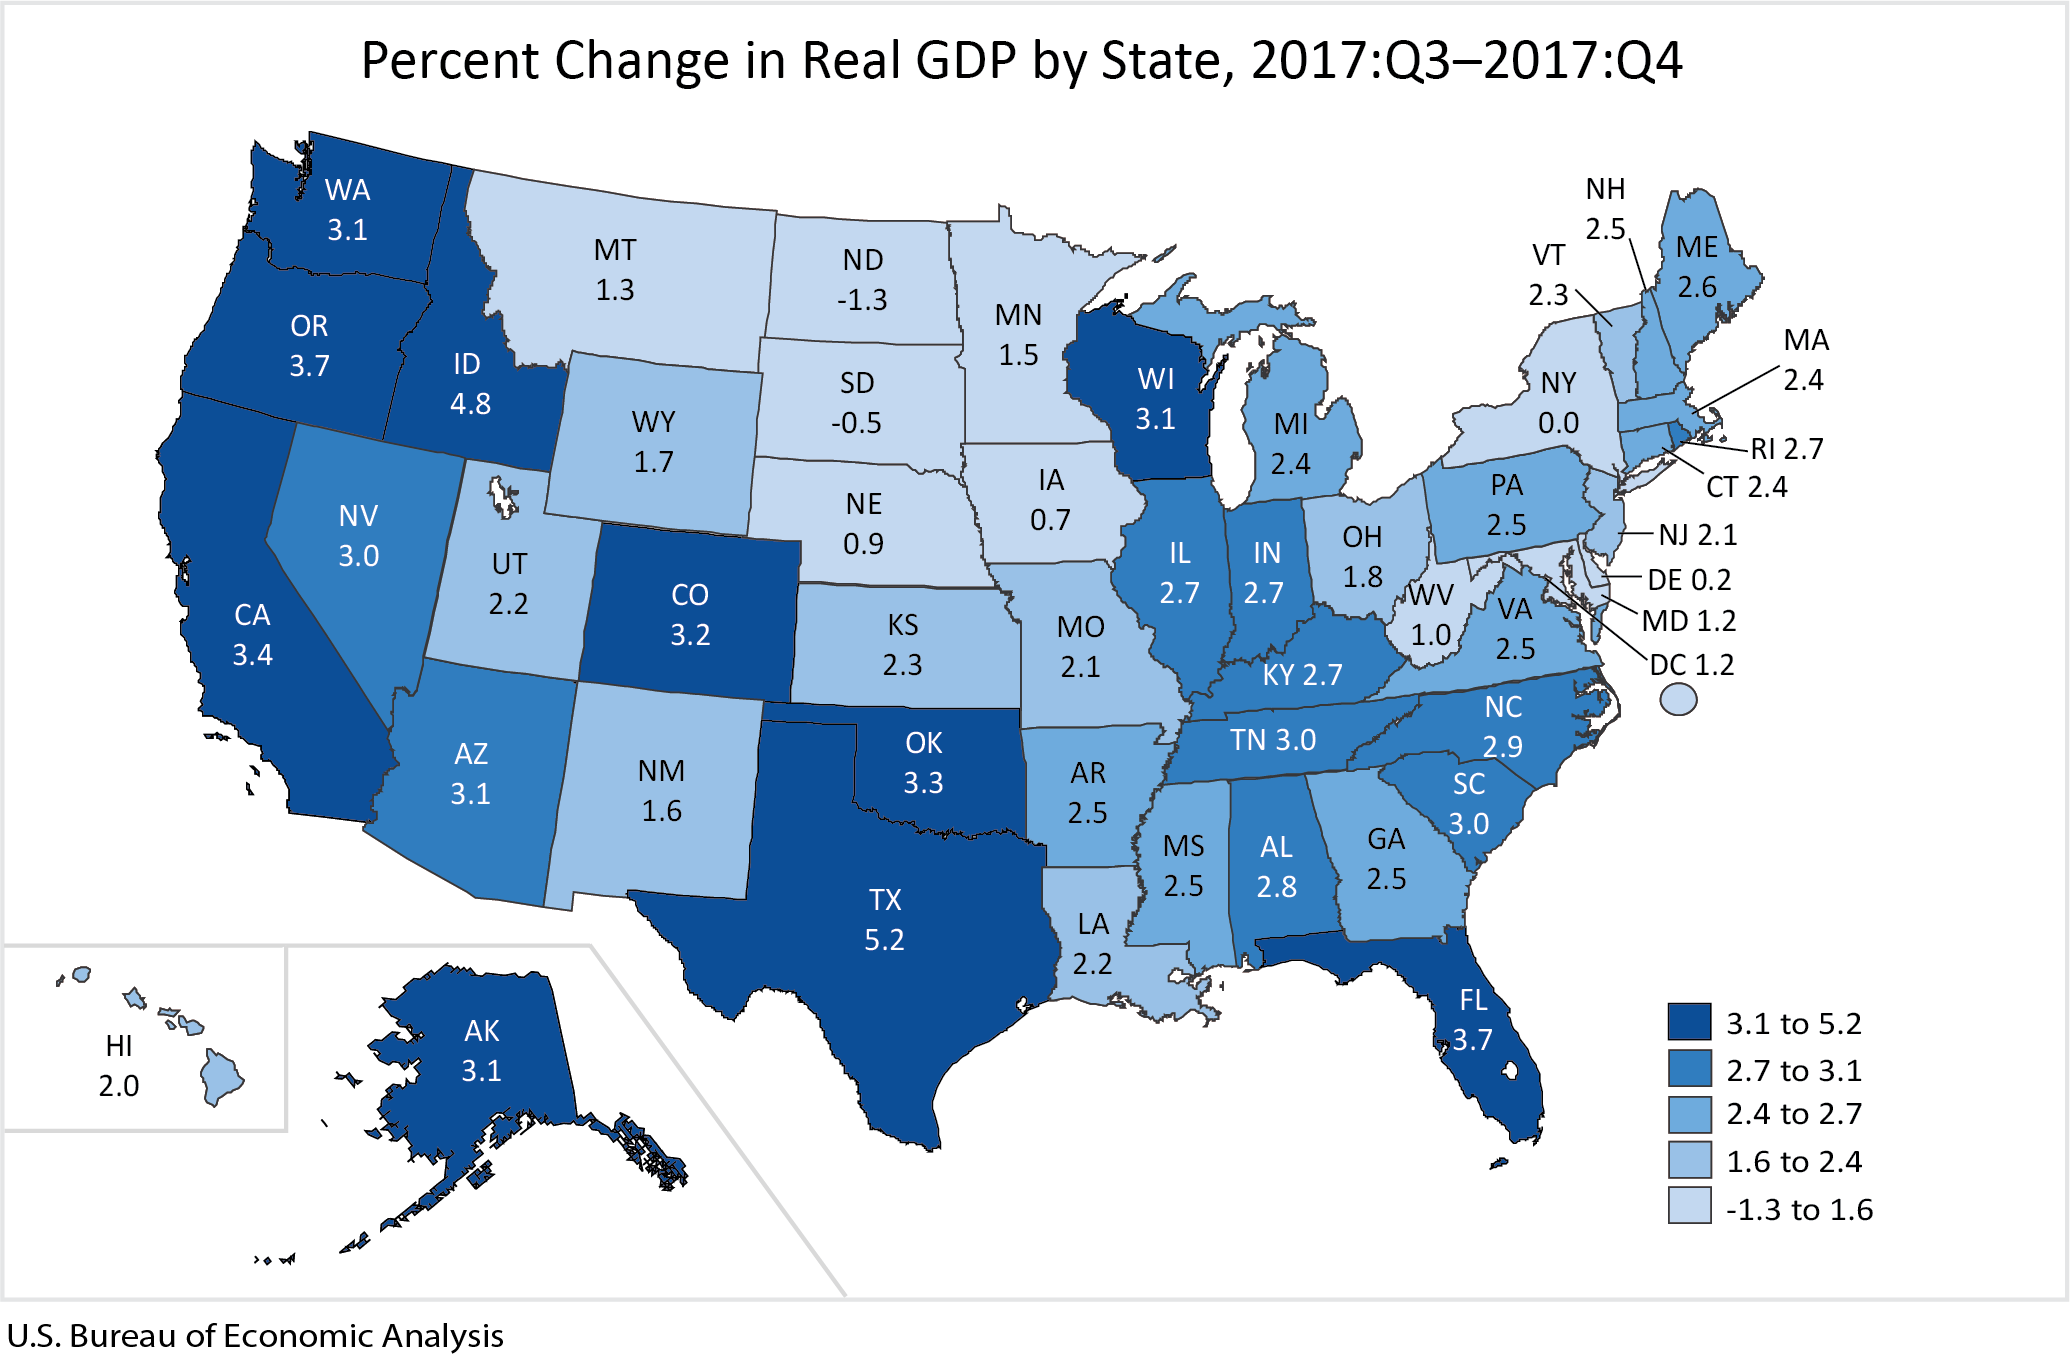
Real gross domestic product (GDP) increased in 47 states and the District of Columbia in the fourth quarter of 2017. The percent change in real GDP ranged from 5.2 percent in Texas to –1.3 percent in North Dakota.
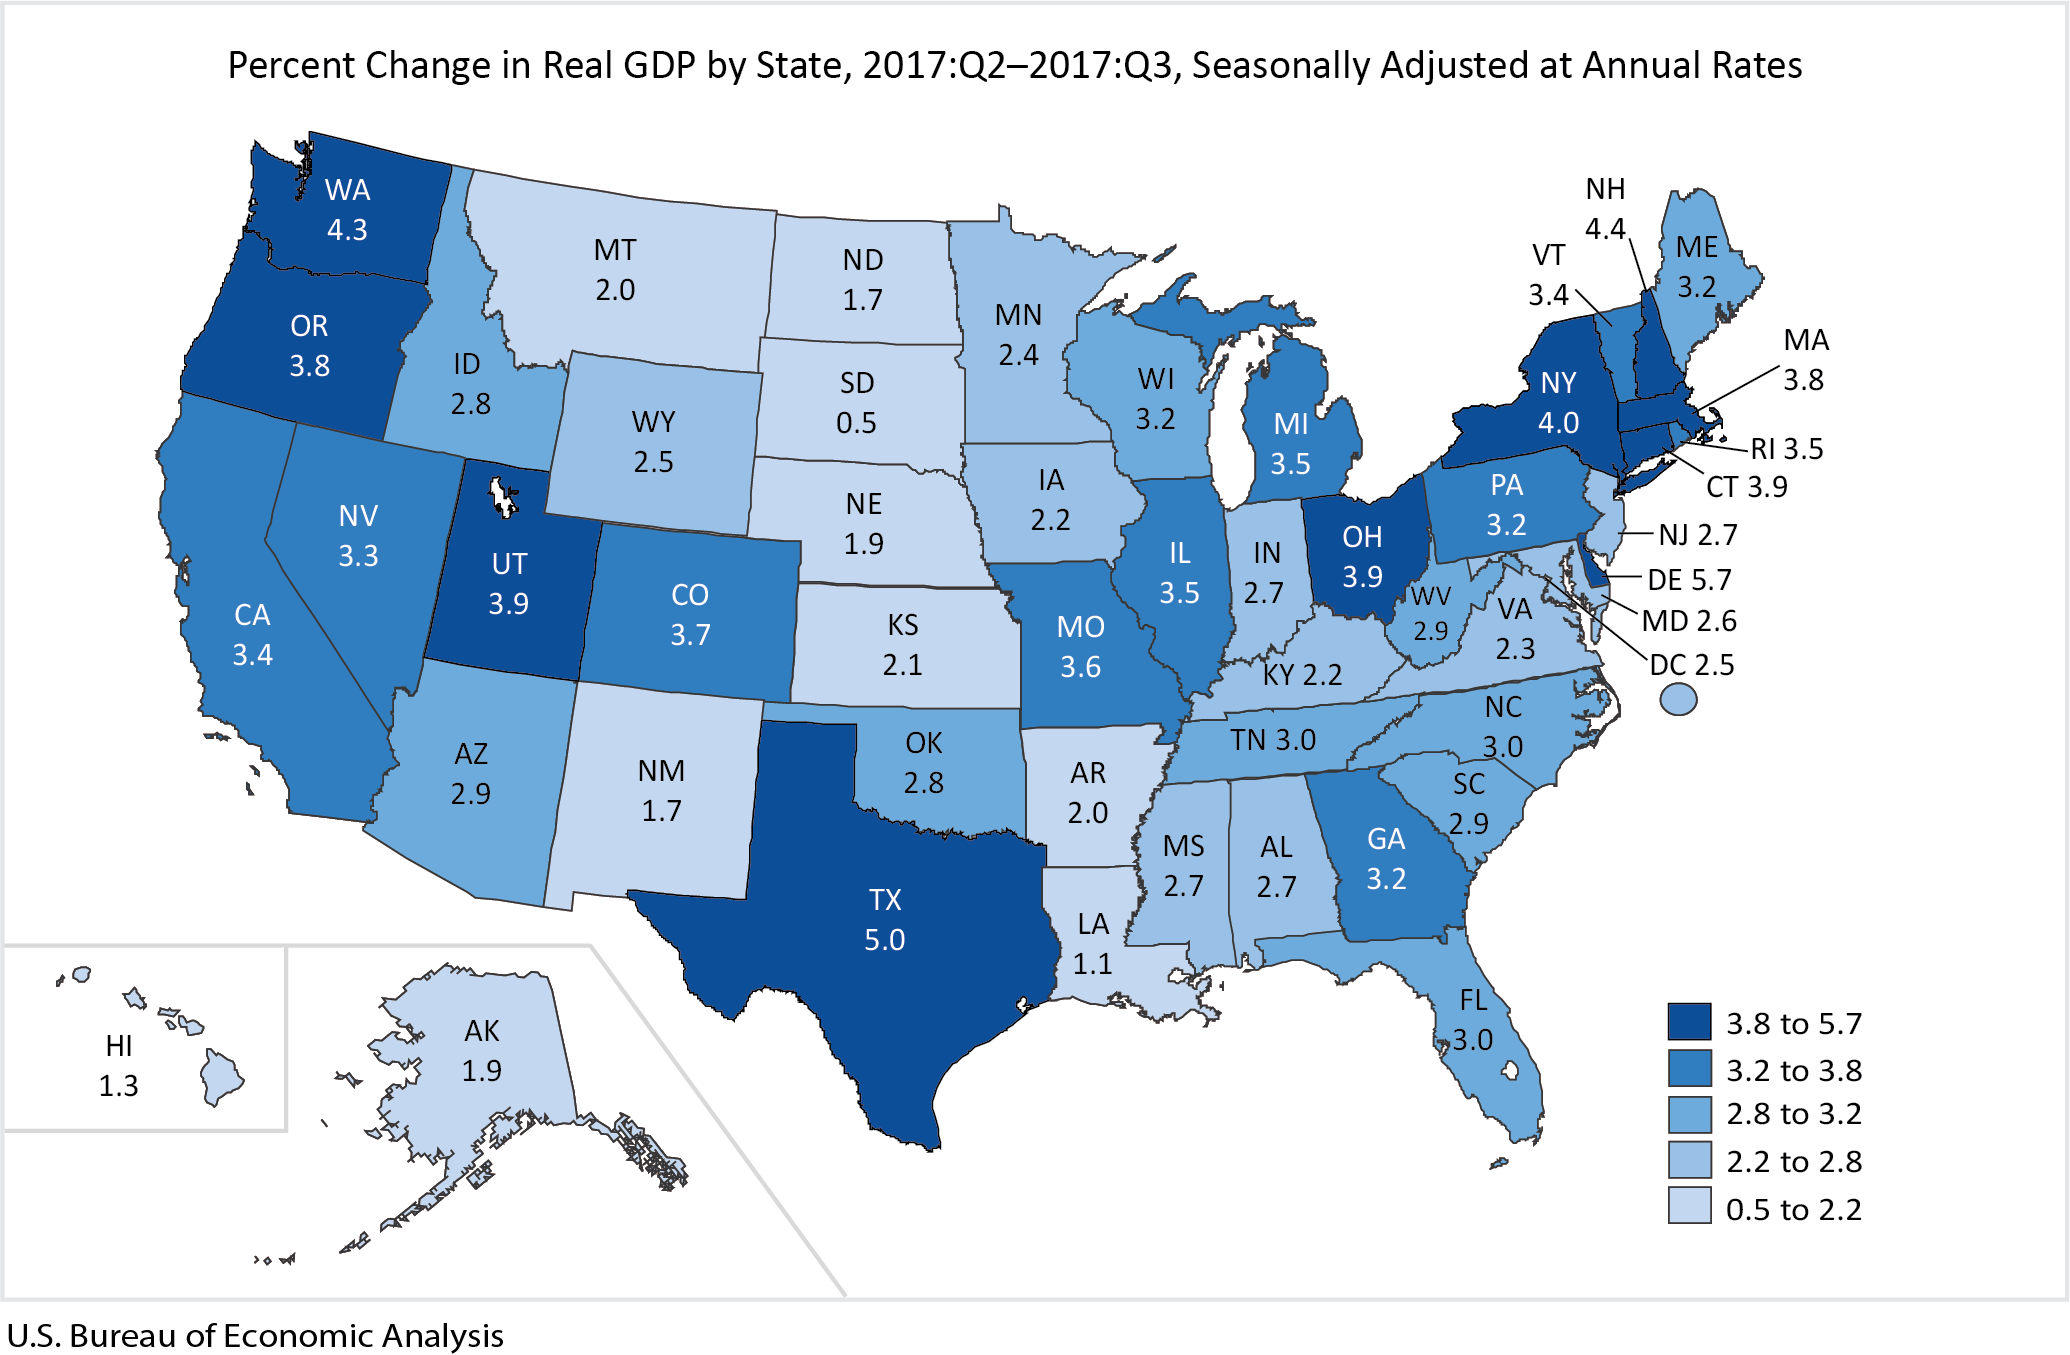
Real gross domestic product (GDP) increased in every state and the District of Columbia in the third quarter of 2017, according to statistics on the geographic breakout of GDP released today by the U.S. Bureau of Economic Analysis. Real GDP by state growth in the third quarter ranged from 5.7 percent in Delaware to 0.5 percent in South Dakota (table 1).
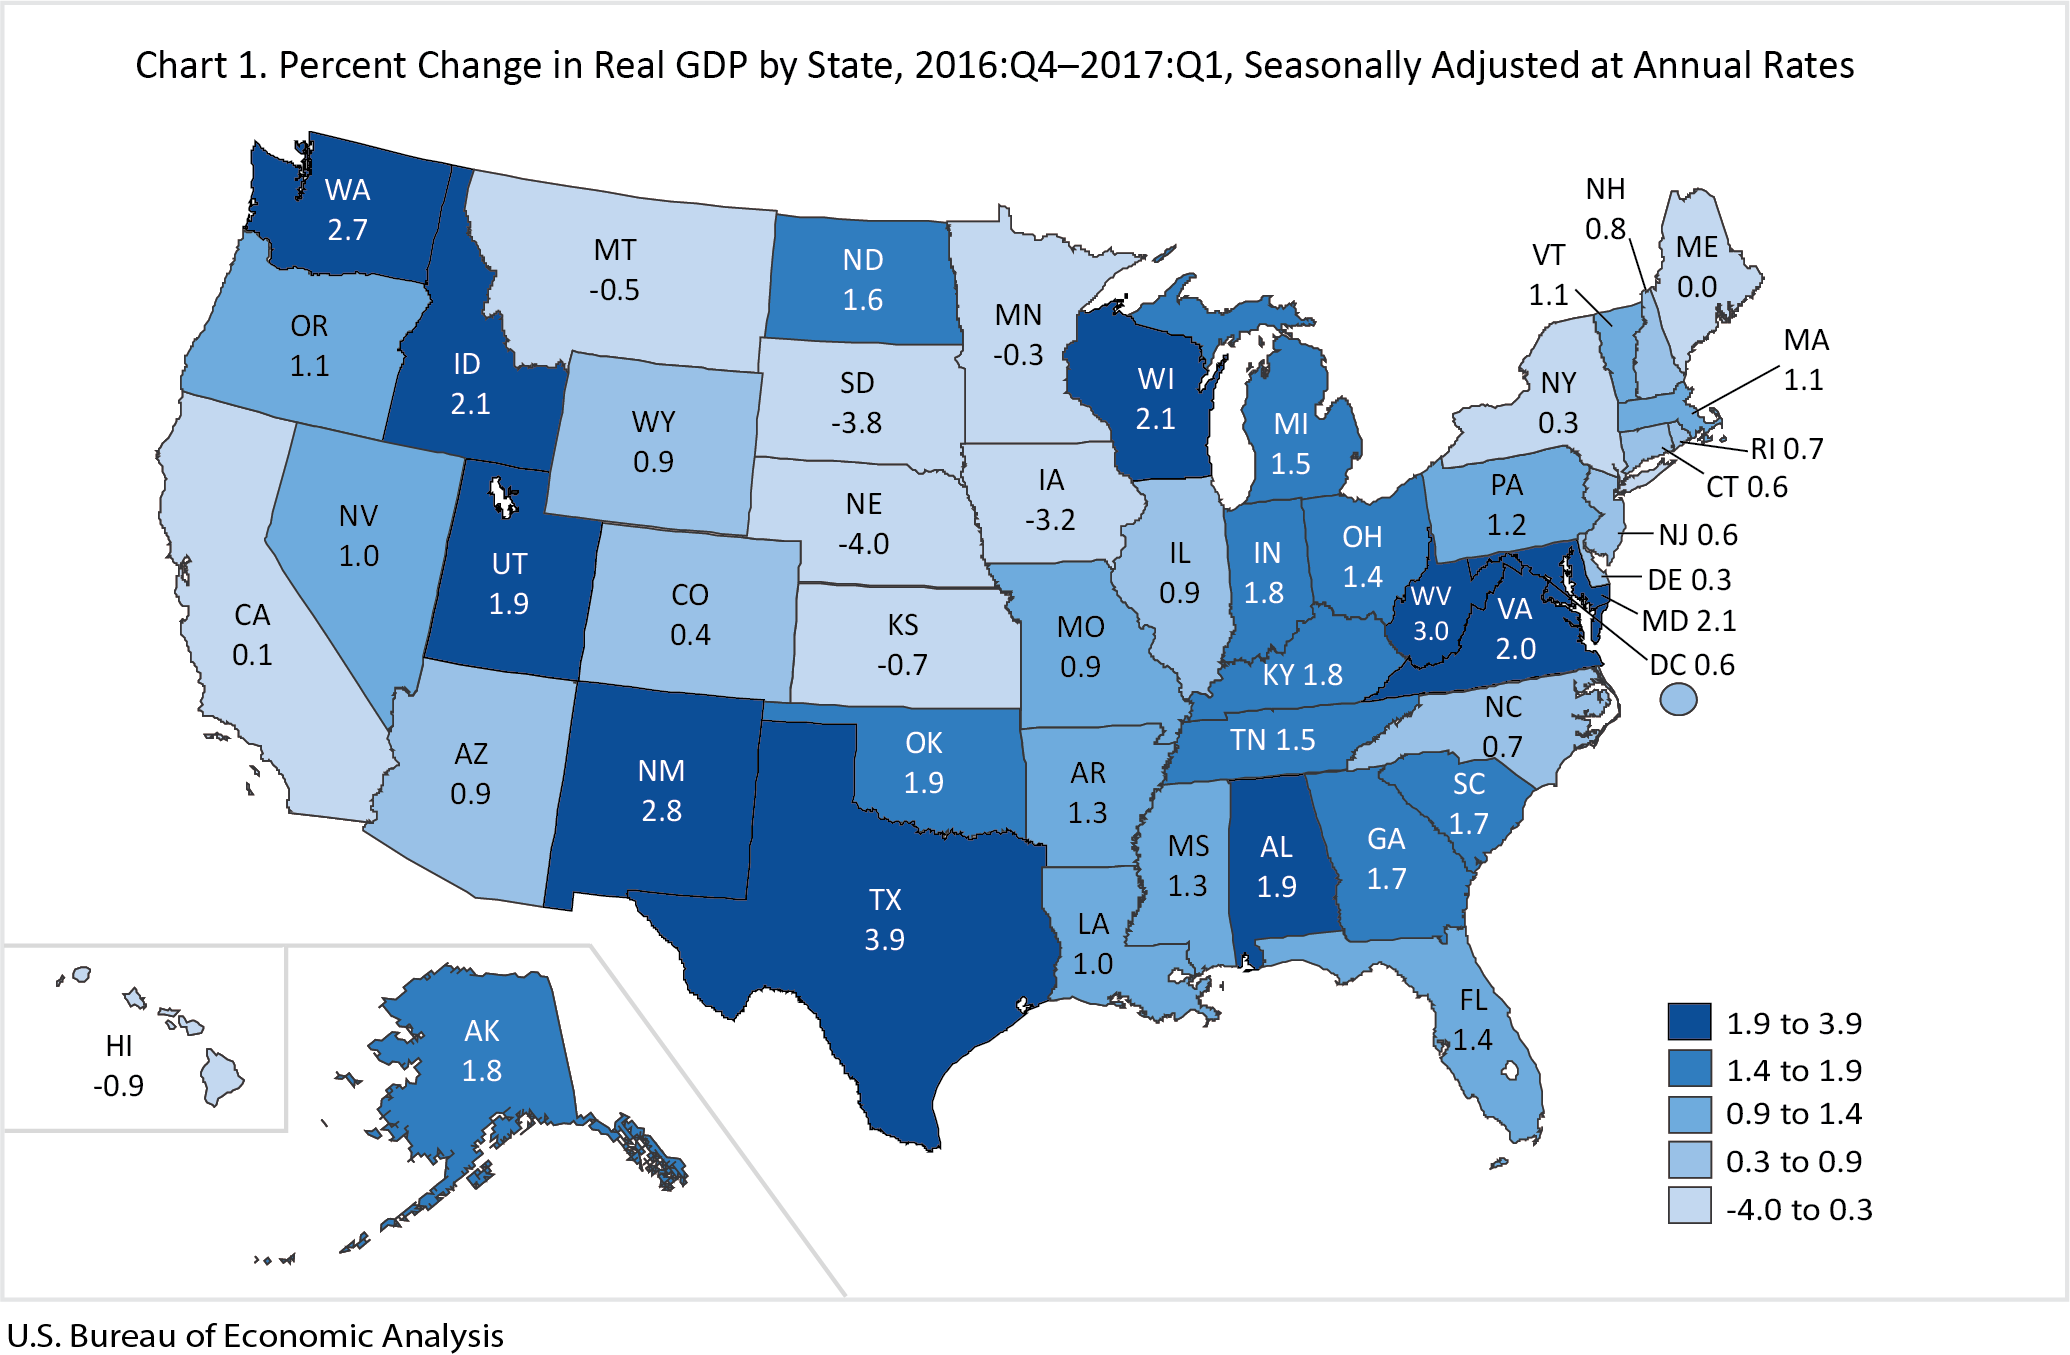
Real gross domestic product (GDP) increased in 43 states and the District of Columbia in the first quarter of 2017. Real GDP by state growth in the first quarter ranged from 3.9 percent in Texas to -4.0 percent in Nebraska.
Next release: November 21, 2017