
News Release
Gross Domestic Product by State, 2nd quarter 2017
Mining Led Growth Across Southwestern States in the Second Quarter
Real gross domestic product (GDP) increased in 48 states and the District of Columbia in the second quarter of 2017, according to statistics on the geographic breakout of GDP released today by the U.S. Bureau of Economic Analysis. Real GDP by state growth in the second quarter ranged from 8.3 percent in North Dakota to -0.7 percent in Iowa (table 1).
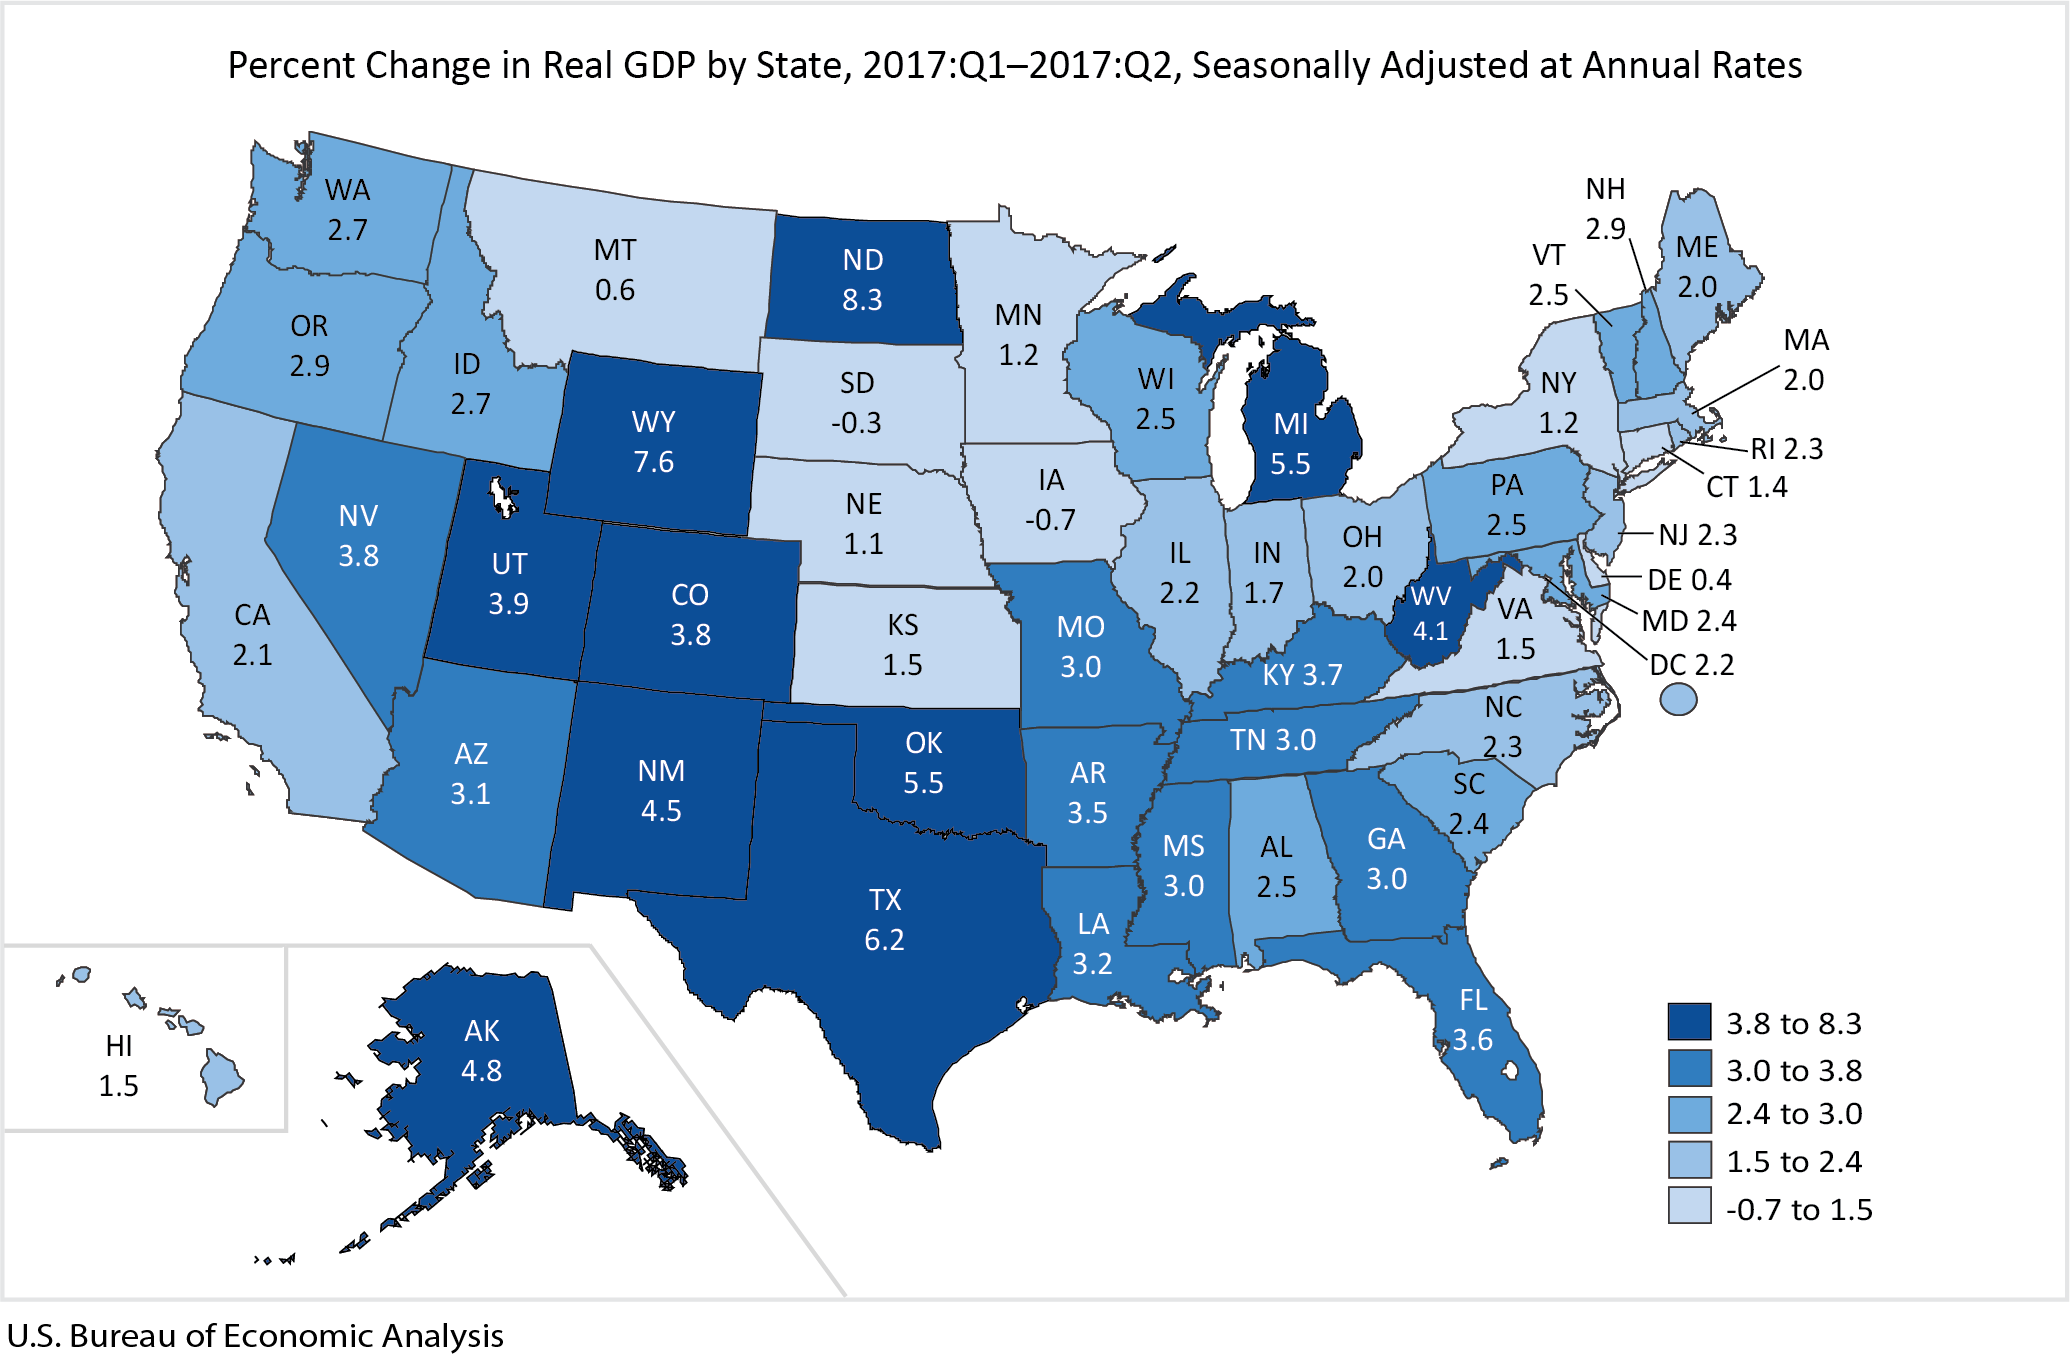
Nationally, mining increased 28.6 percent and was the leading contributor to growth for the nation and in the three fastest-growing states of North Dakota, Wyoming and Texas in the second quarter (table 2). Mining contributed to growth in 49 states led by increases in oil and natural gas production.
By contrast, agriculture, forestry, fishing, and hunting decreased 10.6 percent and subtracted from growth in 25 states, including every state in the Plains region, which experienced high levels of crop production in 2016. This industry was the leading contributor to the decreases in real GDP in Iowa and South Dakota–the only two states to decrease in the second quarter.
Other Highlights
In addition to mining; professional, scientific, and technical services; health care and social assistance; retail trade; and information services were the leading contributors to U.S. economic growth in the second quarter.
- Professional, scientific, and technical services increased 5.1 percent nationally–the seventeenth consecutive quarter of growth. This industry contributed to growth in every state and the District of Columbia. It includes activities such as legal, accounting, engineering, and computer services.
- Health care and social assistance increased 4.7 percent nationally. This industry contributed to growth in 49 states and the District of Columbia.
- Retail trade increased 5.6 percent, rebounding from a decrease in the first quarter, and contributed to growth in 49 states and the District of Columbia.
- Information services increased 7.0 percent in the second quarter and contributed to growth in 46 states and the District of Columbia.
Update of Gross Domestic Product by State
In addition to the new 2017:Q2 statistics presented in this news release, BEA also revised quarterly GDP by state statistics for 2014:Q1 to 2017:Q1 and annual statistics for 2014 to 2016. Updates were made to incorporate source data that are more complete, including the September 2017 annual update to the State Personal Income Accounts, and to align the states with revised national estimates that were released with the November 2nd annual update to the Industry Economic Accounts and the July 2017 annual update to the National Income and Product Accounts.
Next release — January 24, 2018 at 8:30 A.M. EST for: Gross Domestic Product by State: Third Quarter of 2017