BEA 26-07
Scheduled Date
January 29 08:30:am
Release Title
U.S. International Trade in Goods and Services, November 2025

An official website of the United States government
|
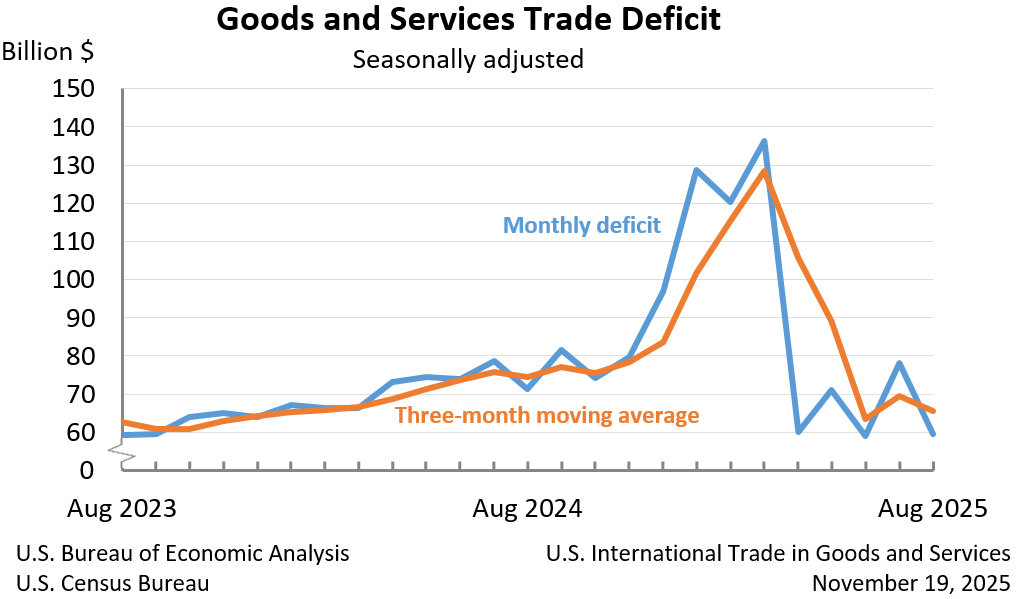
August 2025
|
-$59.6 B
|
|
July 2025
|
-$78.2 B
|
The U.S. goods and services trade deficit decreased in August 2025 according to the U.S. Bureau of Economic Analysis and the U.S. Census Bureau. The deficit decreased from $78.2 billion in July (revised) to $59.6 billion in August, as exports increased and imports decreased. The goods deficit decreased $18.1 billion in August to $85.6 billion. The services surplus increased $0.5 billion in August to $26.1 billion.