BEA 26-31
Scheduled Date
September 3 08:30:am
Release Title
U.S. International Trade in Goods and Services, July 2026

An official website of the United States government
|
July 2025
|
-$78.3 B
|
|
June 2025
|
-$59.1 B
|
The U.S. goods and services trade deficit increased in July 2025 according to the U.S. Bureau of Economic Analysis and the U.S. Census Bureau. The deficit increased from $59.1 billion in June (revised) to $78.3 billion in July, as imports increased more than exports. The goods deficit increased $18.2 billion in July to $103.9 billion. The services surplus decreased $1.1 billion in July to $25.6 billion.
|
June 2025
|
-$60.2 B
|
|
May 2025
|
-$71.7 B
|
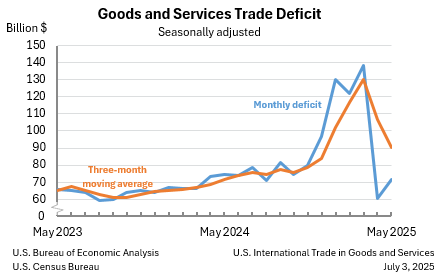
The U.S. goods and services trade deficit decreased in June 2025 according to the U.S. Bureau of Economic Analysis and the U.S. Census Bureau. The deficit decreased from $71.7 billion in May (revised) to $60.2 billion in June, as exports decreased less than imports. The goods deficit decreased $11.4 billion in June to $85.9 billion. The services surplus increased $0.1 billion in June to $25.7 billion.
|
May 2025
|
-$71.5 B
|
|
April 2025
|
-$60.3 B
|
The U.S. goods and services trade deficit increased in May 2025 according to the U.S. Bureau of Economic Analysis and the U.S. Census Bureau. The deficit increased from $60.3 billion in April (revised) to $71.5 billion in May, as exports decreased more than imports. The goods deficit increased $11.2 billion in May to $97.5 billion. The services surplus decreased $0.1 billion in May to $26.0 billion.
|
April 2025
|
-$61.6 B
|
|
March 2025
|
-$138.3 B
|
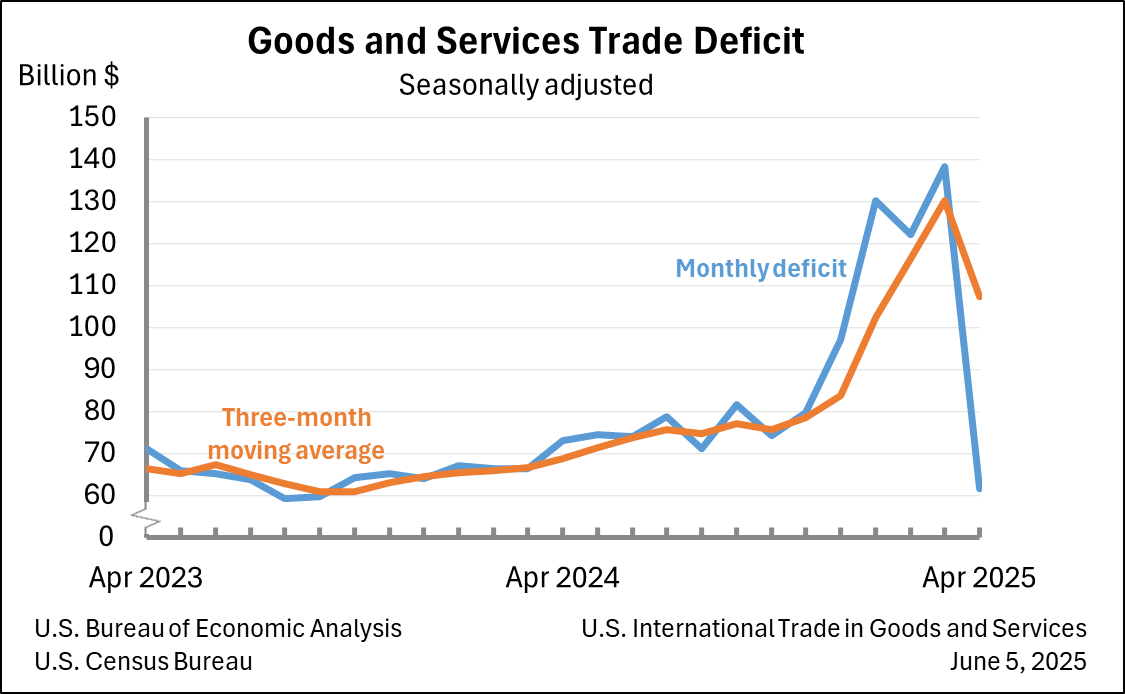
The U.S. monthly international trade deficit decreased in April 2025 according to the U.S. Bureau of Economic Analysis and the U.S. Census Bureau. The deficit decreased from $138.3 billion in March (revised) to $61.6 billion in April, as exports increased and imports decreased. The goods deficit decreased $75.2 billion in April to $87.4 billion. The services surplus increased $1.5 billion in April to $25.8 billion.
The U.S. monthly international trade deficit decreased in April 2025 according to the U.S. Bureau of Economic Analysis and the U.S. Census Bureau. The deficit decreased from $138.3 billion in March (revised) to $61.6 billion in April, as exports increased and imports decreased. The goods deficit decreased $75.2 billion in April to $87.4 billion. The services surplus increased $1.5 billion in April to $25.8 billion.