
News Release
U.S. International Trade in Goods and Services, March 2025
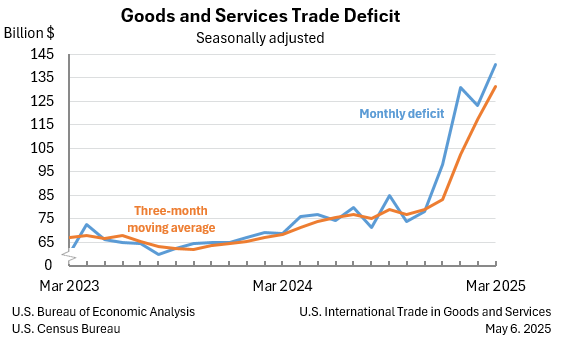
The U.S. Census Bureau and the U.S. Bureau of Economic Analysis announced today that the goods and services deficit was $140.5 billion in March, up $17.3 billion from $123.2 billion in February, revised.
| Deficit: | $140.5 Billion | +14.0%° |
| Exports: | $278.5 Billion | +0.2%° |
| Imports: | $419.0 Billion | +4.4%° |
|
Next release: Thursday, June 5, 2025 (°) Statistical significance is not applicable or not measurable. Data adjusted for seasonality but not price changes Source: U.S. Census Bureau, U.S. Bureau of Economic Analysis; U.S. International Trade in Goods and Services, May 6, 2025 |
||
Exports, Imports, and Balance (exhibit 1)
March exports were $278.5 billion, $0.5 billion more than February exports. March imports were $419.0 billion, $17.8 billion more than February imports.
The March increase in the goods and services deficit reflected an increase in the goods deficit of $16.5 billion to $163.5 billion and a decrease in the services surplus of $0.8 billion to $23.0 billion.
Year-to-date, the goods and services deficit increased $189.6 billion, or 92.6 percent, from the same period in 2024. Exports increased $41.1 billion or 5.2 percent. Imports increased $230.7 billion or 23.3 percent.
Three-Month Moving Averages (exhibit 2)
The average goods and services deficit increased $14.1 billion to $131.4 billion for the three months ending in March.
- Average exports increased $4.0 billion to $275.7 billion in March.
- Average imports increased $18.1 billion to $407.1 billion in March.
Year-over-year, the average goods and services deficit increased $63.2 billion from the three months ending in March 2024.
- Average exports increased $13.7 billion from March 2024.
- Average imports increased $76.9 billion from March 2024.
Exports (exhibits 3, 6, and 7)
Exports of goods increased $1.3 billion to $183.2 billion in March.
Exports of goods on a Census basis increased $2.5 billion.
- Industrial supplies and materials increased $2.2 billion.
- Natural gas increased $0.8 billion.
- Nonmonetary gold increased $0.7 billion.
- Automotive vehicles, parts, and engines increased $1.2 billion.
- Passenger cars increased $0.9 billion.
- Capital goods decreased $1.5 billion.
- Civilian aircraft decreased $1.8 billion.
- Computer accessories increased $0.7 billion.
Net balance of payments adjustments decreased $1.2 billion.
When incorporating the statistics in this release into BEA’s National Economic Accounts, including Gross Domestic Product, or GDP, BEA replaces exports and imports of nonmonetary gold with an adjustment calculated as the difference between domestic production and industrial use of gold. For additional information, see “How are exports and imports of gold recorded in BEA’s International Economic Accounts?” and “How are exports and imports of nonmonetary gold treated in BEA’s National Economic Accounts?”.
Exports of services decreased $0.9 billion to $95.2 billion in March.
- Travel decreased $1.3 billion.
- Transport increased $0.3 billion.
- Financial services increased $0.2 billion.
Imports (exhibits 4, 6, and 8)
Imports of goods increased $17.8 billion to $346.8 billion in March.
Imports of goods on a Census basis increased $17.8 billion.
- Consumer goods increased $22.5 billion.
- Pharmaceutical preparations increased $20.9 billion.
- Capital goods increased $3.7 billion.
- Computer accessories increased $2.0 billion.
- Automotive vehicles, parts, and engines increased $2.6 billion.
- Passenger cars increased $2.1 billion.
- Industrial supplies and materials decreased $10.7 billion.
- Finished metal shapes decreased $10.3 billion.
- Nonmonetary gold decreased $1.8 billion.
- Crude oil decreased $1.2 billion.
Net balance of payments adjustments decreased less than $0.1 billion.
Imports of services decreased $0.1 billion to $72.2 billion in March.
- Travel decreased $0.4 billion.
- Transport increased $0.2 billion.
Real Goods in 2017 Dollars – Census Basis (exhibit 11)
The real goods deficit increased $14.0 billion, or 10.2 percent, to $150.9 billion in March, compared to a 10.3 percent increase in the nominal deficit.
- Real exports of goods increased $2.4 billion, or 1.6 percent, to $149.7 billion, compared to a 1.4 percent increase in nominal exports.
- Real imports of goods increased $16.4 billion, or 5.8 percent, to $300.6 billion, compared to a 5.5 percent increase in nominal imports.
Revisions
Revisions to February exports
- Exports of goods were revised down less than $0.1 billion.
- Exports of services were revised down $0.4 billion.
Revisions to February imports
- Imports of goods were revised up less than $0.1 billion.
- Imports of services were revised up $0.1 billion.
Goods by Selected Countries and Areas: Monthly – Census Basis (exhibit 19)
The March figures show surpluses, in billions of dollars, with Netherlands ($4.5), South and Central America ($3.2), Hong Kong ($1.9), United Kingdom ($1.2), Singapore ($0.5), Brazil ($0.5), and Saudi Arabia ($0.2). Deficits were recorded, in billions of dollars, with European Union ($48.3), Ireland ($29.3), China ($24.8), Mexico ($16.8), Switzerland ($14.7), Vietnam ($14.1), Taiwan ($8.7), India ($7.7), Germany ($7.5), South Korea ($6.8), Japan ($5.8), Canada ($4.9), Italy ($4.4), France ($3.9), Malaysia ($3.2), Australia ($1.0), Israel ($1.0), and Belgium ($0.1).
- The deficit with Ireland increased $15.3 billion to $29.3 billion in March. Exports increased $0.1 billion to $1.4 billion and imports increased $15.5 billion to $30.7 billion.
- The deficit with France increased $2.4 billion to $3.9 billion in March. Exports increased $0.1 billion to $4.0 billion and imports increased $2.6 billion to $7.9 billion.
- The deficit with Switzerland decreased $4.1 billion to $14.7 billion in March. Exports increased $1.1 billion to $3.5 billion and imports decreased $3.0 billion to $18.3 billion.
All statistics referenced are seasonally adjusted; statistics are on a balance of payments basis unless otherwise specified. Additional statistics, including not seasonally adjusted statistics and details for goods on a Census basis, are available in exhibits 1-20b of this release. For information on data sources, definitions, and revision procedures, see the explanatory notes in this release. The full release can be found at www.census.gov/foreign-trade/Press-Release/current_press_release/index.html or www.bea.gov/data/intl-trade-investment/international-trade-goods-and-services. The full schedule is available in the Census Bureau’s Economic Briefing Room at www.census.gov/economic-indicators/ or on BEA’s website at www.bea.gov/news/schedule.
Next release: June 5, 2025, at 8:30 a.m. EDT
U.S. International Trade in Goods and Services, April 2025
Country Name Changes
With this release of the “U.S. International Trade in Goods and Services” report, references to “Congo (Brazzaville)” and “Congo (Kinshasa)” are replaced with “Congo” and “Democratic Republic of the Congo,” respectively, to reflect the countries’ recent name changes. These changes also align with the names recognized by the U.S. Department of State and the International Organization for Standardization.
Impact of Canada Border Services Agency’s (CBSA) Release of CBSA Assessment and Revenue Management (CARM)
The CBSA introduced a new accounting system (CARM) on October 21, 2024. As a result, importers in Canada have experienced delays in filing shipment information. These delays affected the compilation of statistics on U.S. exports of goods to Canada for September 2024 through February 2025, which are derived from data compiled by Canada through the United States - Canada Data Exchange. A dollar estimate of the filing backlog is included in estimates for late receipts and, following the U.S. Census Bureau’s customary practice for late receipt estimates, is included in the export end-use category “Other goods” as well as in exports to Canada. This estimate will be replaced with the actual transactions reported by the Harmonized System classification in June 2025 with the release of “U.S. International Trade in Goods and Services, Annual Revision.” Until then, please refer to the supplemental spreadsheet “CARM Exports to Canada Corrections,” which provides a breakdown of the late receipts by 1-digit end-use category for statistics through 2024. This spreadsheet will be updated as late export transactions are received to reflect reassignments from the initial “Other goods” category to the appropriate 1-digit end-use category. Any 2025 impacts will be revised in June 2026.
If you have questions or need additional information, please contact the Census Bureau, Economic Indicators Division, International Trade Macro Analysis Branch, on 800-549-0595, option 4, or at eid.international.trade.data@census.gov.
Upcoming Updates to Goods and Services
With the releases of the “U.S. International Trade in Goods and Services” report (FT-900) and the FT-900 Annual Revision on June 5, 2025, statistics on trade in goods, on both a Census basis and a balance of payments (BOP) basis, will be revised beginning with 2020 and statistics on trade in services will be revised beginning with 2018. The revised statistics for goods on a BOP basis and for services will also be included in the “U.S. International Transactions, 1st Quarter 2025 and Annual Update” report and in the international transactions interactive database, both to be released by BEA on June 24, 2025.
Revised statistics on trade in goods will reflect:
- Corrections and adjustments to previously published not seasonally adjusted statistics for goods on a Census basis.
- End-use reclassifications of several commodities.
- Recalculated seasonal and trading-day adjustments.
- Newly available and revised source data on BOP adjustments, which are adjustments that BEA applies to goods on a Census basis to convert them to a BOP basis. See the “Goods (balance of payments basis)” section in the explanatory notes for more information.
Revised statistics on trade in services will reflect:
- Newly available and revised source data, primarily from BEA surveys of international services.
- Corrections and adjustments to previously published not seasonally adjusted statistics.
- Recalculated seasonal adjustments.
- Revised temporal distributions of quarterly source data to monthly statistics. See the “Services” section in the explanatory notes for more information.
For more information, see “Preview of the 2025 Annual Update of the International Economic Accounts” in the Survey of Current Business.
If you have questions or need additional information, please contact the Census Bureau, Economic Indicators Division, International Trade Macro Analysis Branch, on 800-549-0595, option 4, or at eid.international.trade.data@census.gov or BEA, Balance of Payments Division, at InternationalAccounts@bea.gov.