BEA 25-60
Scheduled Date
June 30 10:00:am
Release Title
Trade in Value Added, 2023
Release URL

An official website of the United States government
|
March 2025
|
-$140.5 B
|
|
February 2025
|
-$123.2 B
|
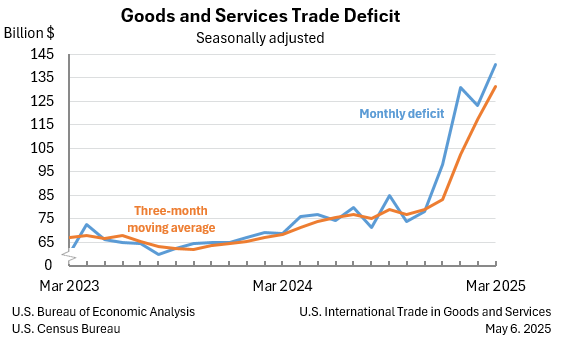
The U.S. monthly international trade deficit increased in March 2025 according to the U.S. Bureau of Economic Analysis and the U.S. Census Bureau. The deficit increased from $123.2 billion in February (revised) to $140.5 billion in March, as imports increased more than exports. The goods deficit increased $16.5 billion in March to $163.5 billion. The services surplus decreased $0.8 billion in March to $23.0 billion.
|
February 2025
|
-$122.7 B
|
|
January 2025
|
-$130.7 B
|
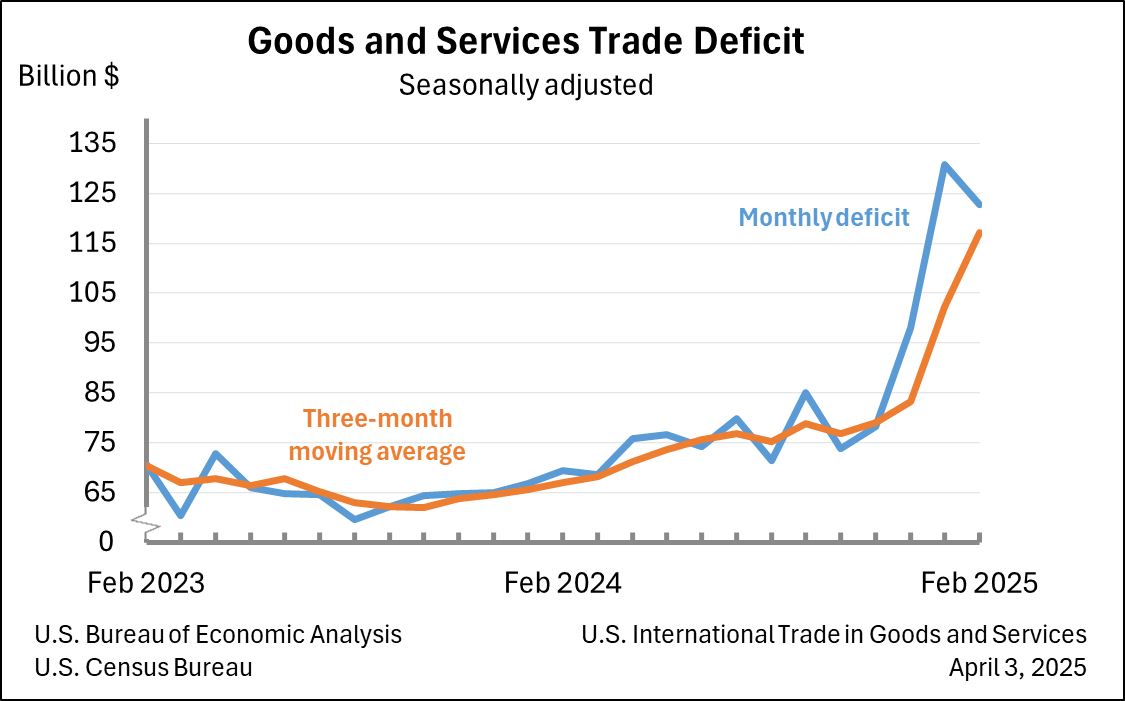
The U.S. monthly international trade deficit decreased in February 2025 according to the U.S. Bureau of Economic Analysis and the U.S. Census Bureau. The deficit decreased from $130.7 billion in January (revised) to $122.7 billion in February, as exports increased and imports decreased. The goods deficit decreased $8.8 billion in February to $147.0 billion. The services surplus decreased $0.8 billion in February to $24.3 billion.
|
January 2025
|
-$131.4 B
|
|
December 2024
|
-$98.1 B
|
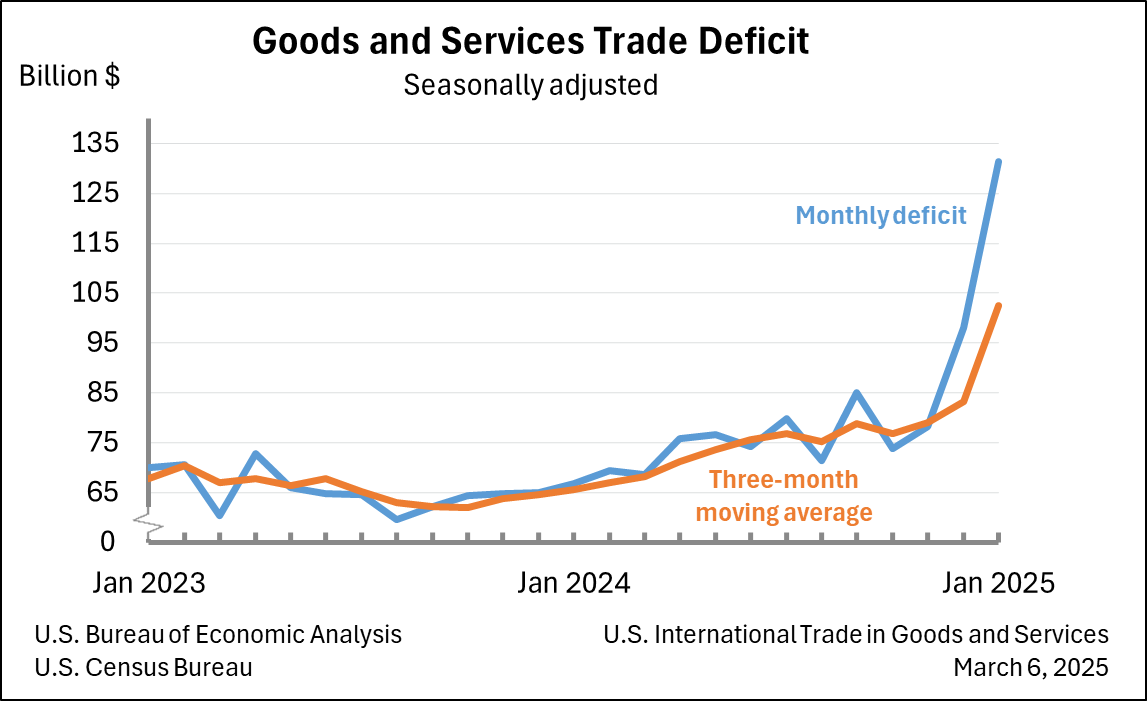
The U.S. monthly international trade deficit increased in January 2025 according to the U.S. Bureau of Economic Analysis and the U.S. Census Bureau. The deficit increased from $98.1 billion in December (revised) to $131.4 billion in January, as imports increased more than exports. The goods deficit increased $33.5 billion in January to $156.8 billion. The services surplus increased $0.2 billion in January to $25.4 billion.
|
December 2024
|
-$98.4 billion
|
|
November 2024
|
-$78.9 billion
|
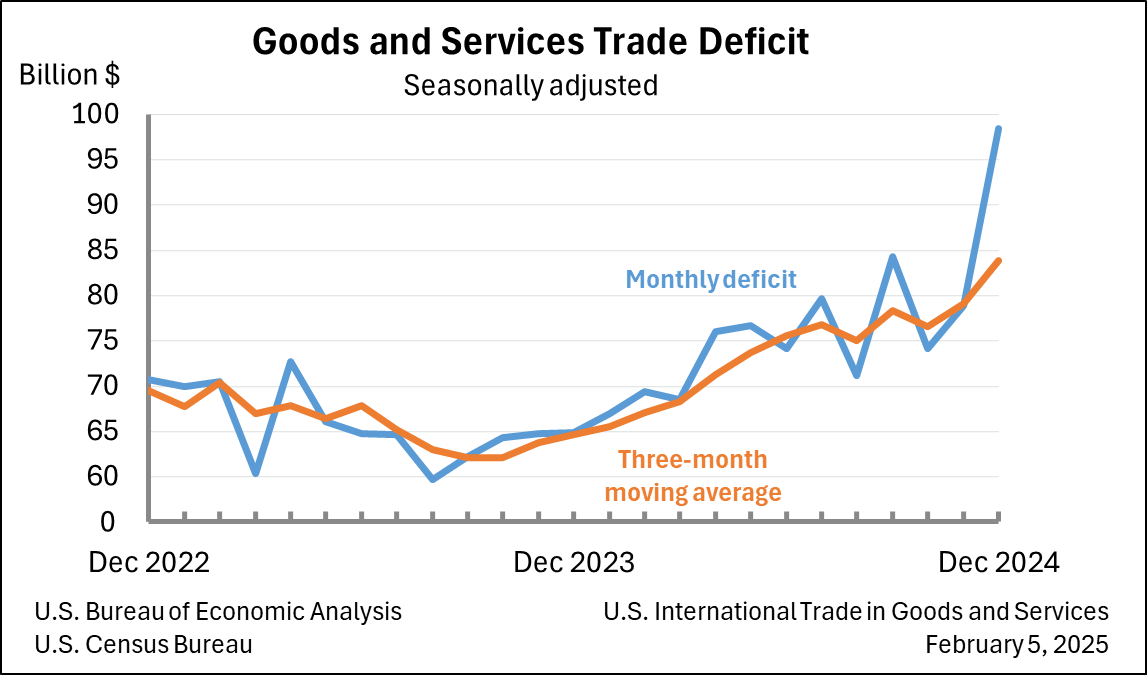
The U.S. monthly international trade deficit increased in December 2024 according to the U.S. Bureau of Economic Analysis and the U.S. Census Bureau. The deficit increased from $78.9 billion in November (revised) to $98.4 billion in December, as imports increased and exports decreased. The goods deficit increased $18.9 billion in December to $123.0 billion. The services surplus decreased $0.6 billion in December to $24.5 billion.
|
November 2024
|
-$78.2 billion
|
|
October 2024
|
-$73.6 billion
|
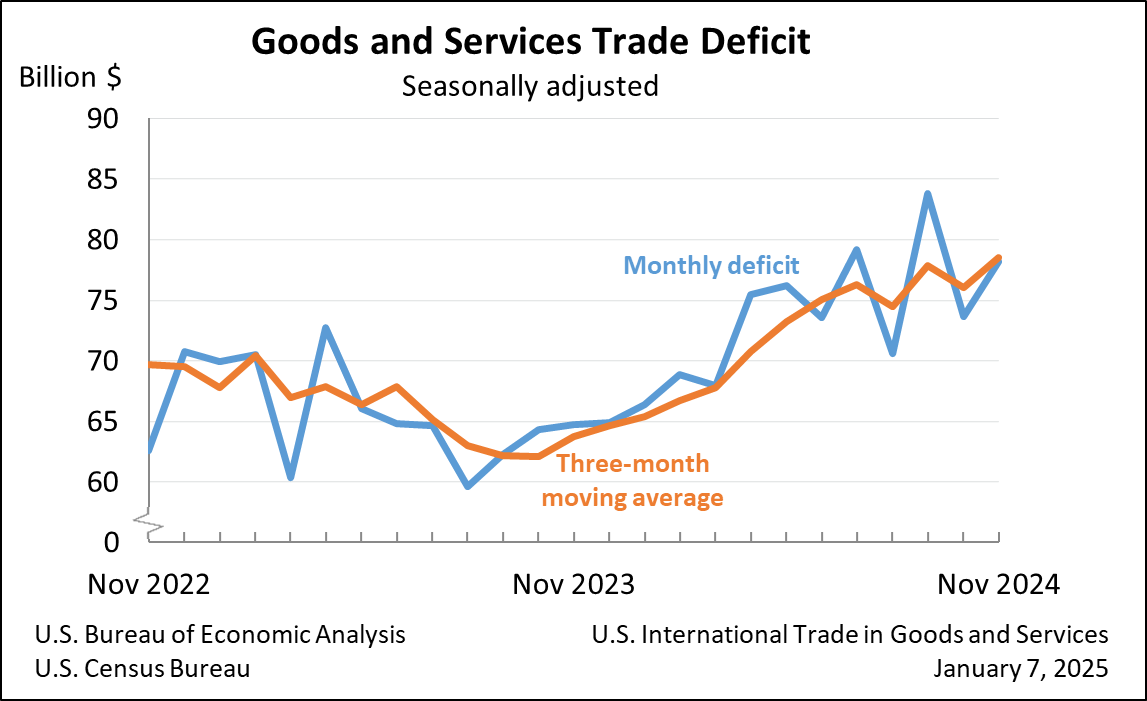
The U.S. monthly international trade deficit increased in November 2024 according to the U.S. Bureau of Economic Analysis and the U.S. Census Bureau. The deficit increased from $73.6 billion in October (revised) to $78.2 billion in November, as imports increased more than exports. The goods deficit increased $5.4 billion in November to $103.4 billion. The services surplus increased $0.9 billion in November to $25.2 billion.
|
October 2024
|
-$73.8 B
|
|
September 2024
|
-$83.8 B
|
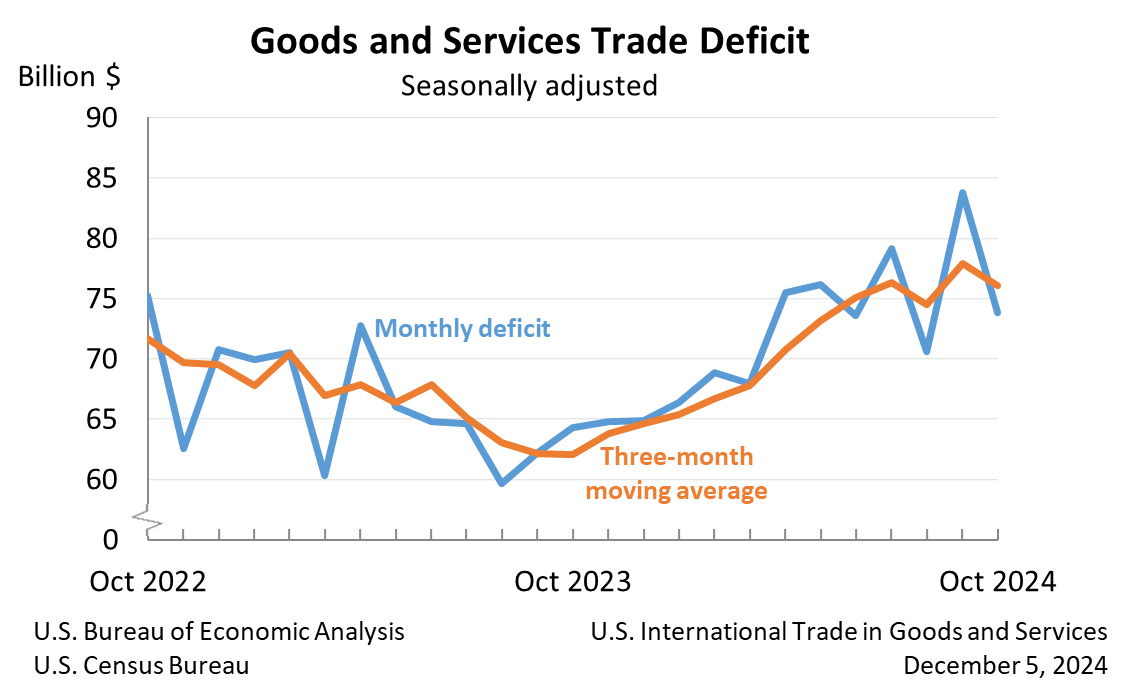
The U.S. monthly international trade deficit decreased in October 2024 according to the U.S. Bureau of Economic Analysis and the U.S. Census Bureau. The deficit decreased from $83.8 billion in September (revised) to $73.8 billion in October, as imports decreased more than exports. The goods deficit decreased $10.4 billion in October to $98.7 billion. The services surplus decreased $0.4 billion in October to $24.8 billion.
|
September 2024
|
-$84.4 B
|
|
August 2024
|
-$70.8 B
|
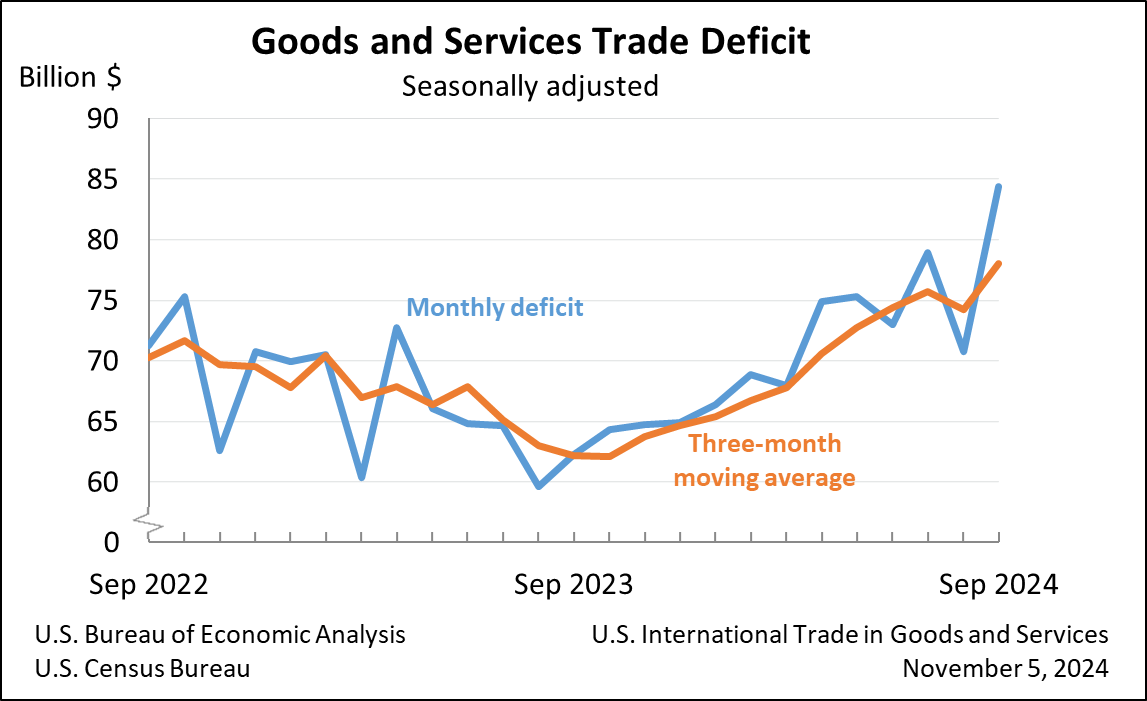
The U.S. monthly international trade deficit increased in September 2024 according to the U.S. Bureau of Economic Analysis and the U.S. Census Bureau. The deficit increased from $70.8 billion in August (revised) to $84.4 billion in September, as exports decreased and imports increased. The goods deficit increased $14.2 billion in September to $109.0 billion. The services surplus increased $0.6 billion in September to $24.6 billion.
|
August 2024
|
-$70.4 B
|
|
July 2024
|
-$78.9 B
|
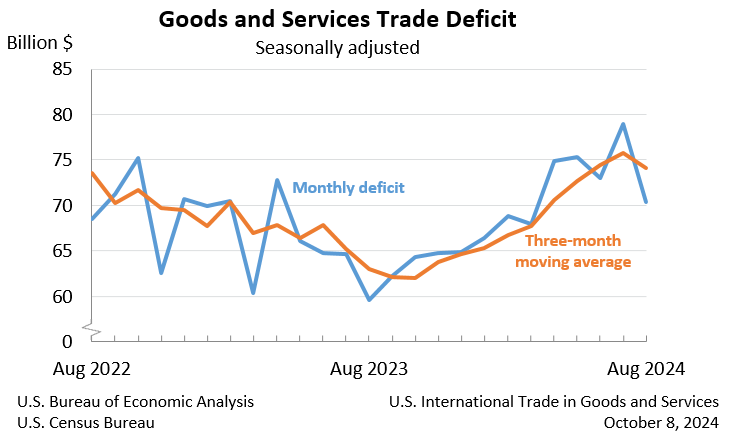
The U.S. monthly international trade deficit decreased in August 2024 according to the U.S. Bureau of Economic Analysis and the U.S. Census Bureau. The deficit decreased from $78.9 billion in July (revised) to $70.4 billion in August, as exports increased and imports decreased. The goods deficit decreased $8.4 billion in August to $94.9 billion. The services surplus increased $0.1 billion in August to $24.4 billion.