BEA 19-64
Scheduled Date
December 5 08:30:am
Release Title
U.S. International Trade in Goods and Services, October 2019

An official website of the United States government
|
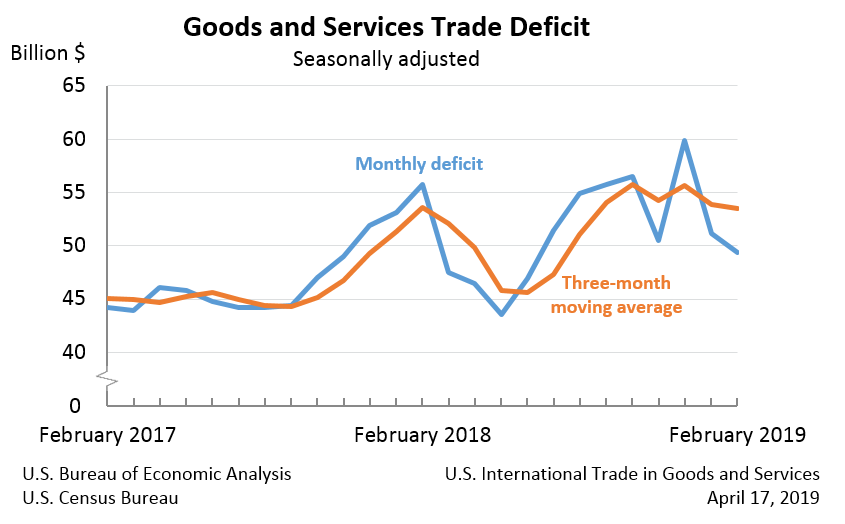
February 2019:
|
-$49.4 billion
|
|
January 2019:
|
-$51.1 billion
|
The U.S. monthly international trade deficit decreased in February 2019 according to the U.S. Bureau of Economic Analysis and the U.S. Census Bureau. The deficit decreased from $51.1 billion in January (revised) to $49.4 billion in February, as exports increased more than imports. The previously published January deficit was $51.1 billion. The goods deficit decreased $1.2 billion in February to $72.0 billion. The services surplus increased $0.5 billion in February to $22.6 billion.
|
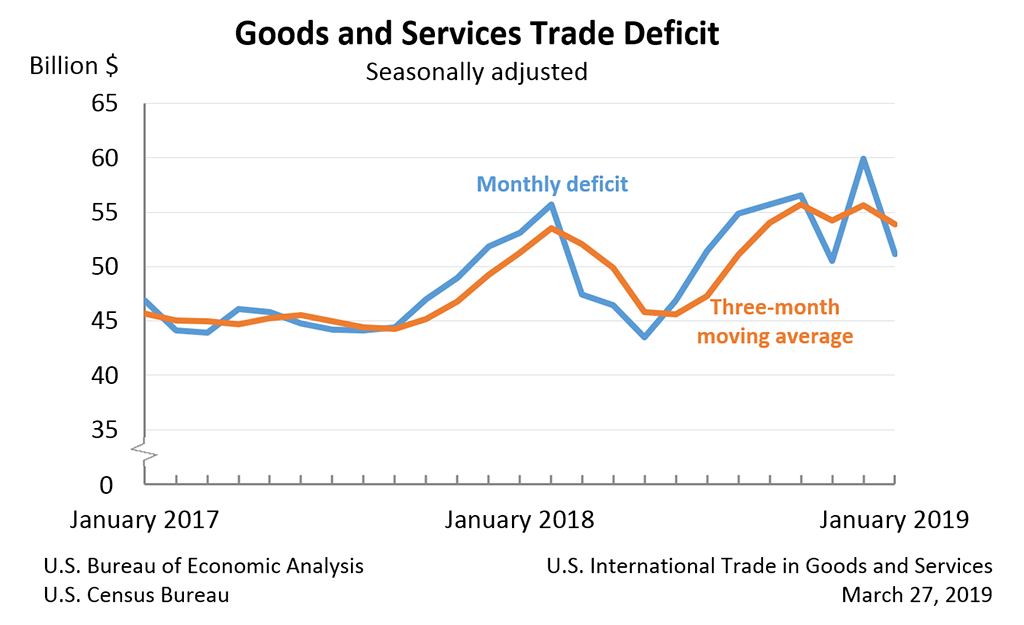
January 2019:
|
-$51.1 billion
|
|
December 2018:
|
-$59.9 billion
|
The U.S. monthly international trade deficit decreased in January 2019 according to the U.S. Bureau of Economic Analysis and the U.S. Census Bureau. The deficit decreased from $59.9 billion in December (revised) to $51.1 billion in January, as exports increased and imports decreased. The previously published December deficit was $59.8 billion. The goods deficit decreased $8.2 billion in January to $73.3 billion. The services surplus increased $0.5 billion in January to $22.1 billion.
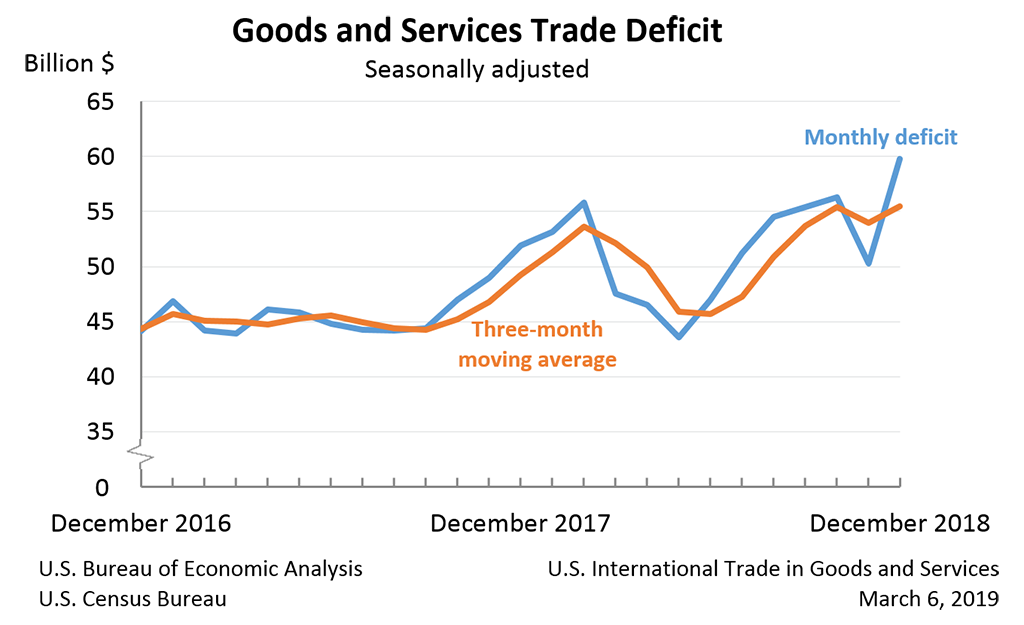
The U.S. monthly international trade deficit increased in December 2018 according to the U.S. Bureau of Economic Analysis and the U.S. Census Bureau. The deficit increased from $50.3 billion in November (revised) to $59.8 billion in December, as imports increased and exports decreased. The previously published November deficit was $49.3 billion. The goods deficit increased $9.0 billion in December to $81.5 billion. The services surplus decreased $0.5 billion in December to $21.8 billion.
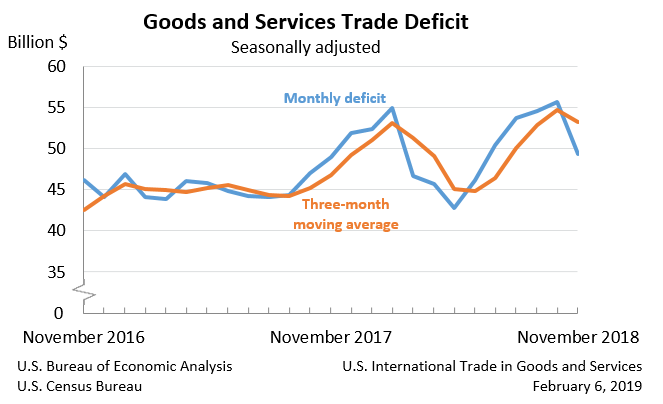
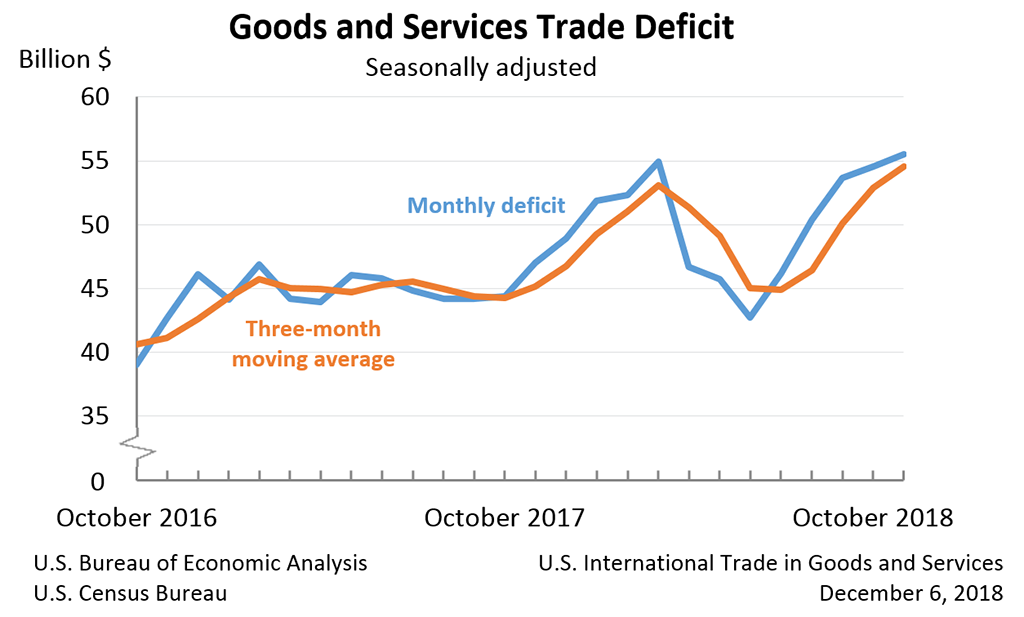
The U.S. monthly international trade deficit decreased in November 2018 according to the U.S. Bureau of Economic Analysis and the U.S. Census Bureau. The deficit decreased from $55.7 billion in October (revised) to $49.3 billion in November, as imports decreased more than exports. The previously published October deficit was $55.5 billion. The goods deficit decreased $6.7 billion in November to $71.6 billion. The services surplus decreased $0.3 billion in November to $22.3 billion.
|
October 2018:
|
-$55.5 billion
|
|
September 2018:
|
-$54.6 billion
|
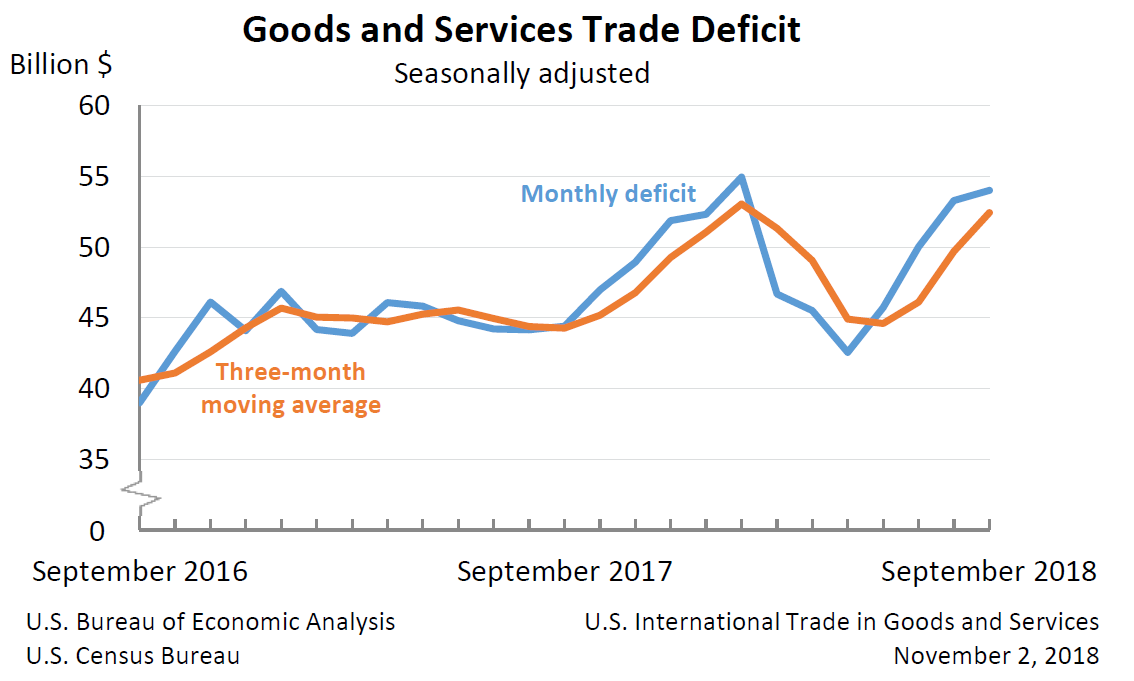
The U.S. monthly international trade deficit increased in October 2018 according to the U.S. Bureau of Economic Analysis and the U.S. Census Bureau. The deficit increased from $54.6 billion in September (revised) to $55.5 billion in October, as exports decreased and imports increased. The previously published September deficit was $54.0 billion. The goods deficit increased $0.9 billion in October to $78.1 billion. The services surplus decreased $0.1 billion in October to $22.6 billion.
|
September 2018:
|
-$54.0 billion
|
|
August 2018:
|
-$53.3 billion
|
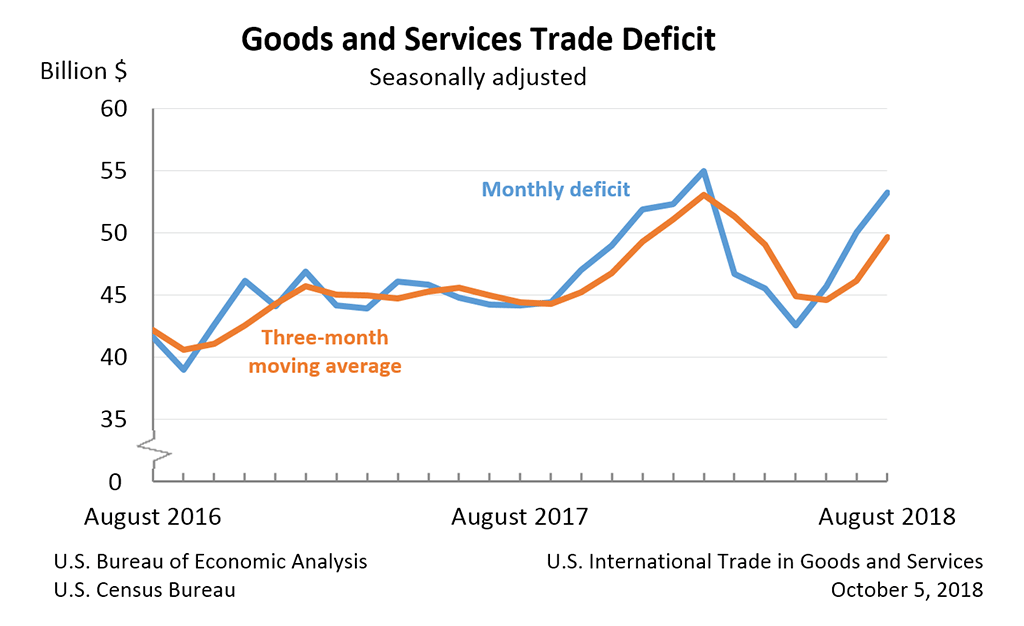
The U.S. monthly international trade deficit increased in September 2018 according to the U.S. Bureau of Economic Analysis and the U.S. Census Bureau. The deficit increased from $53.3 billion in August (revised) to $54.0 billion in September, as imports increased more than exports. The previously published August deficit was $53.2 billion. The goods deficit increased $0.6 billion in September to $77.2 billion. The services surplus decreased $0.1 billion in September to $23.2 billion.
|
August 2018:
|
-$53.2 billion
|
|
July 2018:
|
-$50.0 billion
|
The U.S. Census Bureau and the U.S. Bureau of Economic Analysis announced today that the goods and services deficit was $53.2 billion in August, up $3.2 billion from $50.0 billion in July, revised. August exports were $209.4 billion, $1.7 billion less than July exports. August imports were $262.7 billion, $1.5 billion more than July imports.