BEA 25-07
Scheduled Date
March 6 08:30:am
Release Title
U.S. International Trade in Goods and Services, January 2025

An official website of the United States government
|
July 2024
|
-$78.8 B
|
|
June 2024
|
-$73.0 B
|
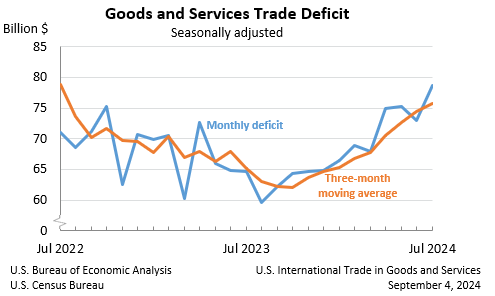
The U.S. goods and services trade deficit increased in July 2024 according to the U.S. Bureau of Economic Analysis and the U.S. Census Bureau. The deficit increased from $73.0 billion in June (revised) to $78.8 billion in July, as imports increased more than exports. The goods deficit increased $5.6 billion in July to $103.1 billion. The services surplus decreased $0.2 billion in July to $24.3 billion.
|
June 2024
|
-$73.1 B
|
|
May 2024
|
-$75.0 B
|
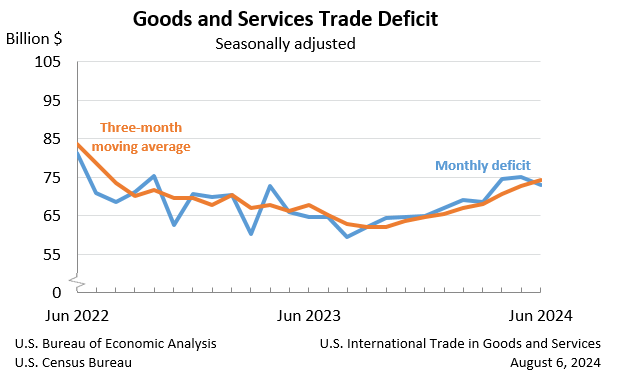
The U.S. goods and services trade deficit decreased in June 2024 according to the U.S. Bureau of Economic Analysis and the U.S. Census Bureau. The deficit decreased from $75.0 billion in May (revised) to $73.1 billion in June, as exports increased more than imports. The goods deficit decreased $2.5 billion in June to $97.4 billion. The services surplus decreased $0.6 billion in June to $24.2 billion.
|
May 2024
|
-$75.1 B
|
|
April 2024
|
-$74.5 B
|
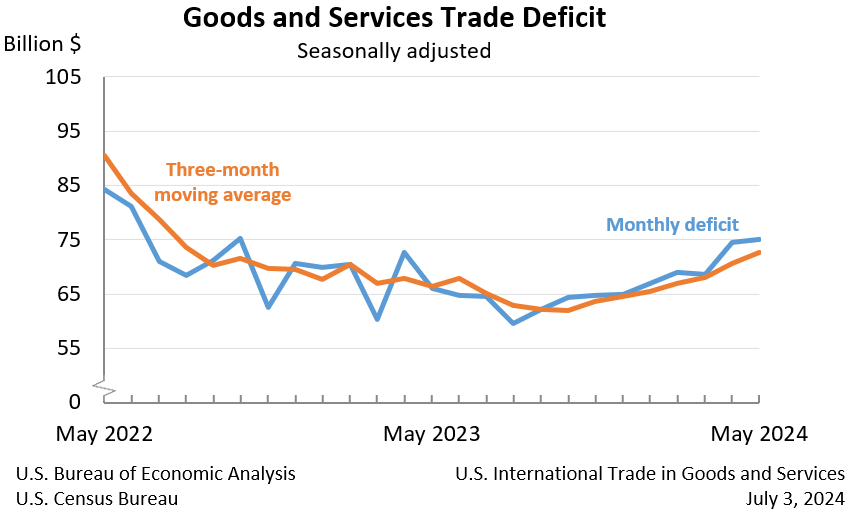
The U.S. goods and services trade deficit increased in May 2024 according to the U.S. Bureau of Economic Analysis and the U.S. Census Bureau. The deficit increased from $74.5 billion in April (revised) to $75.1 billion in May, as exports decreased more than imports. The goods deficit increased $0.9 billion in May to $100.2 billion. The services surplus increased $0.3 billion in May to $25.1 billion.
|
April 2024
|
-$74.6 B
|
|
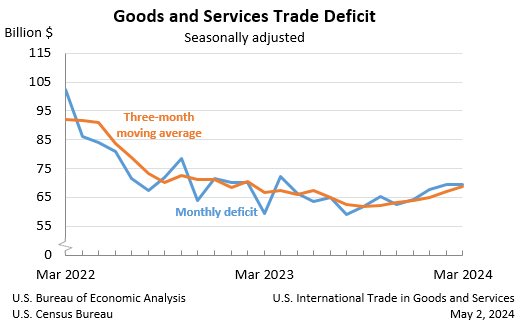
March 2024
|
-$68.6 B
|
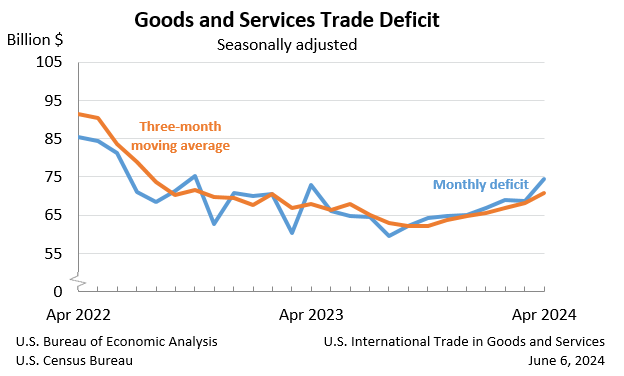
The U.S. goods and services trade deficit increased in April 2024 according to the U.S. Bureau of Economic Analysis and the U.S. Census Bureau. The deficit increased from $68.6 billion in March (revised) to $74.6 billion in April, as imports increased more than exports. The goods deficit increased $5.9 billion in April to $99.2 billion. The services surplus decreased $0.1 billion in April to $24.7 billion.
The U.S. goods and services trade deficit increased in April 2024 according to the U.S. Bureau of Economic Analysis and the U.S. Census Bureau. The deficit increased from $68.6 billion in March (revised) to $74.6 billion in April, as imports increased more than exports. The goods deficit increased $5.9 billion in April to $99.2 billion. The services surplus decreased $0.1 billion in April to $24.7 billion.
|
March 2024
|
-$69.4 B
|
|
February 2024
|
-$69.5 B
|
The U.S. goods and services trade deficit decreased in March 2024 according to the U.S. Bureau of Economic Analysis and the U.S. Census Bureau. The deficit decreased from $69.5 billion in February (revised) to $69.4 billion in March, as imports decreased more than exports. The goods deficit increased $0.8 billion in March to $92.5 billion. The services surplus increased $0.9 billion in March to $23.1 billion.