BEA 24-00
Scheduled Date
March 15 10:00:am
Release Title
Trade in Value Added, 2022
Release URL

An official website of the United States government
|
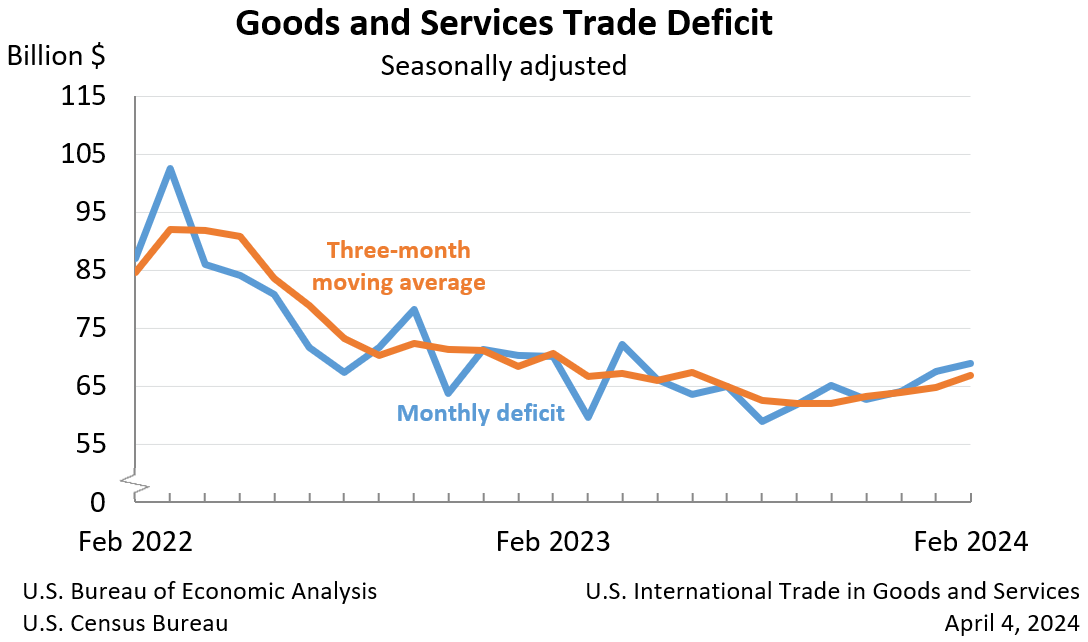
February 2024
|
-$68.9 B
|
|
January 2024
|
-$67.6 B
|
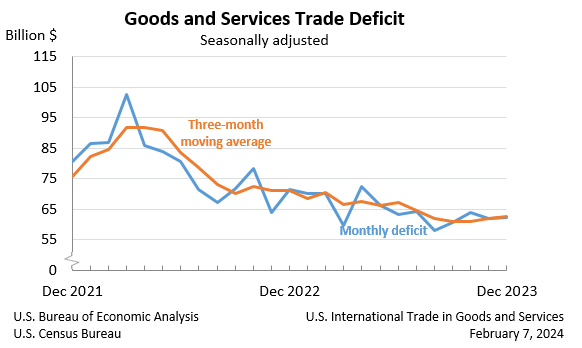
The U.S. goods and services trade deficit increased in February 2024 according to the U.S. Bureau of Economic Analysis and the U.S. Census Bureau. The deficit increased from $67.6 billion in January (revised) to $68.9 billion in February, as imports increased more than exports. The goods deficit decreased $0.3 billion in February to $91.4 billion. The services surplus decreased $1.6 billion in February to $22.5 billion.
|
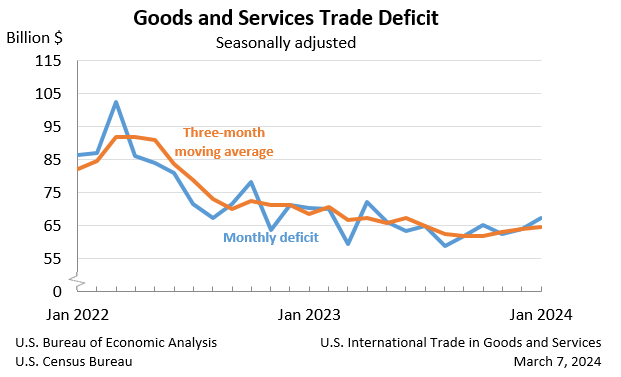
January 2024
|
-$67.4 B
|
|
December 2023
|
-$64.2 B
|
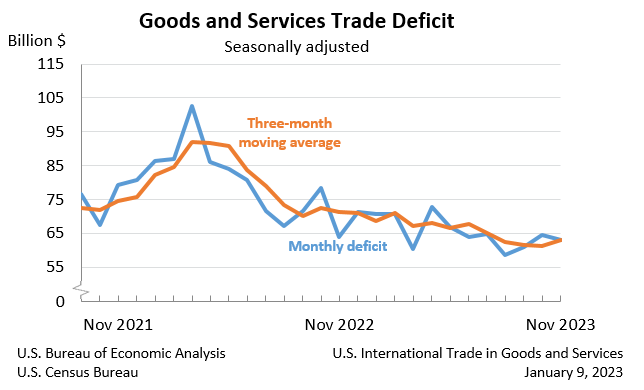
The U.S. monthly international trade deficit increased in January 2024 according to the U.S. Bureau of Economic Analysis and the U.S. Census Bureau. The deficit increased from $64.2 billion in December (revised) to $67.4 billion in January, as imports increased more than exports. The goods deficit increased $3.0 billion in January to $91.6 billion. The services surplus decreased $0.3 billion in January to $24.2 billion.
|
December 2023
|
-$62.2 B
|
|
November 2023
|
-$61.9 B
|
The U.S. monthly international trade deficit increased in December 2023 according to the U.S. Bureau of Economic Analysis and the U.S. Census Bureau. The deficit increased from $61.9 billion in November (revised) to $62.2 billion in December, as imports increased more than exports. The goods deficit increased $0.7 billion in December to $89.1 billion. The services surplus increased $0.4 billion in December to $26.9 billion.
|
November 2023
|
-$63.2 B
|
|
October 2023
|
-$64.5 B
|
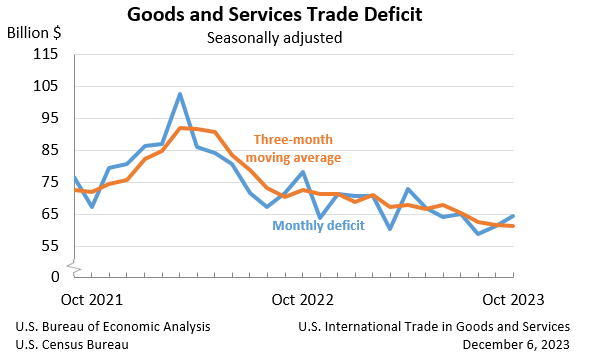
The U.S. monthly international trade deficit decreased in November 2023 according to the U.S. Bureau of Economic Analysis and the U.S. Census Bureau. The deficit decreased from $64.5 billion in October (revised) to $63.2 billion in November, as imports decreased more than exports. The goods deficit decreased $0.6 billion in November to $89.4 billion. The services surplus increased $0.7 billion in November to $26.2 billion.
|
October 2023
|
-$64.3 B
|
|
September 2023
|
-$61.2 B
|
The U.S. monthly international trade deficit increased in October 2023 according to the U.S. Bureau of Economic Analysis and the U.S. Census Bureau. The deficit increased from $61.2 billion in September (revised) to $64.3 billion in October as exports decreased and imports increased. The goods deficit increased $3.5 billion in October to $89.8 billion. The services surplus increased $0.4 billion in October to $25.5 billion.
|
September 2023
|
-$61.5 B
|
|
August 2023
|
-$58.7 B
|
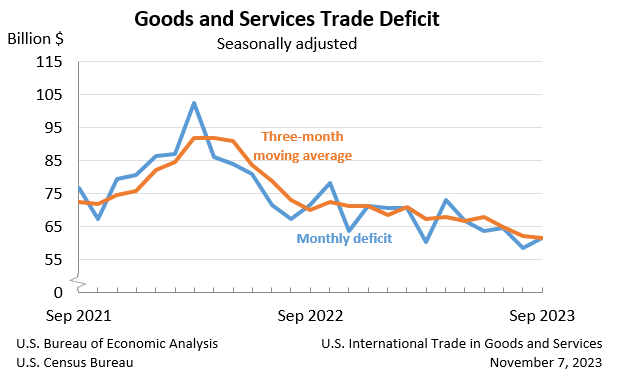
The U.S. monthly international trade deficit increased in September 2023 according to the U.S. Bureau of Economic Analysis and the U.S. Census Bureau. The deficit increased from $58.7 billion in August (revised) to $61.5 billion in September as imports increased more than exports. The goods deficit increased $1.7 billion in September to $86.3 billion. The services surplus decreased $1.2 billion in September to $24.8 billion.