BEA 24-01
Scheduled Date
January 9 08:30:am
Release Title
U.S. International Trade in Goods and Services, November 2023

An official website of the United States government
|
August 2023
|
-$58.3 B
|
|
July 2023
|
-$64.7 B
|
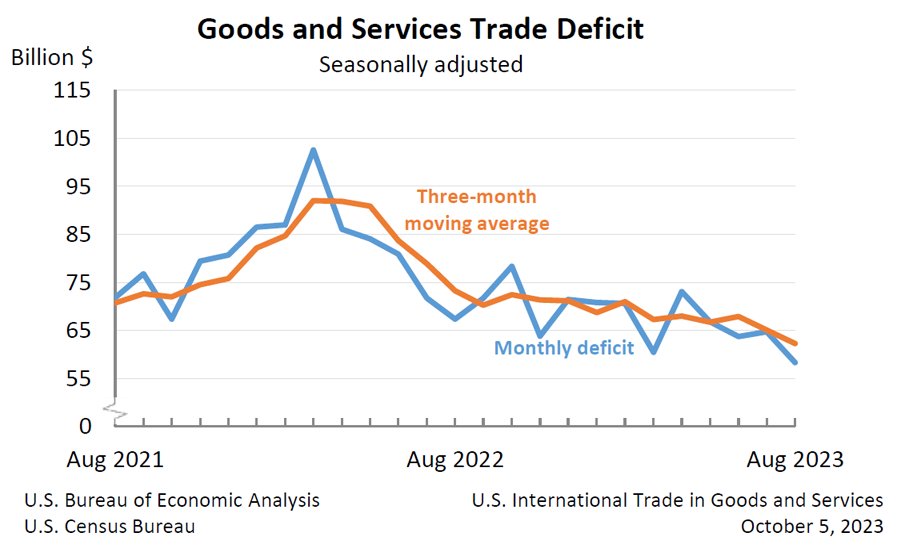
The U.S. monthly international trade deficit decreased in August 2023 according to the U.S. Bureau of Economic Analysis and the U.S. Census Bureau. The deficit decreased from $64.7 billion in July (revised) to $58.3 billion in August as exports increased and imports decreased. The goods deficit decreased $5.5 billion in August to $84.5 billion. The services surplus increased $1.0 billion in August to $26.2 billion.
|
July 2023
|
-$65.0 B
|
|
June 2023
|
-$63.7 B
|
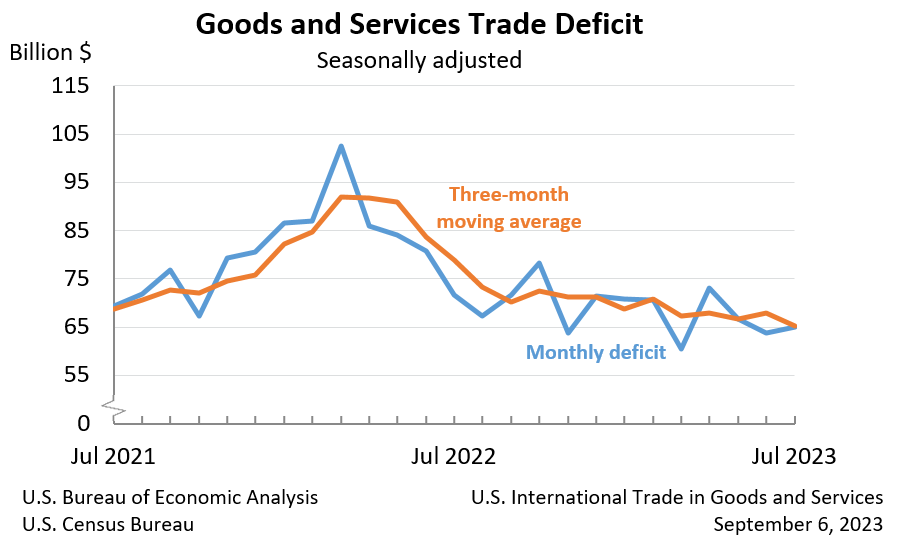
The U.S. monthly international trade deficit increased in July 2023 according to the U.S. Bureau of Economic Analysis and the U.S. Census Bureau. The deficit increased from $63.7 billion in June (revised) to $65.0 billion in July as imports increased more than exports. The goods deficit increased $2.0 billion in July to $90.0 billion. The services surplus increased $0.7 billion in June to $25.0 billion.
|
June 2023
|
-$65.5 B
|
|
May 2023
|
-$68.3 B
|
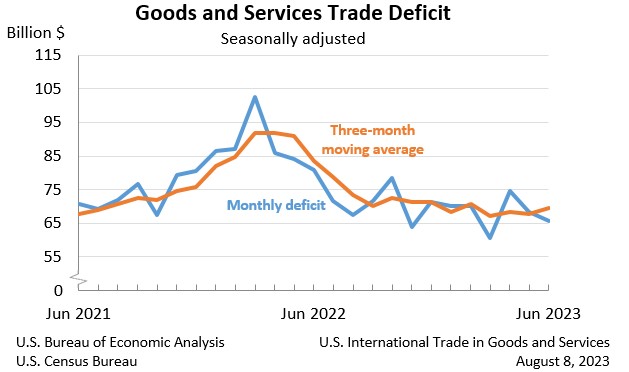
The U.S. monthly international trade deficit decreased in June 2023 according to the U.S. Bureau of Economic Analysis and the U.S. Census Bureau. The deficit decreased from $68.3 billion in May (revised) to $65.5 billion in June as imports decreased more than exports. The goods deficit decreased $2.8 billion in June to $88.2 billion. The services surplus decreased less than $0.1 billion in June to $22.7 billion.
|
May 2023
|
-$69.0 B
|
|
April 2023
|
-$74.4 B
|
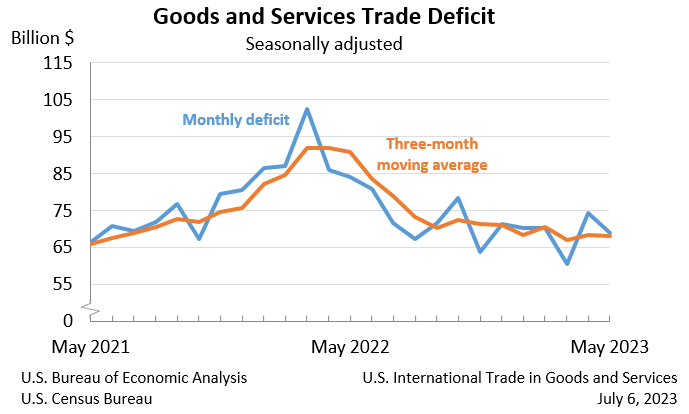
The U.S. monthly international trade deficit decreased in May 2023 according to the U.S. Bureau of Economic Analysis and the U.S. Census Bureau. The deficit decreased from $74.4 billion in April (revised) to $69.0 billion in May as imports decreased more than exports. The goods deficit decreased $4.8 billion in May to $91.3 billion. The services surplus increased $0.7 billion in May to $22.3 billion.
The U.S. monthly international trade deficit increased in April 2023 according to the U.S. Bureau of Economic Analysis and the U.S. Census Bureau. The deficit increased from $60.6 billion in March (revised) to $74.6 billion in April as exports decreased and imports increased. The goods deficit increased $14.5 billion in April to $96.1 billion. The services surplus increased $0.6 billion in April to $21.6 billion.
|
April 2023
|
-$74.6 B
|
|
March 2023
|
-$60.6 B
|
The U.S. monthly international trade deficit increased in April 2023 according to the U.S. Bureau of Economic Analysis and the U.S. Census Bureau. The deficit increased from $60.6 billion in March (revised) to $74.6 billion in April as exports decreased and imports increased. The goods deficit increased $14.5 billion in April to $96.1 billion. The services surplus increased $0.6 billion in April to $21.6 billion.
|
March 2023
|
-$64.2 B
|
|
February 2023
|
-$70.6 B
|
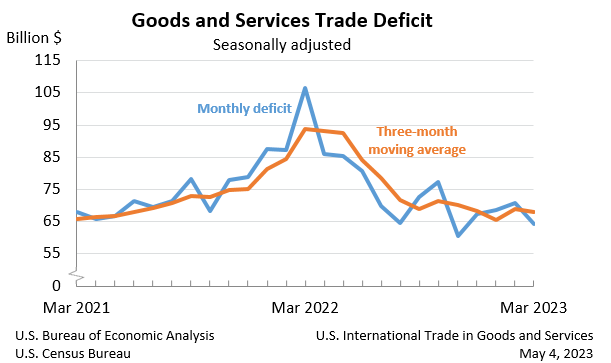
The U.S. monthly international trade deficit decreased in March 2023 according to the U.S. Bureau of Economic Analysis and the U.S. Census Bureau. The deficit decreased from $70.6 billion in February (revised) to $64.2 billion in March as exports increased and imports decreased. The goods deficit decreased $6.4 billion in March to $86.6 billion. The services surplus decreased less than $0.1 billion in March to $22.4 billion.
|
February 2023
|
-$70.5 B
|
|
January 2023
|
-$68.7 B
|
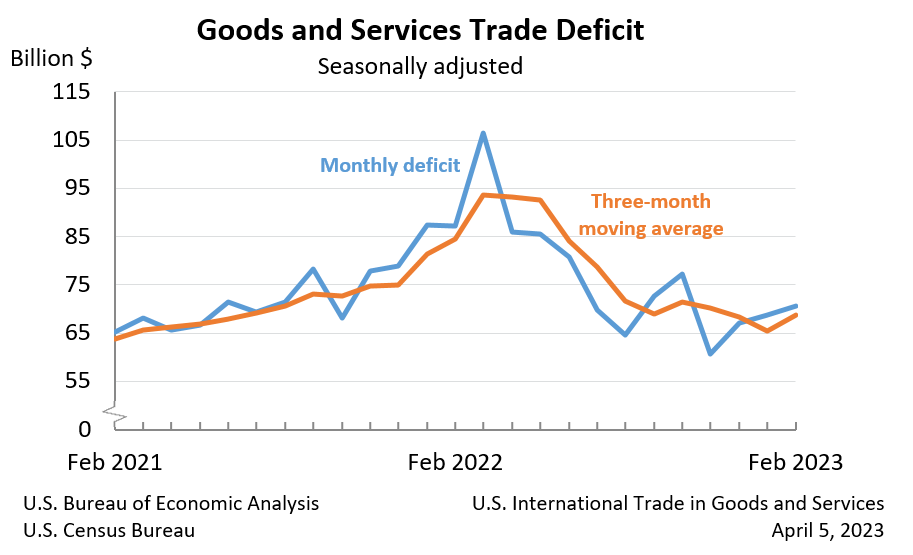
The U.S. monthly international trade deficit increased in February 2023 according to the U.S. Bureau of Economic Analysis and the U.S. Census Bureau. The deficit increased from $68.7 billion in January (revised) to $70.5 billion in February, as exports decreased more than imports. The goods deficit increased $2.7 billion in February to $93.0 billion. The services surplus increased $0.8 billion in February to $22.4 billion.
|
January 2023
|
-$68.3 B
|
|
December 2022
|
-$67.2 B
|
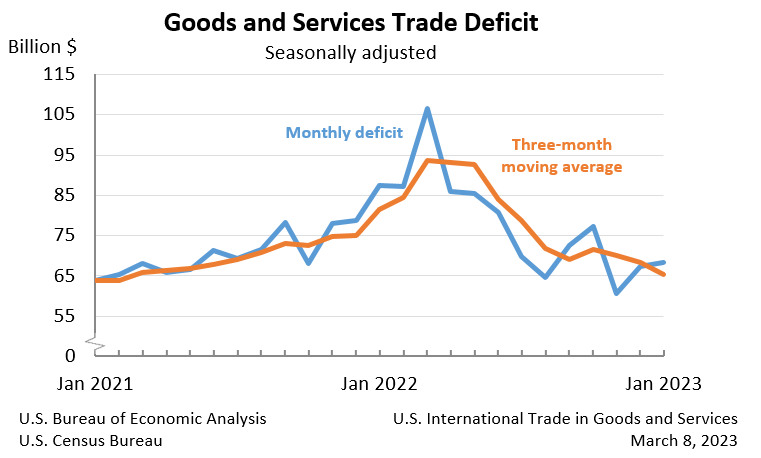
The U.S. monthly international trade deficit increased in January 2023 according to the U.S. Bureau of Economic Analysis and the U.S. Census Bureau. The deficit increased from $67.2 billion in December (revised) to $68.3 billion in January, as imports increased more than exports. The goods deficit decreased $0.6 billion in January to $90.1 billion. The services surplus decreased $1.7 billion in January to $21.8 billion.