BEA 26-47
Scheduled Date
December 23 08:30:am
Release Title
Personal Income and Outlays, November 2026

An official website of the United States government
|
May 2026
|
+0.7%
|
|
April 2026
|
+0.0%
|
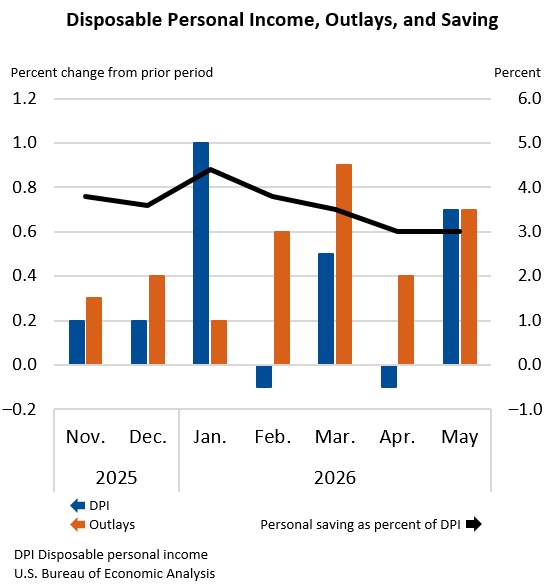
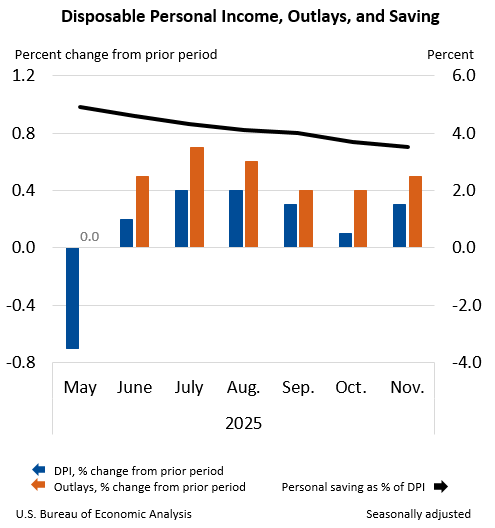
Personal income increased $181.6 billion (0.7 percent at a monthly rate) in May, according to estimates released today by the U.S. Bureau of Economic Analysis (BEA). Disposable personal income (DPI)—personal income less personal current taxes—increased $164.9 billion (0.7 percent), and personal consumption expenditures (PCE) increased $156.1 billion (0.7 percent). Personal outlays—the sum of PCE, personal interest payments, and personal current transfer payments—increased $159.9 billion in May. Personal saving was $704.2 billion in May, and the personal saving rate—personal saving as a percentage of DPI—was 3.0 percent
|
April 2026
|
0.0%
|
|
March 2026
|
+0.5%
|
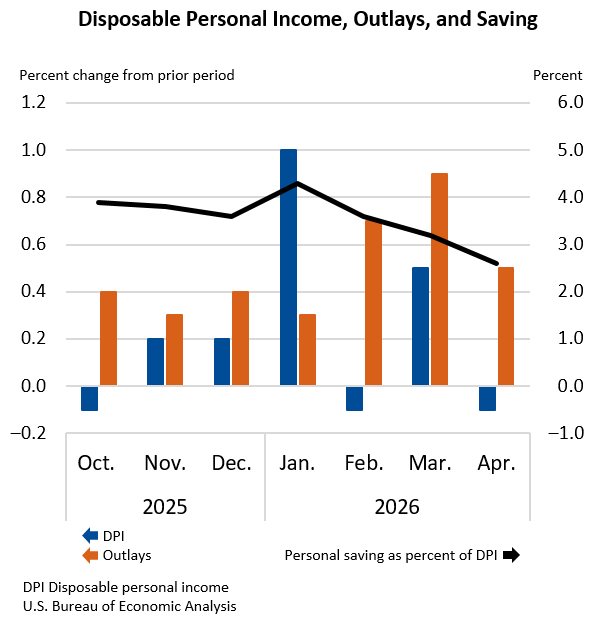
Personal income decreased less than $0.1 billion (less than 0.1 percent at a monthly rate) in April, according to estimates released today by the U.S. Bureau of Economic Analysis (BEA). Disposable personal income (DPI)—personal income less personal current taxes—decreased $19.9 billion (0.1 percent), and personal consumption expenditures (PCE) increased $111.1 billion (0.5 percent). Personal outlays—the sum of PCE, personal interest payments, and personal current transfer payments—increased $114.0 billion in April. Personal saving was $611.7 billion in April, and the personal saving rate—personal saving as a percentage of DPI—was 2.6 percent.
|
March 2026
|
+0.6%
|
|
February 2026
|
+0.0%
|
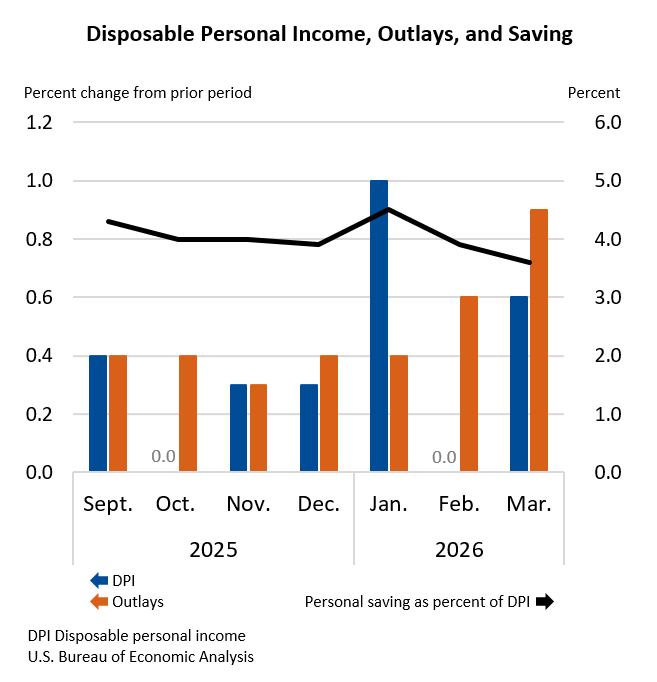
Personal income increased $149.2 billion (0.6 percent at a monthly rate) in March, according to estimates released today by the U.S. Bureau of Economic Analysis (BEA). Disposable personal income (DPI)—personal income less personal current taxes—increased $142.5 billion (0.6 percent), and personal consumption expenditures (PCE) increased $195.4 billion (0.9 percent). Personal outlays—the sum of PCE, personal interest payments, and personal current transfer payments—increased $198.6 billion in March. Personal saving was $857.3 billion in March, and the personal saving rate—personal saving as a percentage of DPI—was 3.6 percent.
|
February 2026
|
-0.1%
|
|
January 2026
|
+0.4%
|
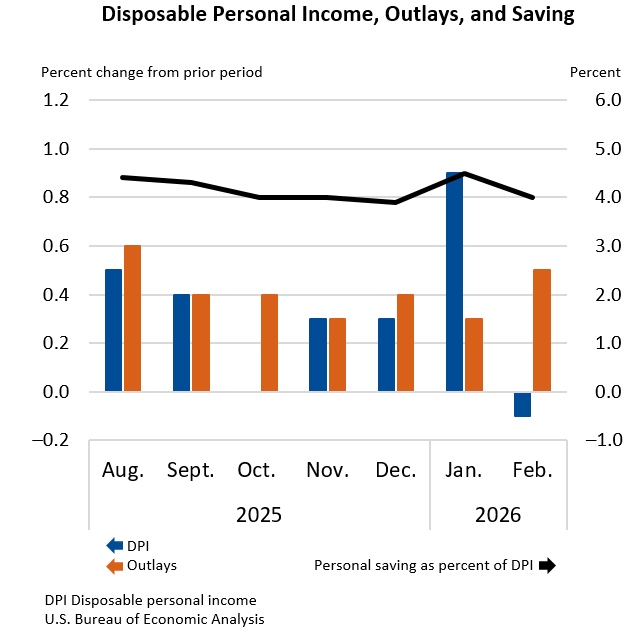
Personal income decreased $18.2 billion (0.1 percent at a monthly rate) in February, according to estimates released today by the U.S. Bureau of Economic Analysis. Disposable personal income (DPI)—personal income less personal current taxes—decreased $18.3 billion (0.1 percent), and personal consumption expenditures (PCE) increased $103.2 billion (0.5 percent). Personal outlays—the sum of PCE, personal interest payments, and personal current transfer payments—increased $106.5 billion in February. Personal saving was $931.5 billion in February, and the personal saving rate—personal saving as a percentage of DPI—was 4.0 percent.
|
January 2026
|
+0.4%
|
|
December 2025
|
+0.3%
|
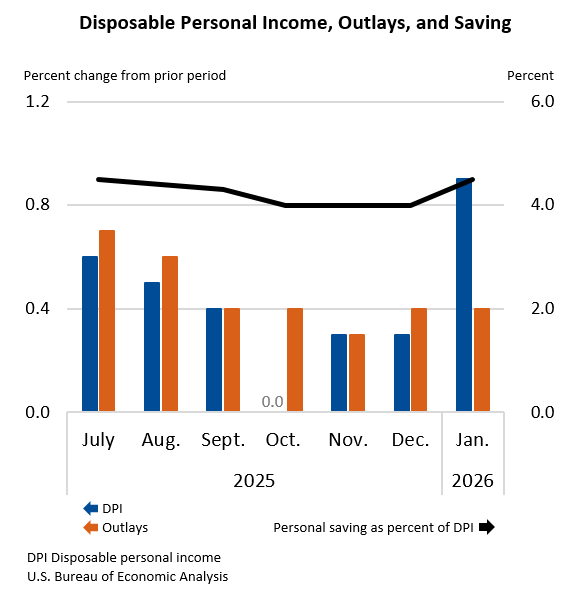
Personal income increased $113.8 billion (0.4 percent at a monthly rate) in January, according to estimates released today by the U.S. Bureau of Economic Analysis. Disposable personal income (DPI)—personal income less personal current taxes—increased $219.9 billion (0.9 percent), and personal consumption expenditures (PCE) increased $81.1 billion (0.4 percent). Personal outlays—the sum of PCE, personal interest payments, and personal current transfer payments—increased $85.8 billion in January. Personal saving was $1.05 trillion in January, and the personal saving rate—personal saving as a percentage of disposable personal income—was 4.5 percent.
|
December 2025
|
+0.3%
|
|
November 2025
|
+0.4%
|
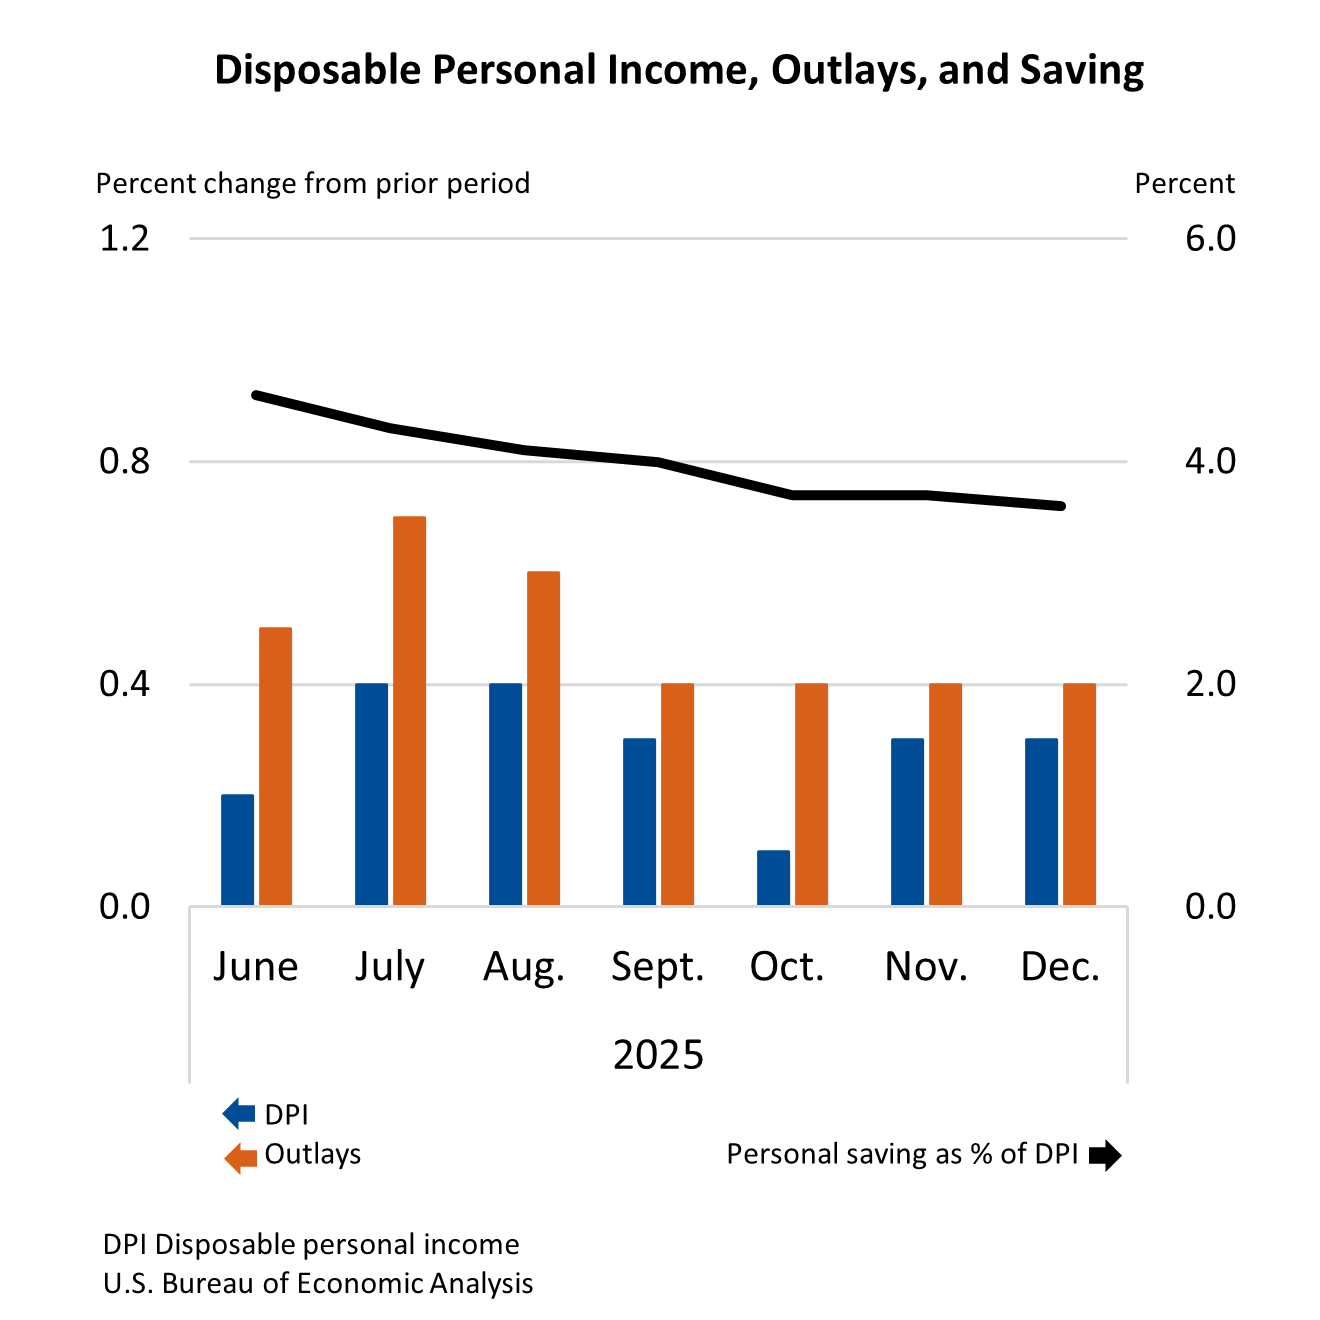
Personal income increased $86.2 billion (0.3 percent at a monthly rate) in December, according to estimates released today by the U.S. Bureau of Economic Analysis. Disposable personal income (DPI)—personal income less personal current taxes—increased $75.7 billion (0.3 percent), and personal consumption expenditures (PCE) increased $91.0 billion (0.4 percent). Personal outlays—the sum of PCE, personal interest payments, and personal current transfer payments—increased $90.2 billion in December. Personal saving was $830.8 billion in December, and the personal saving rate—personal saving as a percentage of disposable personal income—was 3.6 percent.
|
November 2025
|
+0.3%
|
|
October 2025
|
+0.1%
|
Personal income increased $30.6 billion (0.1 percent at a monthly rate) in October, followed by an increase of $80.0 billion (0.3 percent) in November, according to estimates released today by the U.S. Bureau of Economic Analysis. Disposable personal income (DPI)—personal income less personal current taxes—increased $12.0 billion (0.1 percent), followed by an increase of $63.7 billion (0.3 percent). Personal consumption expenditures (PCE) increased $98.6 billion (0.5 percent), followed by an increase of $108.7 billion (0.5 percent).
|
September 2025
|
+0.4%
|
|
August 2025
|
+0.4%
|
Personal income and outlays data for the months of July, August, and September 2025 were updated on December 23 with the initial estimate of gross domestic product (GDP) for the third quarter of 2025. The full updated monthly statistics, reflecting newly available source data, are available in a Tables Only spreadsheet, in BEA’s interactive data tables, and via the API.
|
September 2025
|
+0.4%
|
|
August 2025
|
+0.4%
|
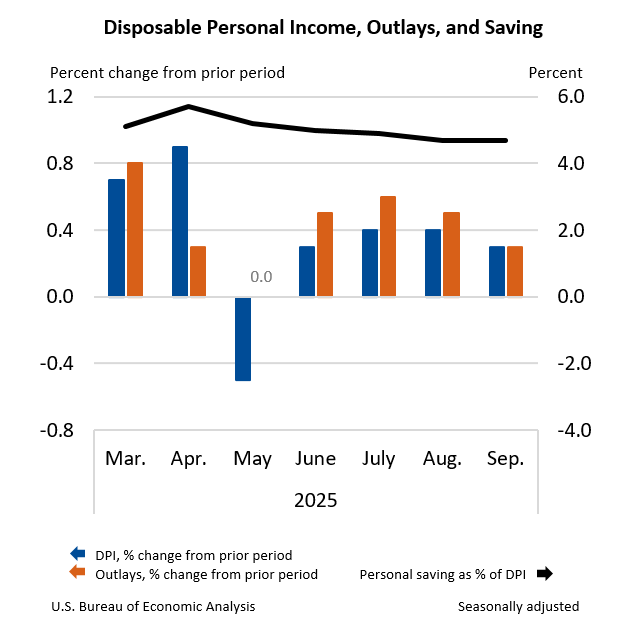
Personal income increased $94.5 billion (0.4 percent at a monthly rate) in September, according to estimates released today by the U.S. Bureau of Economic Analysis. Disposable personal income (DPI)—personal income less personal current taxes—increased $75.9 billion (0.3 percent) and personal consumption expenditures (PCE) increased $65.1 billion (0.3 percent). Personal outlays—the sum of PCE, personal interest payments, and personal current transfer payments—increased $70.7 billion in September. Personal saving was $1.09 trillion in September and the personal saving rate—personal saving as a percentage of disposable personal income—was 4.7 percent.