Personal Saving Rate
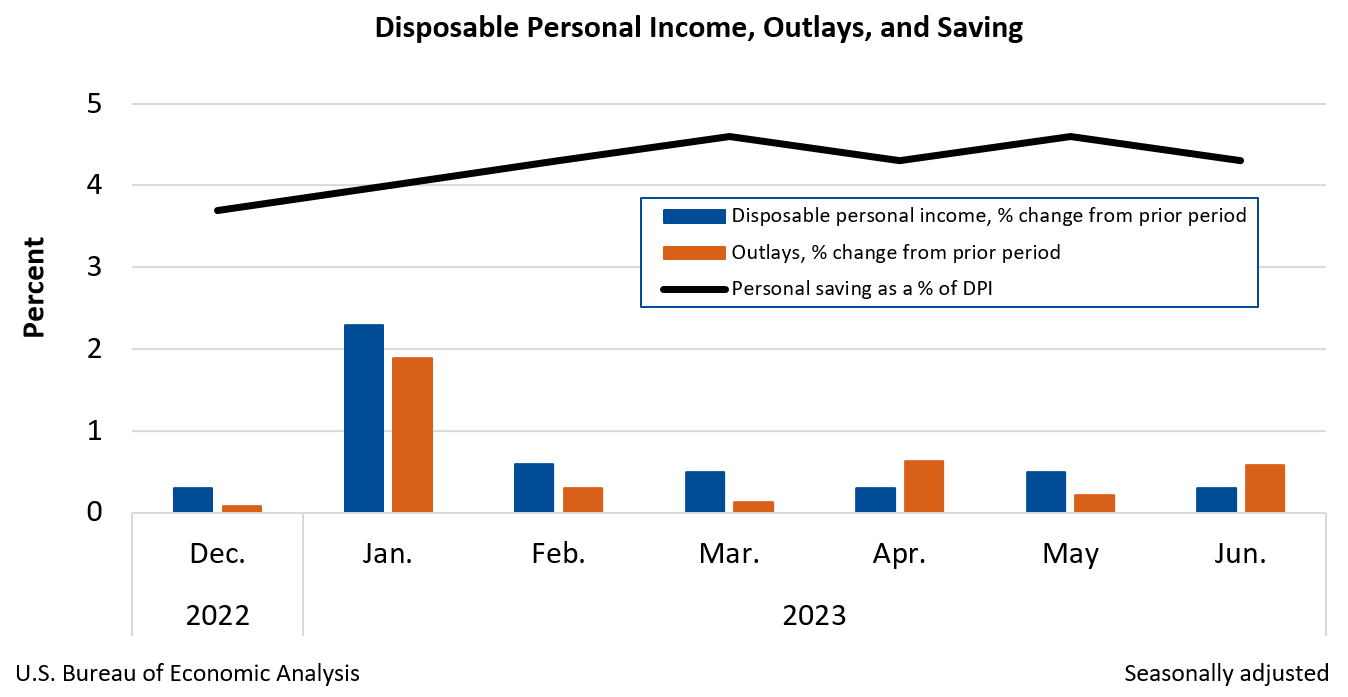
Personal Income and Outlays, June 2023
|
June 2023
|
+0.3%
|
|
May 2023
|
+0.5%
|
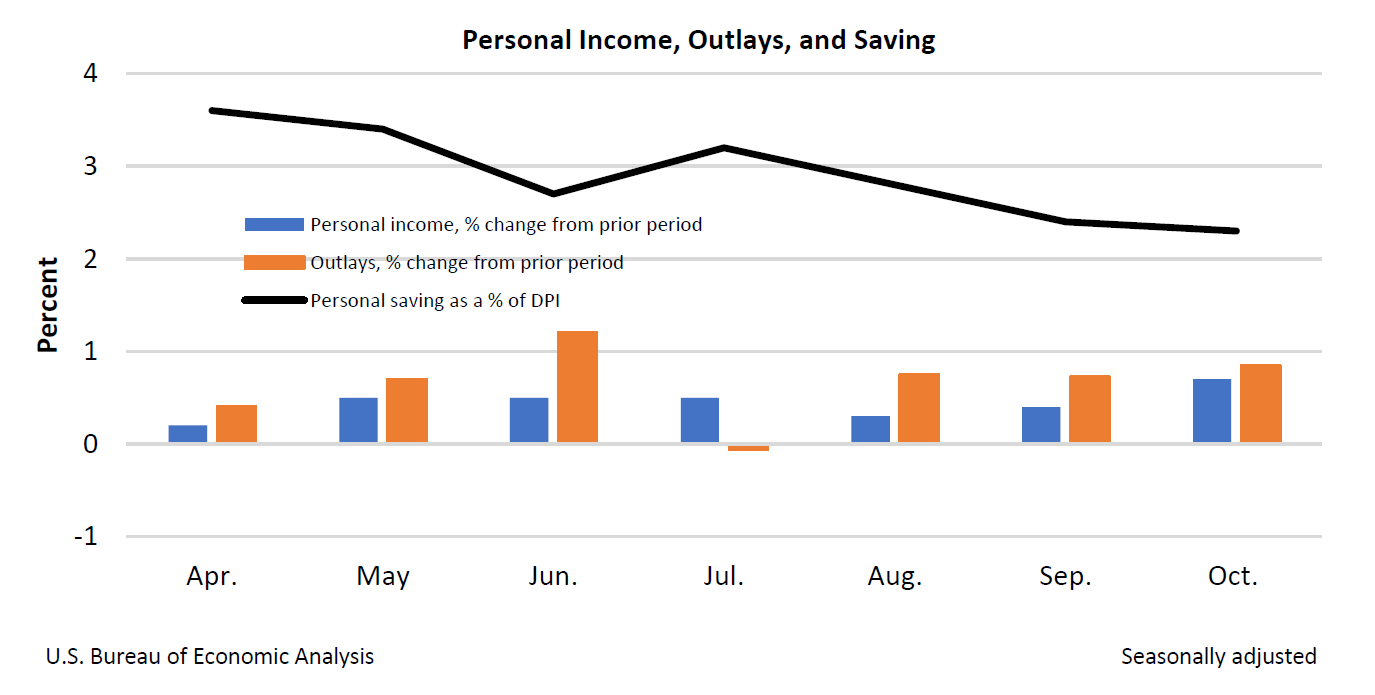
Personal income increased $69.5 billion (0.3 percent at a monthly rate) in June. Disposable personal income (DPI)—personal income less personal current taxes— increased $67.5 billion (0.3 percent). Personal outlays—the sum of personal consumption expenditures, personal interest payments, and personal current transfer payments—increased $109.4 billion (0.6 percent) and consumer spending increased $100.4 billion (0.5 percent). Personal saving was $862.4 billion and the personal saving rate—personal saving as a percentage of disposable personal income—was 4.3 percent in June.
- Current release: July 28, 2023
- Next release: August 31, 2023
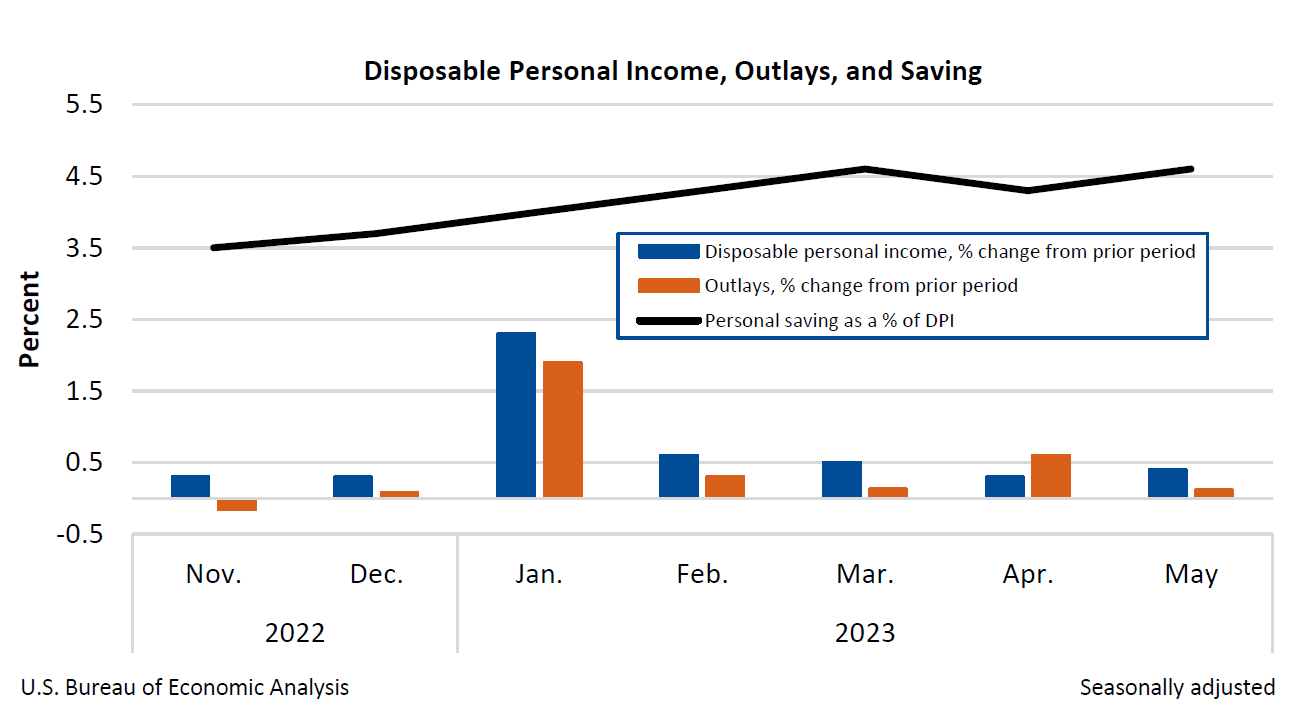
Personal Income and Outlays, May 2023
|
May 2023
|
+0.4%
|
|
April 2023
|
+0.3%
|
Personal income increased $91.2 billion (0.4 percent at a monthly rate) in May. Disposable personal income (DPI)—personal income less personal current taxes— increased $86.7 billion (0.4 percent). Personal outlays—the sum of personal consumption expenditures, personal interest payments, and personal current transfer payments—increased $22.7 billion (0.1 percent) and consumer spending increased $18.9 billion (0.1 percent). Personal saving was $910.3 billion and the personal saving rate—personal saving as a percentage of disposable personal income—was 4.6 percent in May.
- Current release: June 30, 2023
- Next release: July 28, 2023
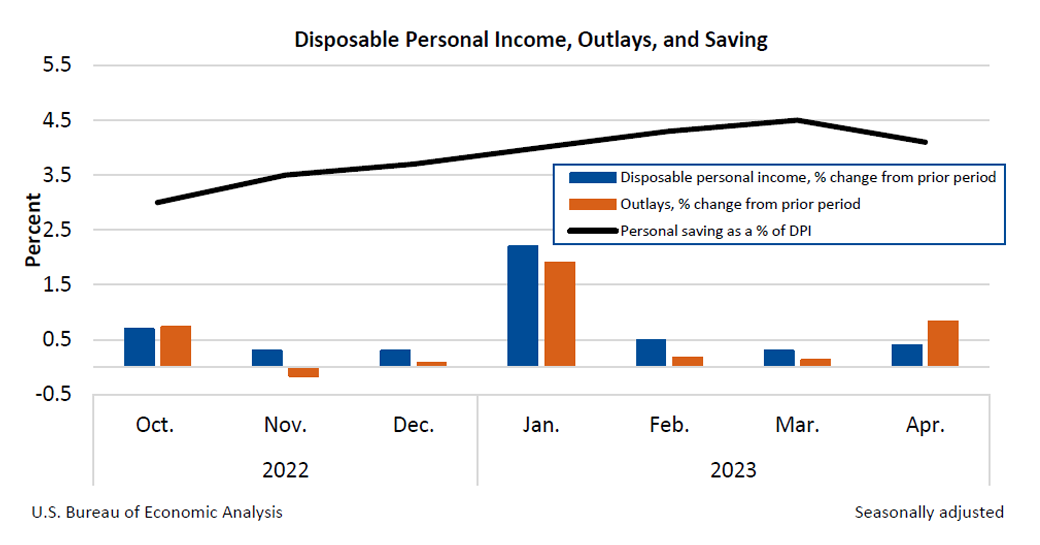
Personal Income and Outlays, April 2023
|
April 2023
|
+0.4%
|
|
March 2023
|
+0.3%
|
Personal income increased $80.1 billion (0.4 percent at a monthly rate) in April. Disposable personal income (DPI) increased $79.4 billion (0.4 percent). Personal outlays increased $156.0 billion (0.8 percent) and consumer spending increased $151.7 billion (0.8 percent). Personal saving was $802.1 billion and the personal saving rate—personal saving as a percentage of disposable personal income—was 4.1 percent in April.
- Current release: May 26, 2023
- Next release: June 30, 2023
Personal Income and Outlays, March 2023
|
March 2023
|
+0.3%
|
|
February 2023
|
+0.3%
|
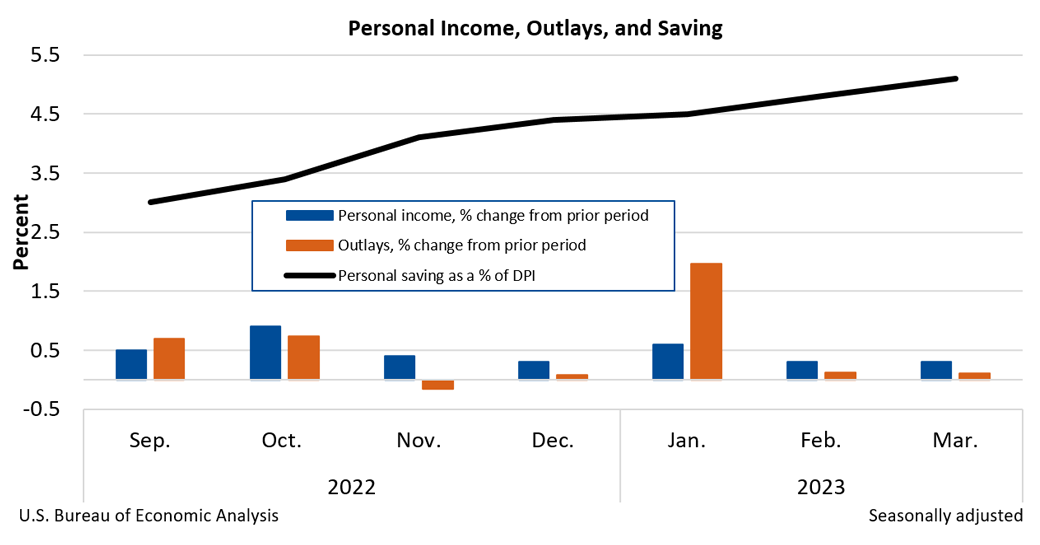
Personal income increased $67.9 billion, or 0.3 percent at a monthly rate, while consumer spending increased $8.2 billion, or less than 0.1 percent, in March. The personal saving rate (that is, personal saving as a percentage of disposable personal income) was 5.1 percent in March, compared with 4.8 percent in February.
- Current release: April 28, 2023
- Next release: May 26, 2023
Personal Income and Outlays, February 2023
|
February 2023
|
+0.3%
|
|
January 2023
|
+0.6%
|
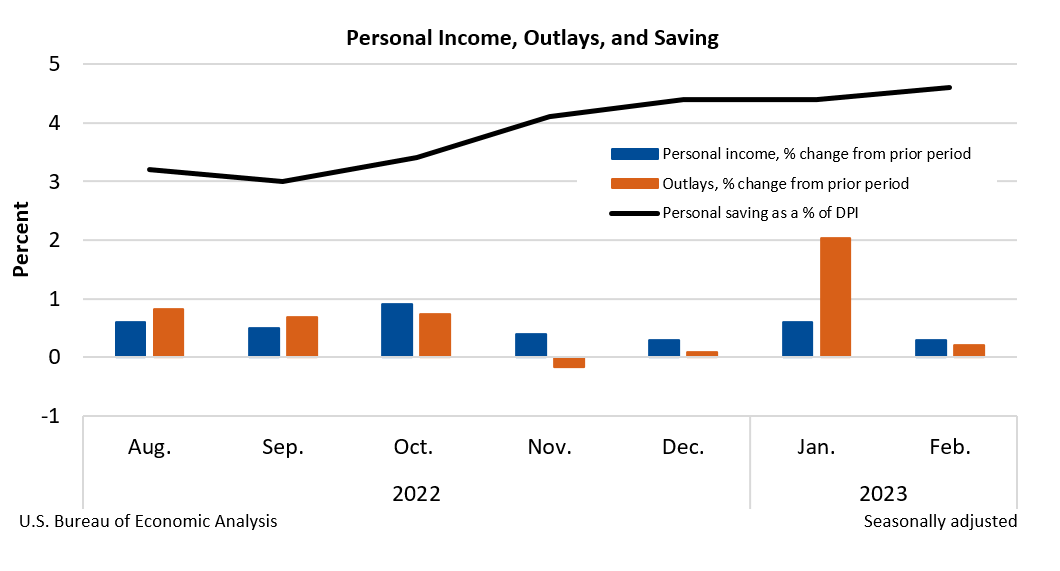
Personal income increased $72.9 billion, or 0.3 percent at a monthly rate, while consumer spending increased $27.9 billion, or 0.2 percent, in February. The increase in personal income primarily reflected an increase in compensation. The personal saving rate (that is, personal saving as a percentage of disposable personal income) was 4.6 percent in February, compared with 4.4 percent in January.
- Current release: March 31, 2023
- Next release: April 28, 2023
Personal Income and Outlays, January 2023
|
January 2023
|
+0.6%
|
|
December 2022
|
+0.3%
|
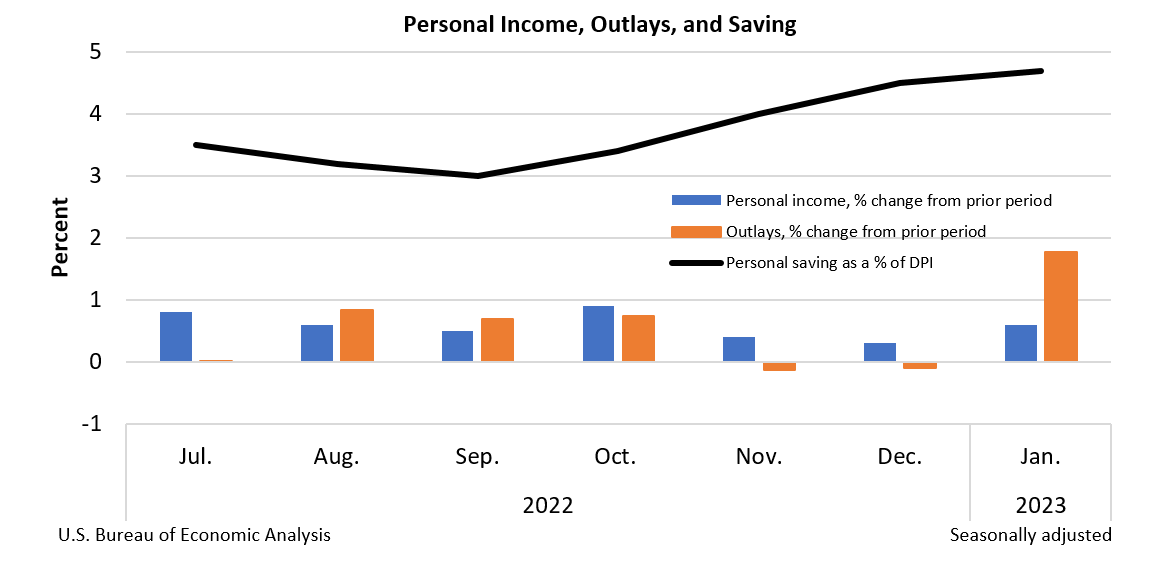
Personal income increased $131.1 billion, or 0.6 percent at a monthly rate, while consumer spending increased $312.5 billion, or 1.8 percent, in January. The increase in personal income primarily reflected an increase in compensation. Government social benefits decreased in January, reflecting a decrease in “other” benefits that was partly offset by an increase in Social Security. The personal saving rate (that is, personal saving as a percentage of disposable personal income) was 4.7 percent in January, compared with 4.5 percent in December.
- Current release: February 24, 2023
- Next release: March 31, 2023
Personal Income and Outlays, December 2022
|
December 2022
|
+0.2%
|
|
November 2022
|
+0.3%
|
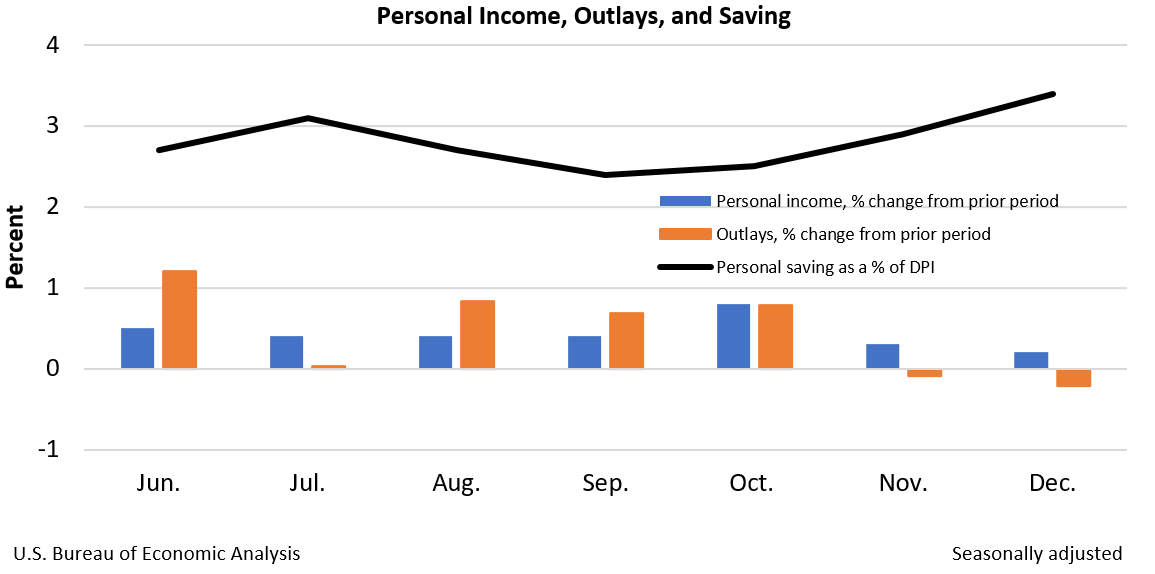
Personal income increased $49.5 billion, or 0.2 percent at a monthly rate, while consumer spending decreased $41.6 billion, or 0.2 percent, in December. The increase in personal income primarily reflected increases in compensation and proprietors’ income. The personal saving rate (that is, personal saving as a percentage of disposable personal income) was 3.4 percent in December, compared with 2.9 percent in November.
- Current release: January 27, 2023
- Next release: February 24, 2023
Personal Income and Outlays, November 2022
|
November 2022
|
+0.4%
|
|
October 2022
|
+0.7%
|
Personal income increased $80.1 billion, or 0.4 percent at a monthly rate, while consumer spending increased $19.8 billion, or 0.1 percent, in November. The increase in personal income primarily reflected increases in compensation and personal income receipts on assets. The personal saving rate (that is, personal saving as a percentage of disposable personal income) was 2.4 percent in November, compared with 2.2 percent in October.
- Current release: December 23, 2022
- Next release: January 27, 2023
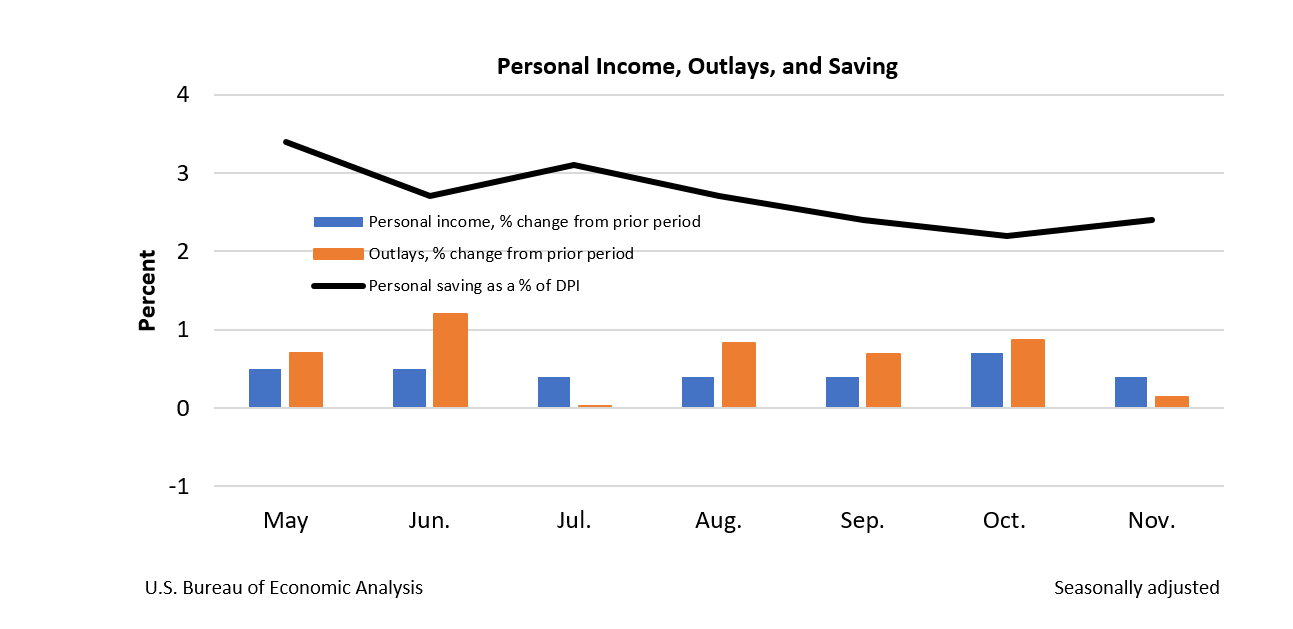
Personal Income and Outlays, October 2022
|
October 2022
|
+0.7%
|
|
September 2022
|
+0.4%
|
Personal income increased $155.3 billion, or 0.7 percent at a monthly rate, while consumer spending increased $147.9 billion, or 0.8 percent, in October. The increase in personal income primarily reflected increases in compensation and personal current transfer receipts. The personal saving rate (that is, personal saving as a percentage of disposable personal income) was 2.3 percent in October, compared with 2.4 percent in September.
- Current release: December 1, 2022
- Next release: December 23, 2022
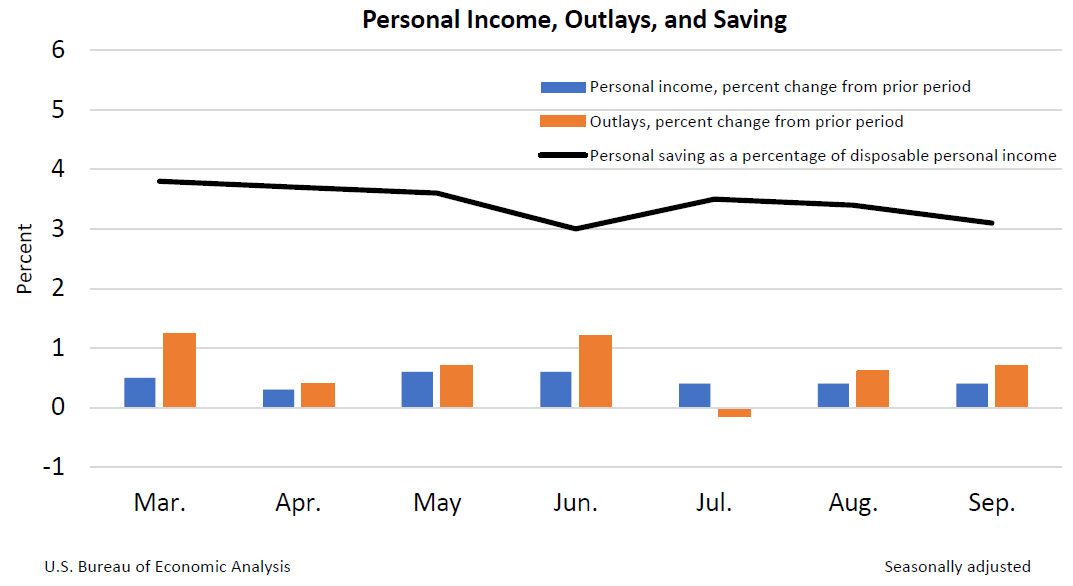
Personal Income and Outlays, September 2022
|
September 2022
|
+0.4%
|
|
August 2022
|
+0.4%
|
Personal income increased $78.9 billion, or 0.4 percent at a monthly rate, while consumer spending increased $113.0 billion, or 0.6 percent, in September. The increase in personal income primarily reflected increases in compensation and personal income receipts on assets. The personal saving rate (that is, personal saving as a percentage of disposable personal income) was 3.1 percent in September, compared with 3.4 percent in August.
- Current release: October 28, 2022
- Next release: December 1, 2022