
News Release
Outdoor Recreation Satellite Account, U.S. and Prototype for States, 2017
New prototype statistics show state value added, compensation, and employment
The U.S. outdoor recreation economy accounted for 2.2 percent ($427.2 billion) of current-dollar gross domestic product (GDP) in 2017 (national table 2) according to statistics released today by the Bureau of Economic Analysis. The Outdoor Recreation Satellite Account (ORSA) also shows that inflation-adjusted (real) GDP for the outdoor recreation economy grew by 3.9 percent in 2017, faster than the 2.4 percent growth of the overall U.S. economy. Real gross output, compensation, and employment all grew faster in outdoor recreation than for the economy as a whole.
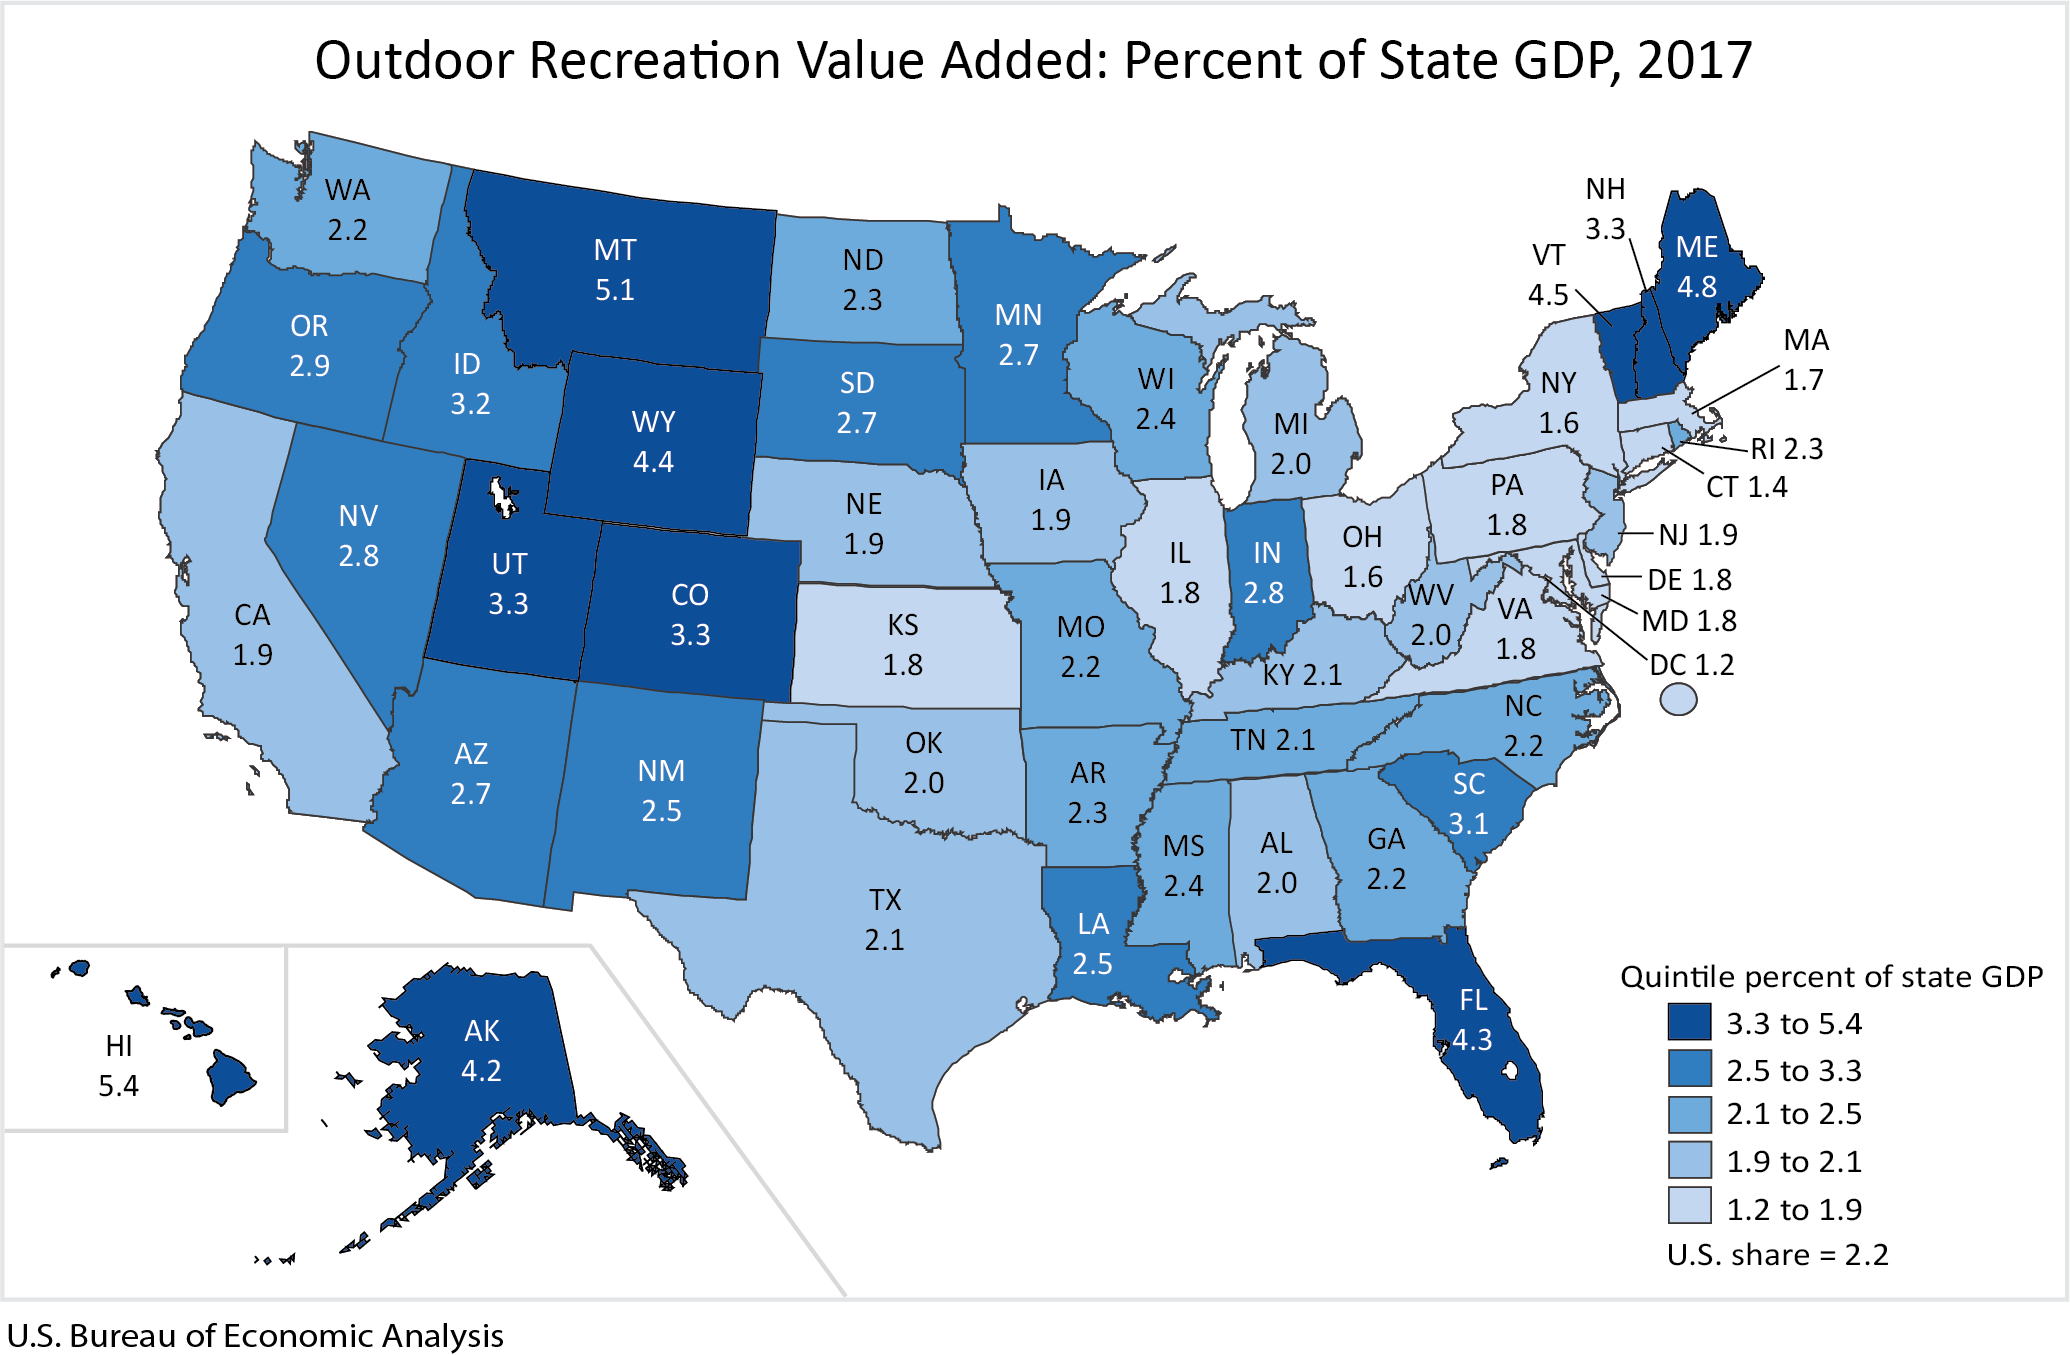
With this release, BEA introduces prototype statistics on outdoor recreation for all 50 states and the District of Columbia. These new statistics show that the relative size of the outdoor recreation economy ranged from 5.4 percent of GDP for Hawaii to 1.2 percent of GDP for the District of Columbia.
Outdoor Recreation by Activity
For the first time, ORSA includes information on the contribution of outdoor recreation activities to GDP. These data, referred to as value added by activity statistics, are available at both the national and state level.
Activities are grouped into three categories: conventional core activities (such as camping, hiking, boating, and hunting); other core activities (such as gardening and outdoor concerts); and supporting activities (such as construction, travel and tourism, local trips, and government expenditures).
Conventional outdoor recreation accounted for 30.6 percent of the outdoor recreation economy nationwide in 2017, other recreation accounted for 19.3 percent, and the remaining 50.1 percent was supporting activities (national table 2).
Other value added by activity highlights include the following:
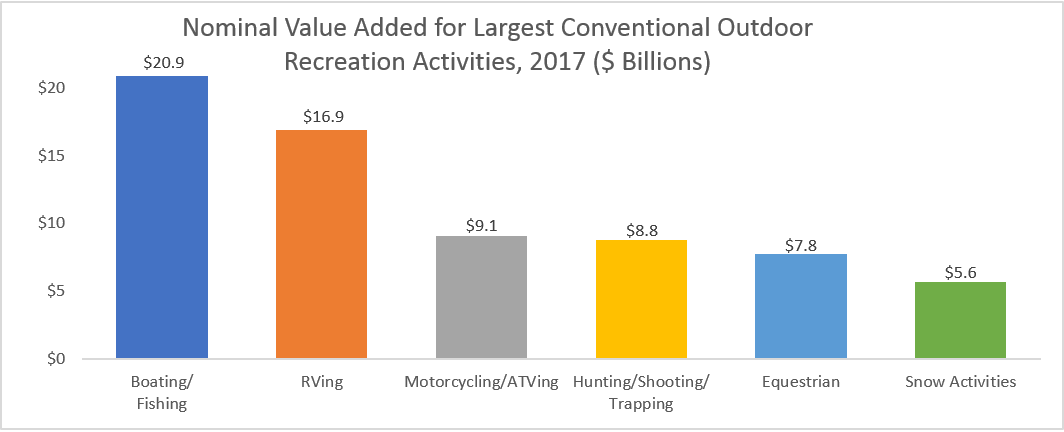
- Boating/fishing was the largest conventional activity for the nation as a whole at $20.9 billion in current-dollar value added. At the state level, this was the largest conventional activity in 29 states and the District of Columbia, led by Florida ($2.7 billion) and California ($1.8 billion).
- RVing was the second-largest conventional activity nationally with $16.9 billion in current-dollar value added. It was also the largest conventional activity in nine states, led by Indiana ($2.9 billion) and Ohio ($599.5 million).
- Snow activities was the sixth-largest conventional activity at the national level with $5.6 billion in current-dollar value added. At the state level, snow activities was the largest conventional activity in Colorado ($1.5 billion), Utah ($549.2 million), and Vermont ($175.9 million).
- Guided tours/outfitted travel, part of the other core activities category, accounted for $12.9 billion and was also one of the fastest growing activities in 2017, growing 11.4 percent.
Outdoor Recreation by Industry
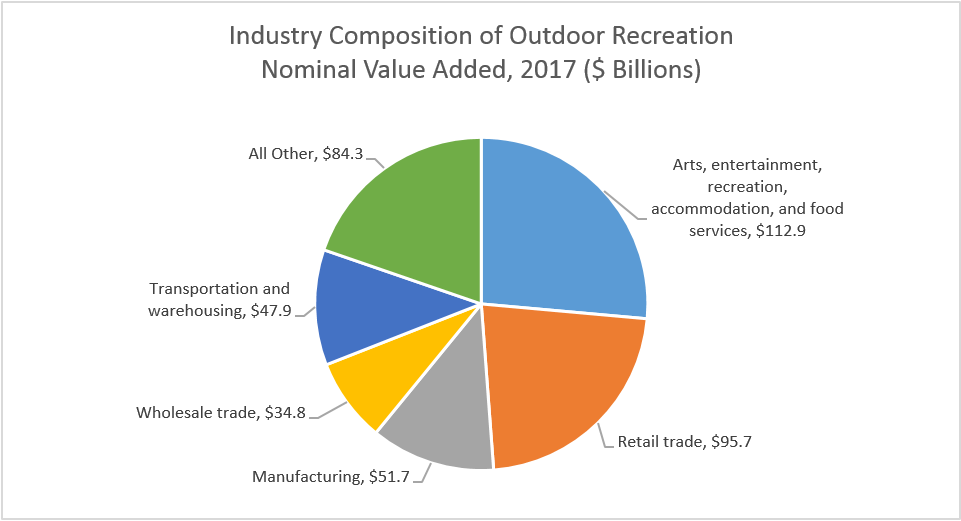
Today's data also show the role that different industries play in the outdoor recreation economy, including their impact on value added, gross output, employment, and compensation. The arts, entertainment, recreation, accommodation, and food services sector was the largest contributor to the U.S. outdoor recreation economy in 2017, accounting for $112.9 billion (national table 10). At the state level, this same sector was the largest contributor to outdoor recreation for 26 states and the District of Columbia.
Other value added by industry highlights include the following:
- Retail trade had the second largest sector contribution to outdoor recreation nationally, accounting for $95.7 billion of current-dollar value added. Retail trade was the largest contributor to outdoor recreation value added in 17 states, including Texas ($8.5 billion), Washington ($2.8 billion), and Ohio ($2.7 billion).
- Manufacturing contributed $51.7 billion nationally to the outdoor recreation economy in 2017 and was the third largest outdoor recreation sector. At the state level, manufacturing was the largest sector for outdoor recreation value added in Indiana ($4.7 billion), Wisconsin ($2.0 billion), Louisiana ($1.6 billion), and Kansas ($684.2 million).
Seeking Public Comment
The public is invited to submit comments on the prototype state statistics by emailing OutdoorRecreation@bea.gov. Comments are due by March 31, 2020. The feedback will be used to help finalize data sources and methodology for the state outdoor recreation statistics. Official state statistics are scheduled for release in the fall of 2020.
State Outdoor Recreation Satellite Account (ORSA) statistics isolate the economic activity associated with outdoor recreation spending and production in a state's economy. The state-level prototype statistics are an extension of the national industry ORSA statistics. The concepts, definitions, and methodology used to produce state-level prototype statistics are consistent with the national industry concepts, definitions, and methodology. The U.S. ORSA methodology paper provides more information about these concepts, definitions, and methodology.
Geography of outdoor recreation
Outdoor recreation is measured by place of production, not residence of consumer. The value of manufactured goods, such as boats, is assigned to the state where they are produced, even if the goods are not ultimately used there. Services, such as sailing lessons, are assigned to the location where they are consumed. The value of services provided by retailers, such as boat dealers, is also assigned to the location of sale. The services of retailers (known as trade margins) are not measured by sales but are most akin to sales less the cost of goods sold. The production of imported goods is excluded from ORSA, but the value of the services of retailers selling the imported goods is included.
Outdoor recreation spending and production are allocated to states by applying state-level data to detailed, underlying national values. The underlying estimates are distributed to states before aggregation to publication levels to provide the most accurate state values possible. Prototype statistics are primarily based on time-series data generated from the Economic Census and Quarterly Census of Employment and Wages (QCEW). Additional government and non-government data sources are used to supplement the census data and to refine and evaluate the statistics.
Regional tables Activity tables show states' total outdoor recreation value-added contributions to an activity, regardless of the contributing industry. For example, boating value added by state represents all contributions by in-state boat manufacturers, marinas, repair shops, etc., to the boating activity.
Industry tables show states' total outdoor recreation-related value added, employment, and compensation by industry, regardless of the outdoor activities the industries support. Outdoor recreation-related activity is included in the states' industry totals even if the final consumption occurs outside the state.
A state's total value added across all outdoor recreation activities will equal the state's total value added across all outdoor recreation industries.
Definitions
ORSA employment consists of all full-time, part-time, and temporary wage-and-salary jobs where the workers are engaged in the production of outdoor recreation goods and services. Self-employed individuals are excluded from employment totals.
ORSA compensation consists of the pay to employees (including wages and salaries, and benefits such as employer contributions to pension and health funds) in return for their outdoor recreation-related work during a given year. Pay to the self-employed is excluded from compensation but included in value added.
ORSA value added (also referred to as GDP) consists of the value of outdoor recreation goods and services produced less the value of expenses incurred for their production. The activity of self-employed individuals is included in value added.