
News Release
U.S. International Trade in Goods and Services, March 2020
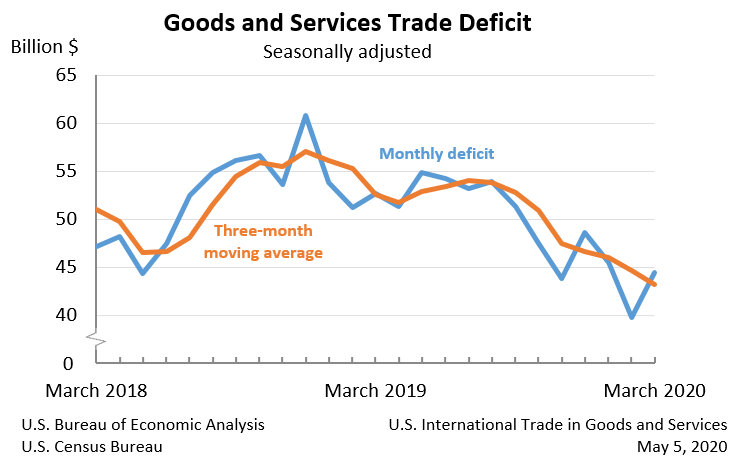
The U.S. Census Bureau and the U.S. Bureau of Economic Analysis announced today that the goods and services deficit was $44.4 billion in March, up $4.6 billion from $39.8 billion in February, revised.
| Deficit: | $44.4 Billion | +11.6%° |
| Exports: | $187.7 Billion | -9.6%° |
| Imports: | $232.2 Billion | -6.2%° |
|
Next release: June 4, 2020 (°) Statistical significance is not applicable or not measurable. Data adjusted for seasonality but not price changes Source: U.S. Census Bureau, U.S. Bureau of Economic Analysis; U.S. International Trade in Goods and Services, May 5, 2020 |
||
The declines in March exports and imports were, in part, due to the impact of COVID-19, as many businesses were operating at limited capacity or ceased operations completely, and the movement of travelers across borders was restricted. The full economic effects of the COVID-19 pandemic cannot be quantified in the trade statistics for March because the impacts are generally embedded in source data and cannot be separately identified. The Census Bureau and the Bureau of Economic Analysis have monitored data quality and determined estimates in this release meet publication standards. For more information on the compilation of this month’s report, see www.census.gov/foreign-trade/statistics/notices/COVIDFAQSFT900.pdf for goods or www.bea.gov/help/faq/1412 for services.
Exports, Imports, and Balance (exhibit 1)
March exports were $187.7 billion, $20.0 billion less than February exports. March imports were $232.2 billion, $15.4 billion less than February imports.
The March increase in the goods and services deficit reflected an increase in the goods deficit of $4.6 billion to $65.6 billion and a decrease in the services surplus of $0.1 billion to $21.2 billion.
Year-to-date, the goods and services deficit decreased $28.1 billion, or 17.8 percent, from the same period in 2019. Exports decreased $21.7 billion or 3.5 percent. Imports decreased $49.7 billion or 6.4 percent.
Three-Month Moving Averages (exhibit 2)
The average goods and services deficit decreased $1.4 billion to $43.2 billion for the three months ending in March.
- Average exports decreased $7.2 billion to $201.3 billion in March.
- Average imports decreased $8.6 billion to $244.5 billion in March.
Year-over-year, the average goods and services deficit decreased $9.4 billion from the three months ending in March 2019.
- Average exports decreased $7.2 billion from March 2019.
- Average imports decreased $16.6 billion from March 2019.
Exports (exhibits 3, 6, and 7)
Exports of goods decreased $9.2 billion to $128.1 billion in March.
Exports of goods on a Census basis decreased $8.8 billion.
- Industrial supplies and materials decreased $2.9 billion.
- Crude oil decreased $1.0 billion.
- Other petroleum products decreased $0.9 billion.
- Fuel oil decreased $0.4 billion.
- Automotive vehicles, parts, and engines decreased $2.5 billion.
- Automotive parts and accessories decreased $0.9 billion.
- Passenger cars decreased $0.8 billion.
- Trucks, buses, and special purpose vehicles decreased $0.4 billion.
- Capital goods decreased $2.0 billion.
- Other industrial machinery decreased $0.4 billion.
- Civilian aircraft parts decreased $0.4 billion.
- Civilian aircraft decreased $0.2 billion.
- Civilian aircraft engines decreased $0.2 billion.
Net balance of payments adjustments decreased $0.4 billion.
Exports of services decreased $10.8 billion to $59.6 billion in March.
- Travel decreased $7.5 billion.
- Transport decreased $2.6 billion.
Imports (exhibits 4, 6, and 8)
Imports of goods decreased $4.7 billion to $193.7 billion in March.
Imports of goods on a Census basis decreased $4.2 billion.
- Consumer goods decreased $4.0 billion.
- Cell phones and other household goods decreased $2.5 billion.
- Gem diamonds decreased $0.9 billion.
- Automotive vehicles, parts, and engines decreased $2.7 billion.
- Automotive parts and accessories decreased $1.5 billion.
- Passenger cars decreased $0.5 billion.
- Capital goods increased $1.5 billion.
- Computers increased $0.8 billion.
- Semiconductors increased $0.8 billion.
Net balance of payments adjustments decreased $0.5 billion.
Imports of services decreased $10.7 billion to $38.5 billion in March.
- Travel decreased $7.7 billion.
- Transport decreased $2.9 billion.
Real Goods in 2012 Dollars – Census Basis (exhibit 11)
The real goods deficit increased $6.5 billion to $75.3 billion in March.
- Real exports of goods decreased $7.7 billion to $143.0 billion.
- Real imports of goods decreased $1.2 billion to $218.3 billion.
Revisions
Revisions to February exports
- Exports of goods were revised up $0.1 billion.
- Exports of services were revised up $0.1 billion.
Revisions to February imports
- Imports of goods were revised down less than $0.1 billion.
- Imports of services were revised up $0.1 billion.
Goods by Selected Countries and Areas: Monthly – Census Basis (exhibit 19)
The March figures show surpluses, in billions of dollars, with South and Central America ($5.0), Hong Kong ($1.9), OPEC ($1.5), Brazil ($1.4), Saudi Arabia ($0.3), and United Kingdom ($0.1). Deficits were recorded, in billions of dollars, with European Union ($16.9), China ($15.5), Mexico ($9.0), Germany ($6.0), Japan ($4.6), Italy ($2.8), Canada ($2.6), Taiwan ($2.0), South Korea ($1.9), India ($1.7), France ($0.7), and Singapore (less than $0.1).
- The deficit with the European Union increased $4.3 billion to $16.9 billion in March. Exports decreased $0.6 billion to $21.8 billion and imports increased $3.7 billion to $38.7 billion.
- The surplus with the United Kingdom decreased $1.2 billion to $0.1 billion in March. Exports decreased $1.3 billion to $4.9 billion and imports decreased less than $0.1 billion to $4.8 billion.
- The deficit with China decreased $4.2 billion to $15.5 billion in March. Exports increased $0.3 billion to $7.8 billion and imports decreased $3.9 billion to $23.3 billion.
* * *
All statistics referenced are seasonally adjusted; statistics are on a balance of payments basis unless otherwise specified. Additional statistics, including not seasonally adjusted statistics and details for goods on a Census basis, are available in exhibits 1-20b of this release. For information on data sources, definitions, and revision procedures, see the explanatory notes in this release. The full release can be found at www.census.gov/foreign-trade/Press-Release/current_press_release/index.html or www.bea.gov/data/intl-trade-investment/international-trade-goods-and-services. The full schedule is available in the Census Bureau’s Economic Briefing Room at www.census.gov/economic-indicators/ or on BEA’s website at www.bea.gov/news/schedule.
* * *
Next release: June 4, 2020, at 8:30 A.M. EDT
U.S. International Trade in Goods and Services, April 2020
* * *
Upcoming Updates to Goods and Services
With the releases of the “U.S. International Trade in Goods and Services, April 2020” report (FT-900) and the FT-900 Annual Revision on June 4, 2020, statistics on trade in goods on both a Census basis and a balance of payments (BOP) basis will be revised beginning with 2015, and statistics on trade in services will be revised beginning with 1999. The revised statistics for goods on a BOP basis and for services will also be included in the “U.S. International Transactions, First Quarter 2020 and Annual Update” report and in the international transactions interactive database, both to be released by the U.S. Bureau of Economic Analysis (BEA) on June 19, 2020.
Revised statistics on trade in goods will reflect:
- Corrections and adjustments to previously published not seasonally adjusted statistics for goods on a Census basis.
- Reclassifications of several end-use commodities.
- Recalculated seasonal and trading-day adjustments.
- Newly available and revised source data on BOP adjustments, which are adjustments that BEA applies to goods on a Census basis to convert them to a BOP basis. See the “Goods (balance of payments basis)” section in the explanatory notes for more information.
Revised statistics on trade in services will reflect:
- Reclassifications of transactions between current services categories and new services categories (see below).
- Improved estimation methods for several services categories.
- Newly available and revised source data, primarily from BEA surveys, including the results of BEA’s benchmark survey of selected services and intellectual property transactions.
- Recalculated seasonal adjustments.
- Revised temporal distributions of quarterly source data to monthly statistics. See the “Services” section in the explanatory notes for more information.
To further align BEA statistics with international guidelines, such as the sixth edition of the Balance of Payments and International Investment Position Manual published by the International Monetary Fund, exhibits 3 and 4 will be expanded to include two new major services categories: construction and personal, cultural, and recreational services. Prototypes of modified exhibits 3 and 4 are available at www.bea.gov/sites/default/files/2020-04/prototype-exhibits-3-4.xlsx. In addition, some transactions will be reclassified between charges for the use of intellectual property n.i.e. (not included elsewhere), other business services, maintenance and repair services n.i.e., and the new categories construction and personal, cultural, and recreational services. For more information on these changes, see “Preview of the 2020 Annual Update of the International Economic Accounts.”
If you have questions or need additional information, please contact the U.S. Census Bureau, Economic Indicators Division, International Trade Macro Analysis Branch, on (800) 549-0595, option 4, or at eid.international.trade.data@census.gov; or BEA, Balance of Payments Division, at InternationalAccounts@bea.gov.