
News Release
Gross Domestic Product by State, 2nd Quarter 2021
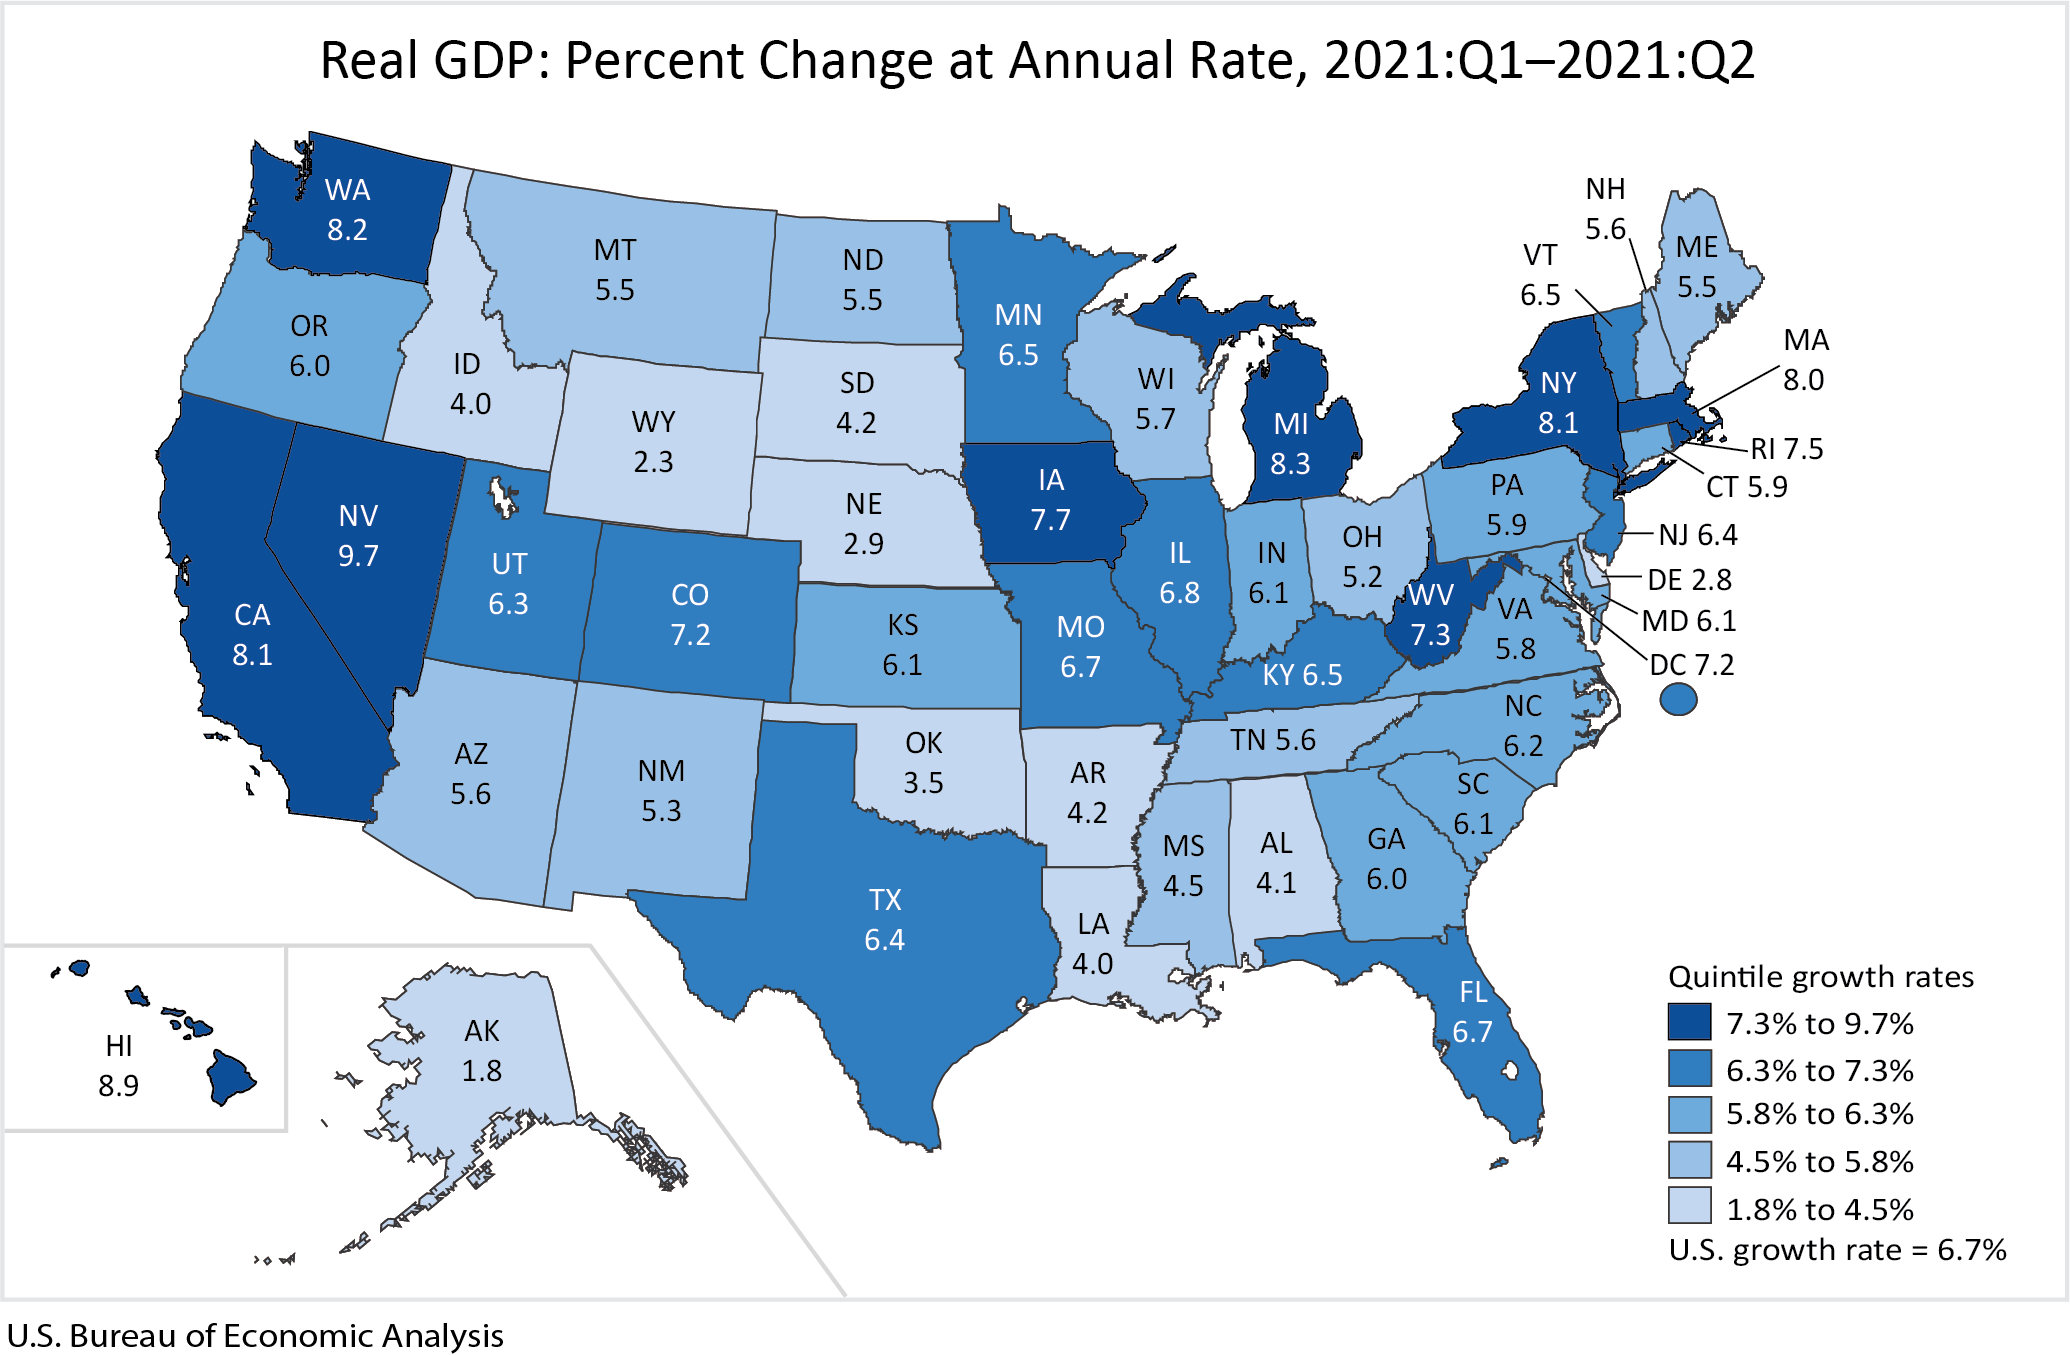
Nevada had the largest increase in the second quarter
Real gross domestic product (GDP) increased in all 50 states and the District of Columbia in the second quarter of 2021, as real GDP for the nation increased at an annual rate of 6.7 percent, according to statistics released today by the U.S. Bureau of Economic Analysis. The percent change in real GDP in the second quarter ranged from 9.7 percent in Nevada to 1.8 percent in Alaska (table 1).
The increase in second quarter GDP by state estimates reflected the continued economic recovery, reopening of establishments, and continued government response related to the COVID-19 pandemic. In the second quarter, government assistance payments in the form of loans to businesses and grants to state and local governments increased, while social benefits to households, such as the direct economic impact payments, declined. The full economic effects of the COVID-19 pandemic cannot be quantified in the GDP by state estimates because the impacts are generally embedded in source data and cannot be separately identified.
Accommodation and food services; information; and professional, scientific, and technical services were the leading contributors to the increase in real GDP nationally (table 2). Accommodation and food services increased 88.7 percent nationally and contributed to the increases in all 50 states and the District of Columbia. The industry was the leading contributor to the increase in Nevada and Hawaii.
Other highlights
- The information industry increased 25.2 percent nationally and contributed to the increases in all 50 states and the District of Columbia. This industry was the leading contributor to the increase in Washington, California, and New York, the states with the fourth, fifth, and sixth largest increases, respectively.
- Professional, scientific, and technical services increased 15.3 percent nationally and contributed to the increases in all 50 states and the District of Columbia.
- The increases in all states and the District of Columbia were partly offset by retail trade, which decreased 14.7 percent nationally. This industry moderated increases in real GDP in in all 50 states and the District of Columbia.
The estimates for the second quarter of 2021 incorporate the results of BEA's annual update of GDP by state that was also released today. The annual estimates of GDP by state for 1997 to 2020, and quarterly estimates of GDP by state for the first quarter of 2005 through the first quarter of 2021 were revised (table 4). The update incorporates new and revised source data that are more complete and more detailed than previously available, updates to seasonal factors, and the results of the July 2021 annual update of the National Income and Product Accounts and the September 2021 annual update of the GDP by Industry statistics. The November 2021 issue of the Survey of Current Business will contain an article describing the results.
Next release: December 23, 2021, at 10:00 A.M. EST
Gross Domestic Product by State, 3rd Quarter 2021