
News Release
Arts and Cultural Production Satellite Account, U.S. and States, 2021
New statistics for 2021; 2017—2020 updated
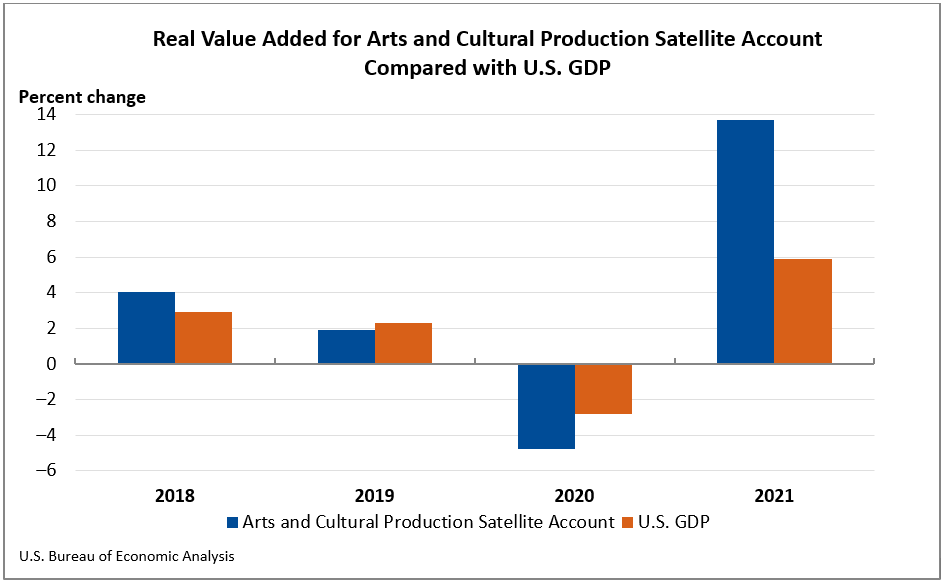
The Arts and Cultural Production Satellite Account released today by the Bureau of Economic Analysis (BEA) shows that arts and cultural economic activity, adjusted for inflation, increased 13.7 percent in 2021 after decreasing 4.8 percent in 2020 (table 1). By comparison, the broader economy, as measured by real gross domestic product (GDP), increased 5.9 percent in 2021 after decreasing 2.8 percent in 2020. Arts and cultural economic activity accounted for 4.4 percent of gross domestic product (GDP), or $1.02 trillion, in 2021 (tables 2 and 3).
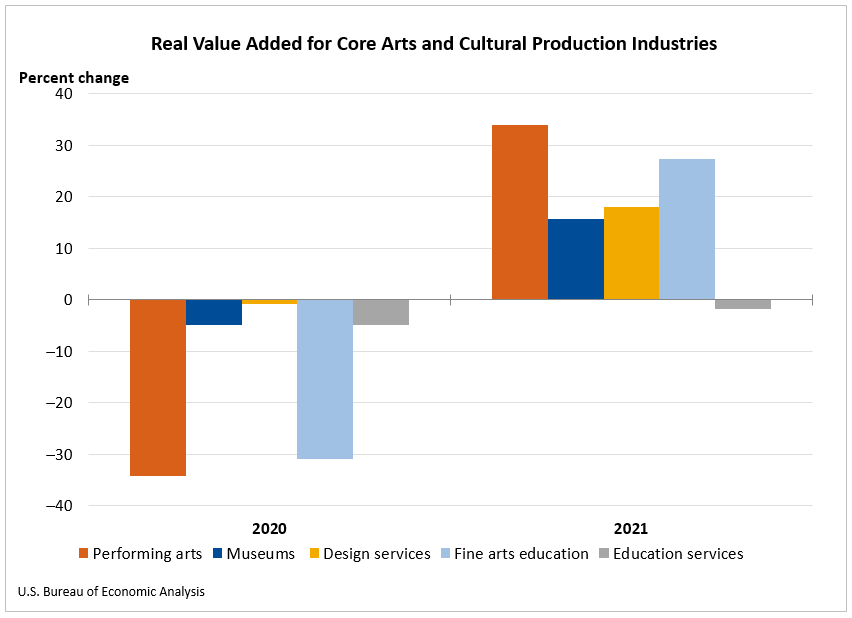
Real (inflation adjusted) value added for core arts and cultural production industries, which include performing arts, museums, design services, fine arts education, and education services, increased 22.4 percent in 2021. Supporting arts and cultural production industries, which include art support services and information services, increased 11.6 percent in 2021 (table 1).
- Performing arts increased 33.9 percent in 2021 after decreasing 34.3 percent in 2020. The leading contributor to the increase was promoters of performing arts and similar events, which increased 122.4 percent in 2021 after decreasing 54.5 percent in 2020.
- Museums increased 15.6 percent in 2021 after decreasing 5.0 percent in 2020.
- Design services increased 18.1 percent in 2021 after decreasing 0.8 percent in 2020.
- Fine arts education increased 27.4 percent in 2021 after decreasing 30.9 percent in 2020.
- Education services decreased 1.7 percent in 2021 after decreasing 4.9 percent in 2020.
Nominal value added
Nominal value added (not adjusted for inflation) increased 14.4 percent nationally in 2021 (table 2). The leading contributor to the increase was supporting arts and cultural production industries (table 4). Supporting arts and cultural production industries increased 12.8 percent, to a level of $778.4 billion; the leading contributor to the increase was information services. Core arts and cultural industries increased 20.8 percent in 2021, to a level of $214.3 billion; the leading contributors to the increase were performing arts and design services.
In 2021, nominal value added in arts and cultural industries increased in every state and the District of Columbia. The percent change in value added in arts and cultural industries across all states ranged from 23.2 percent in Tennessee to 3.2 percent in Arkansas (table 2).
In Tennessee, the state with the largest increase in value added, sound recording, publishing, and independent artists, writers, and performers industries were the leading contributors to the increase in value added (table 4). In Arkansas, the state with the smallest increase in value added, a decrease in construction mitigated the increase.
For states and the District of Columbia, the arts and cultural share of their total GDP ranged from 10.8 percent in Washington to 1.2 percent in Delaware (table 3). The share for most states ranged between 2 and 5 percent. Washington, the District of Columbia, California, and New York were the only areas where the arts and cultural share of total GDP exceeded 5 percent.
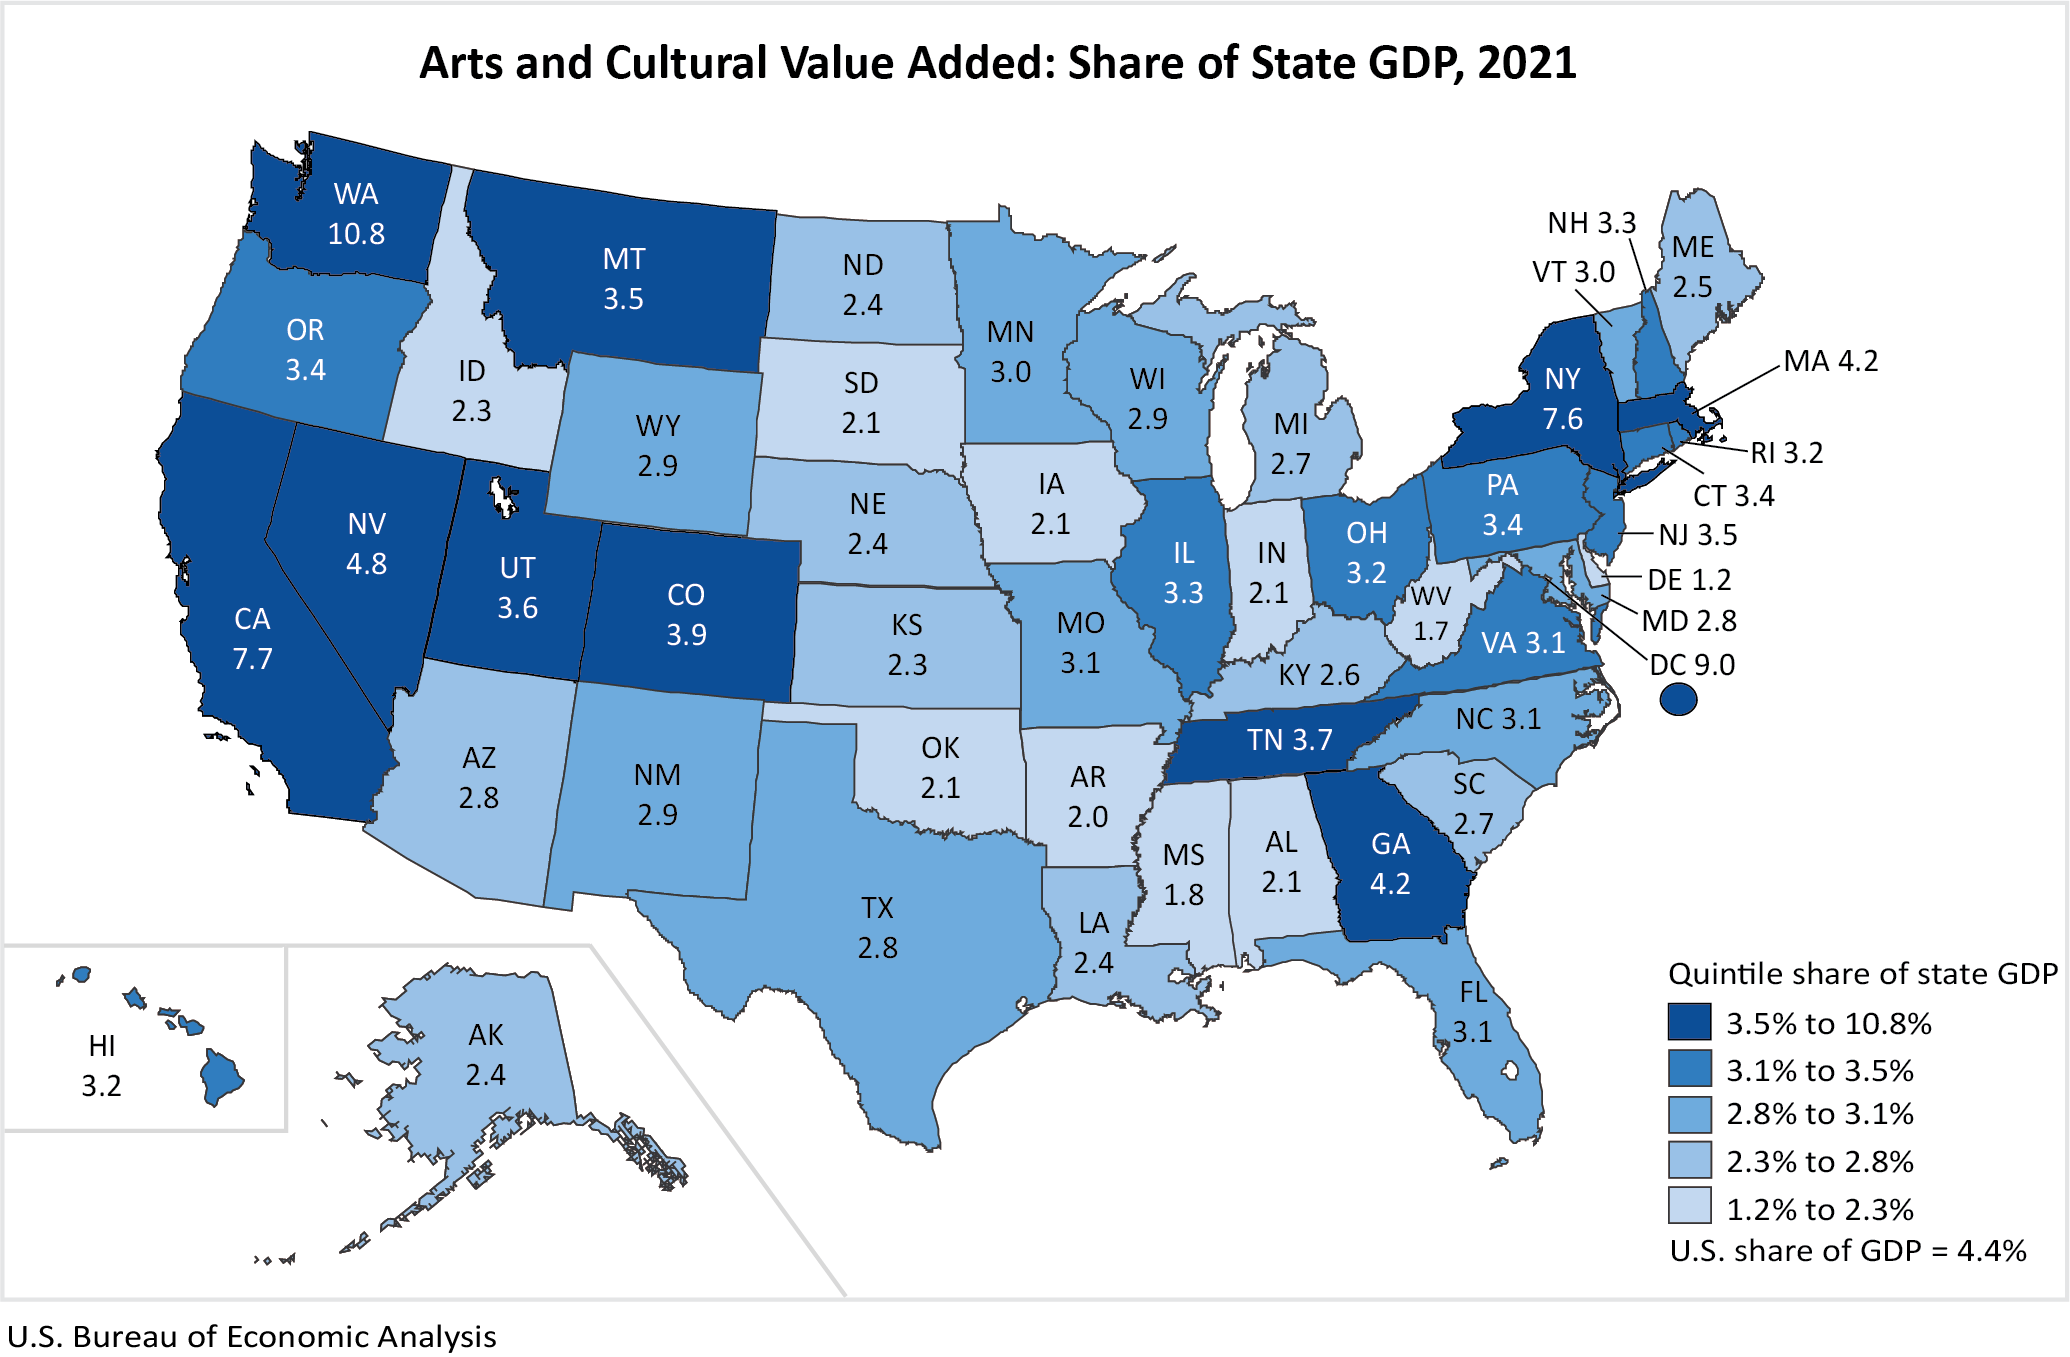
The top arts and cultural industries varied among the states. In Washington, publishing and other information services were the leading contributors to the share of total state GDP (table 3). Government and broadcasting were the leading contributors to the share of GDP in the District of Columbia, while other information services and motion pictures were the leading contributors to the share of GDP in California. Broadcasting and other information services were the leading contributors to the share of GDP in New York.
Employment
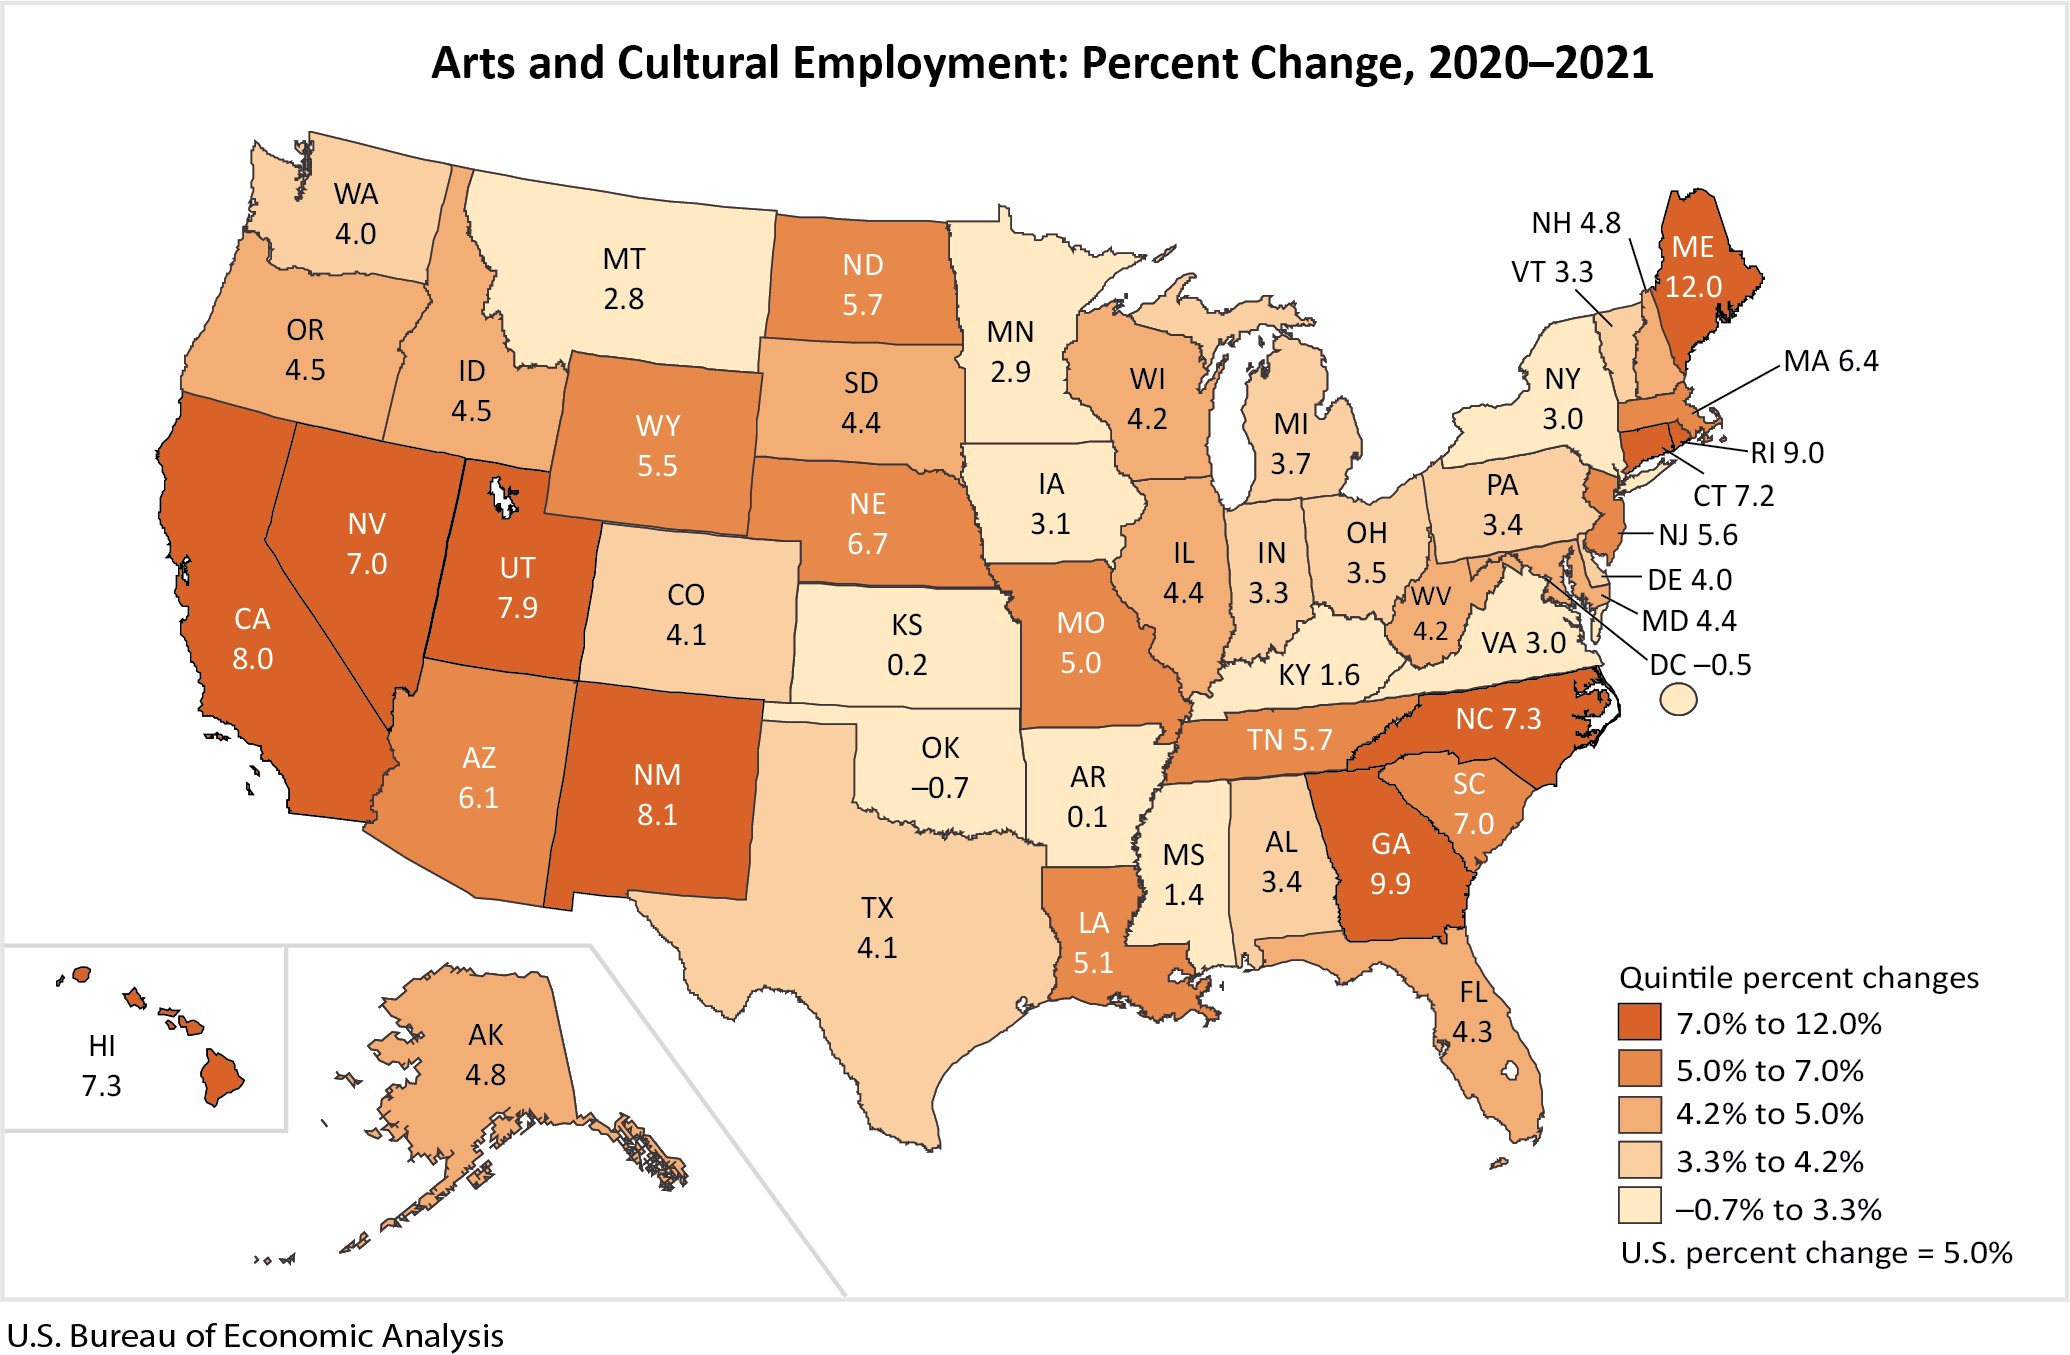
Arts and cultural employment nationwide increased 5.0 percent in 2021 (table 8). The total number of arts and cultural jobs for the nation was 4.9 million. Arts and cultural employment increased in 49 states. The percent change in arts and cultural employment across all states ranged from 12.0 percent in Maine to –0.7 percent in Oklahoma.
Maine had 16,743 jobs related to arts and culture, representing 2.6 percent of all jobs in the state. Construction and retail industries were the leading contributors to the increase in arts and cultural employment in Maine (table 9). In Oklahoma, construction was the leading contributor to the decrease in arts and cultural employment.
Compensation
Arts and cultural compensation nationwide increased 11.3 percent in 2021 (table 8). Arts and cultural compensation increased in all 50 states and the District of Columbia. The percent change in arts and cultural compensation across all states ranged from 18.9 percent in Georgia to 0.5 percent in Arkansas.
Update of arts and cultural production statistics
Today, BEA also released updated national-level arts and cultural production statistics on output, value added, intermediate inputs, employment, and compensation from 2017 to 2020, with new statistics for 2021, and updated state-level statistics on value added, employment, and compensation from 2017 to 2020, with new statistics for 2021. These revised and newly available statistics primarily reflect the incorporation of revised and newly available source data from the 2022 annual updates of BEA’s National and Regional Economic Accounts. Combined with new and revised arts and cultural production-specific source data, these improvements allow the arts and cultural production statistics to capture the dynamics of this sector more accurately.
BEA’s Arts and Cultural Production Satellite Account is supported by funding from the National Endowment for the Arts.
Next release: March 2024
Arts and Cultural Production Satellite Account, U.S. and States, 2022