
News Release
U.S. International Transactions and Investment Position, 4th Quarter and Year 2025
Fourth Quarter
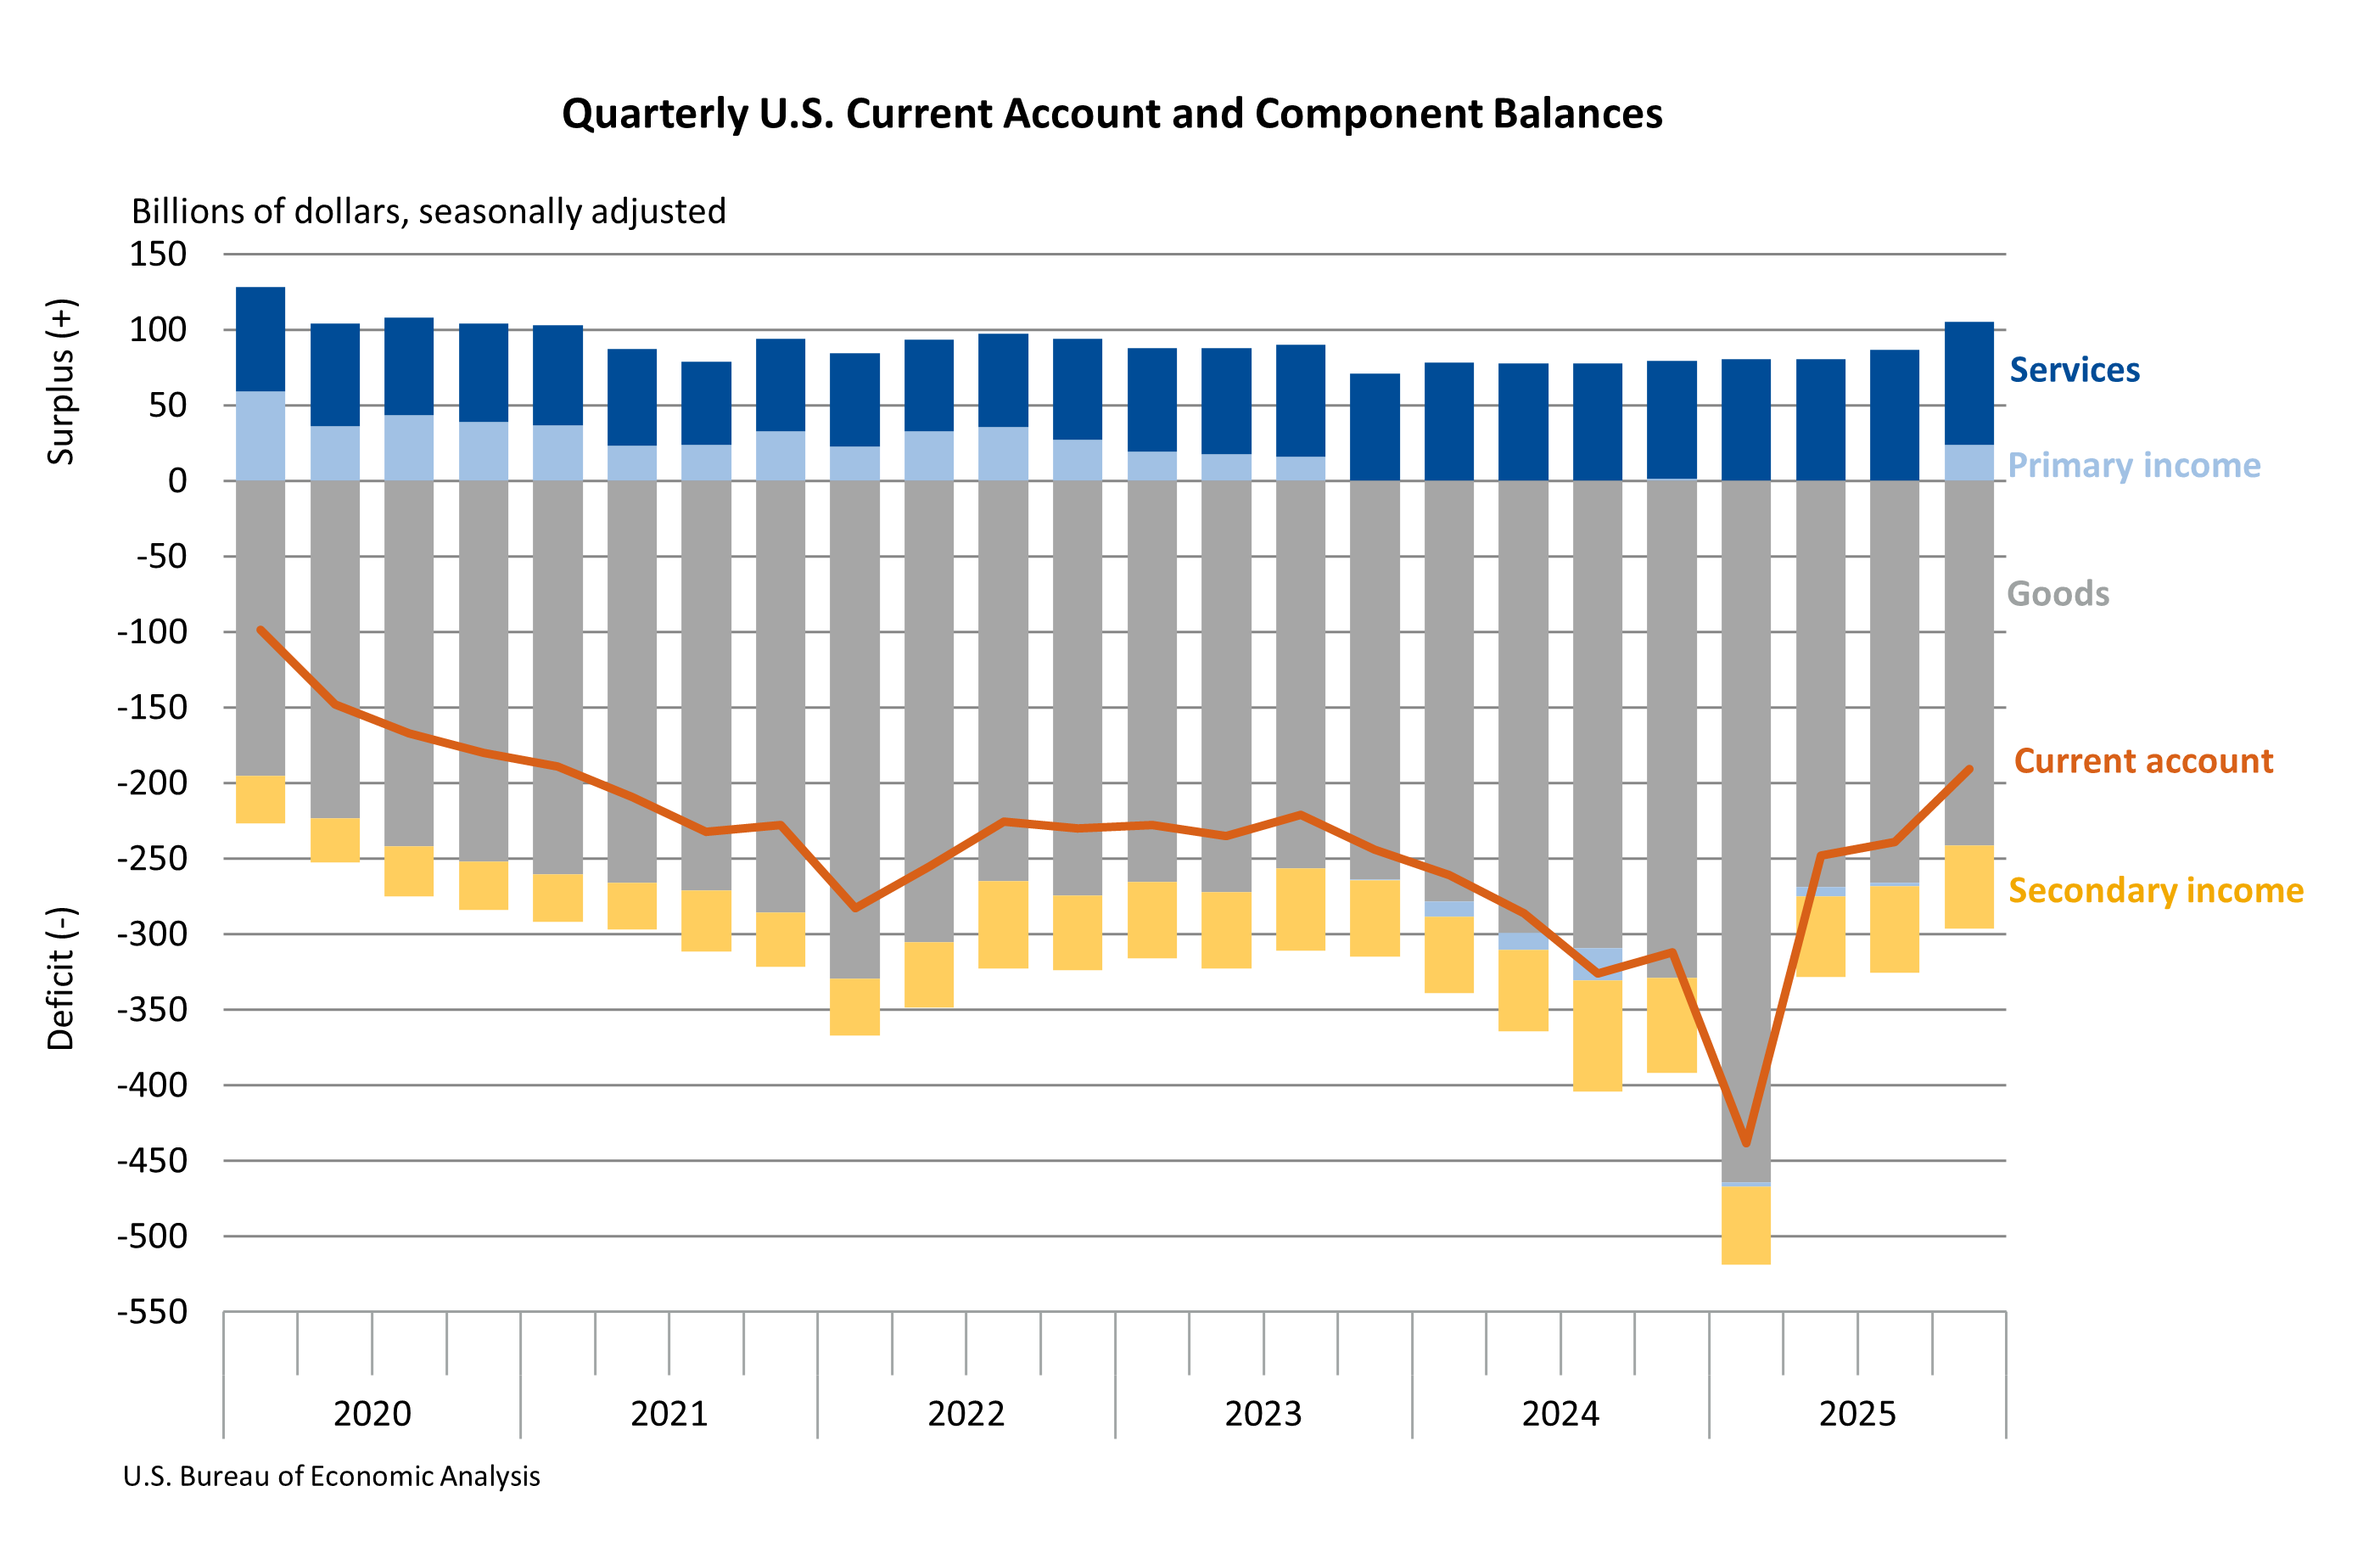
The U.S. current-account deficit resulting from international economic transactions narrowed by $48.4 billion, or 20.2 percent, to $190.7 billion in the fourth quarter of 2025, according to statistics released today by the U.S. Bureau of Economic Analysis. The revised third-quarter deficit was $239.1 billion.
The fourth-quarter deficit was 2.4 percent of current-dollar gross domestic product (GDP), down from 3.1 percent in the third quarter.
The $48.4 billion narrowing of the current-account deficit in the fourth quarter reflected a shift in the balance on primary income from a deficit in the third quarter to a surplus in the fourth quarter and a reduced deficit on goods.
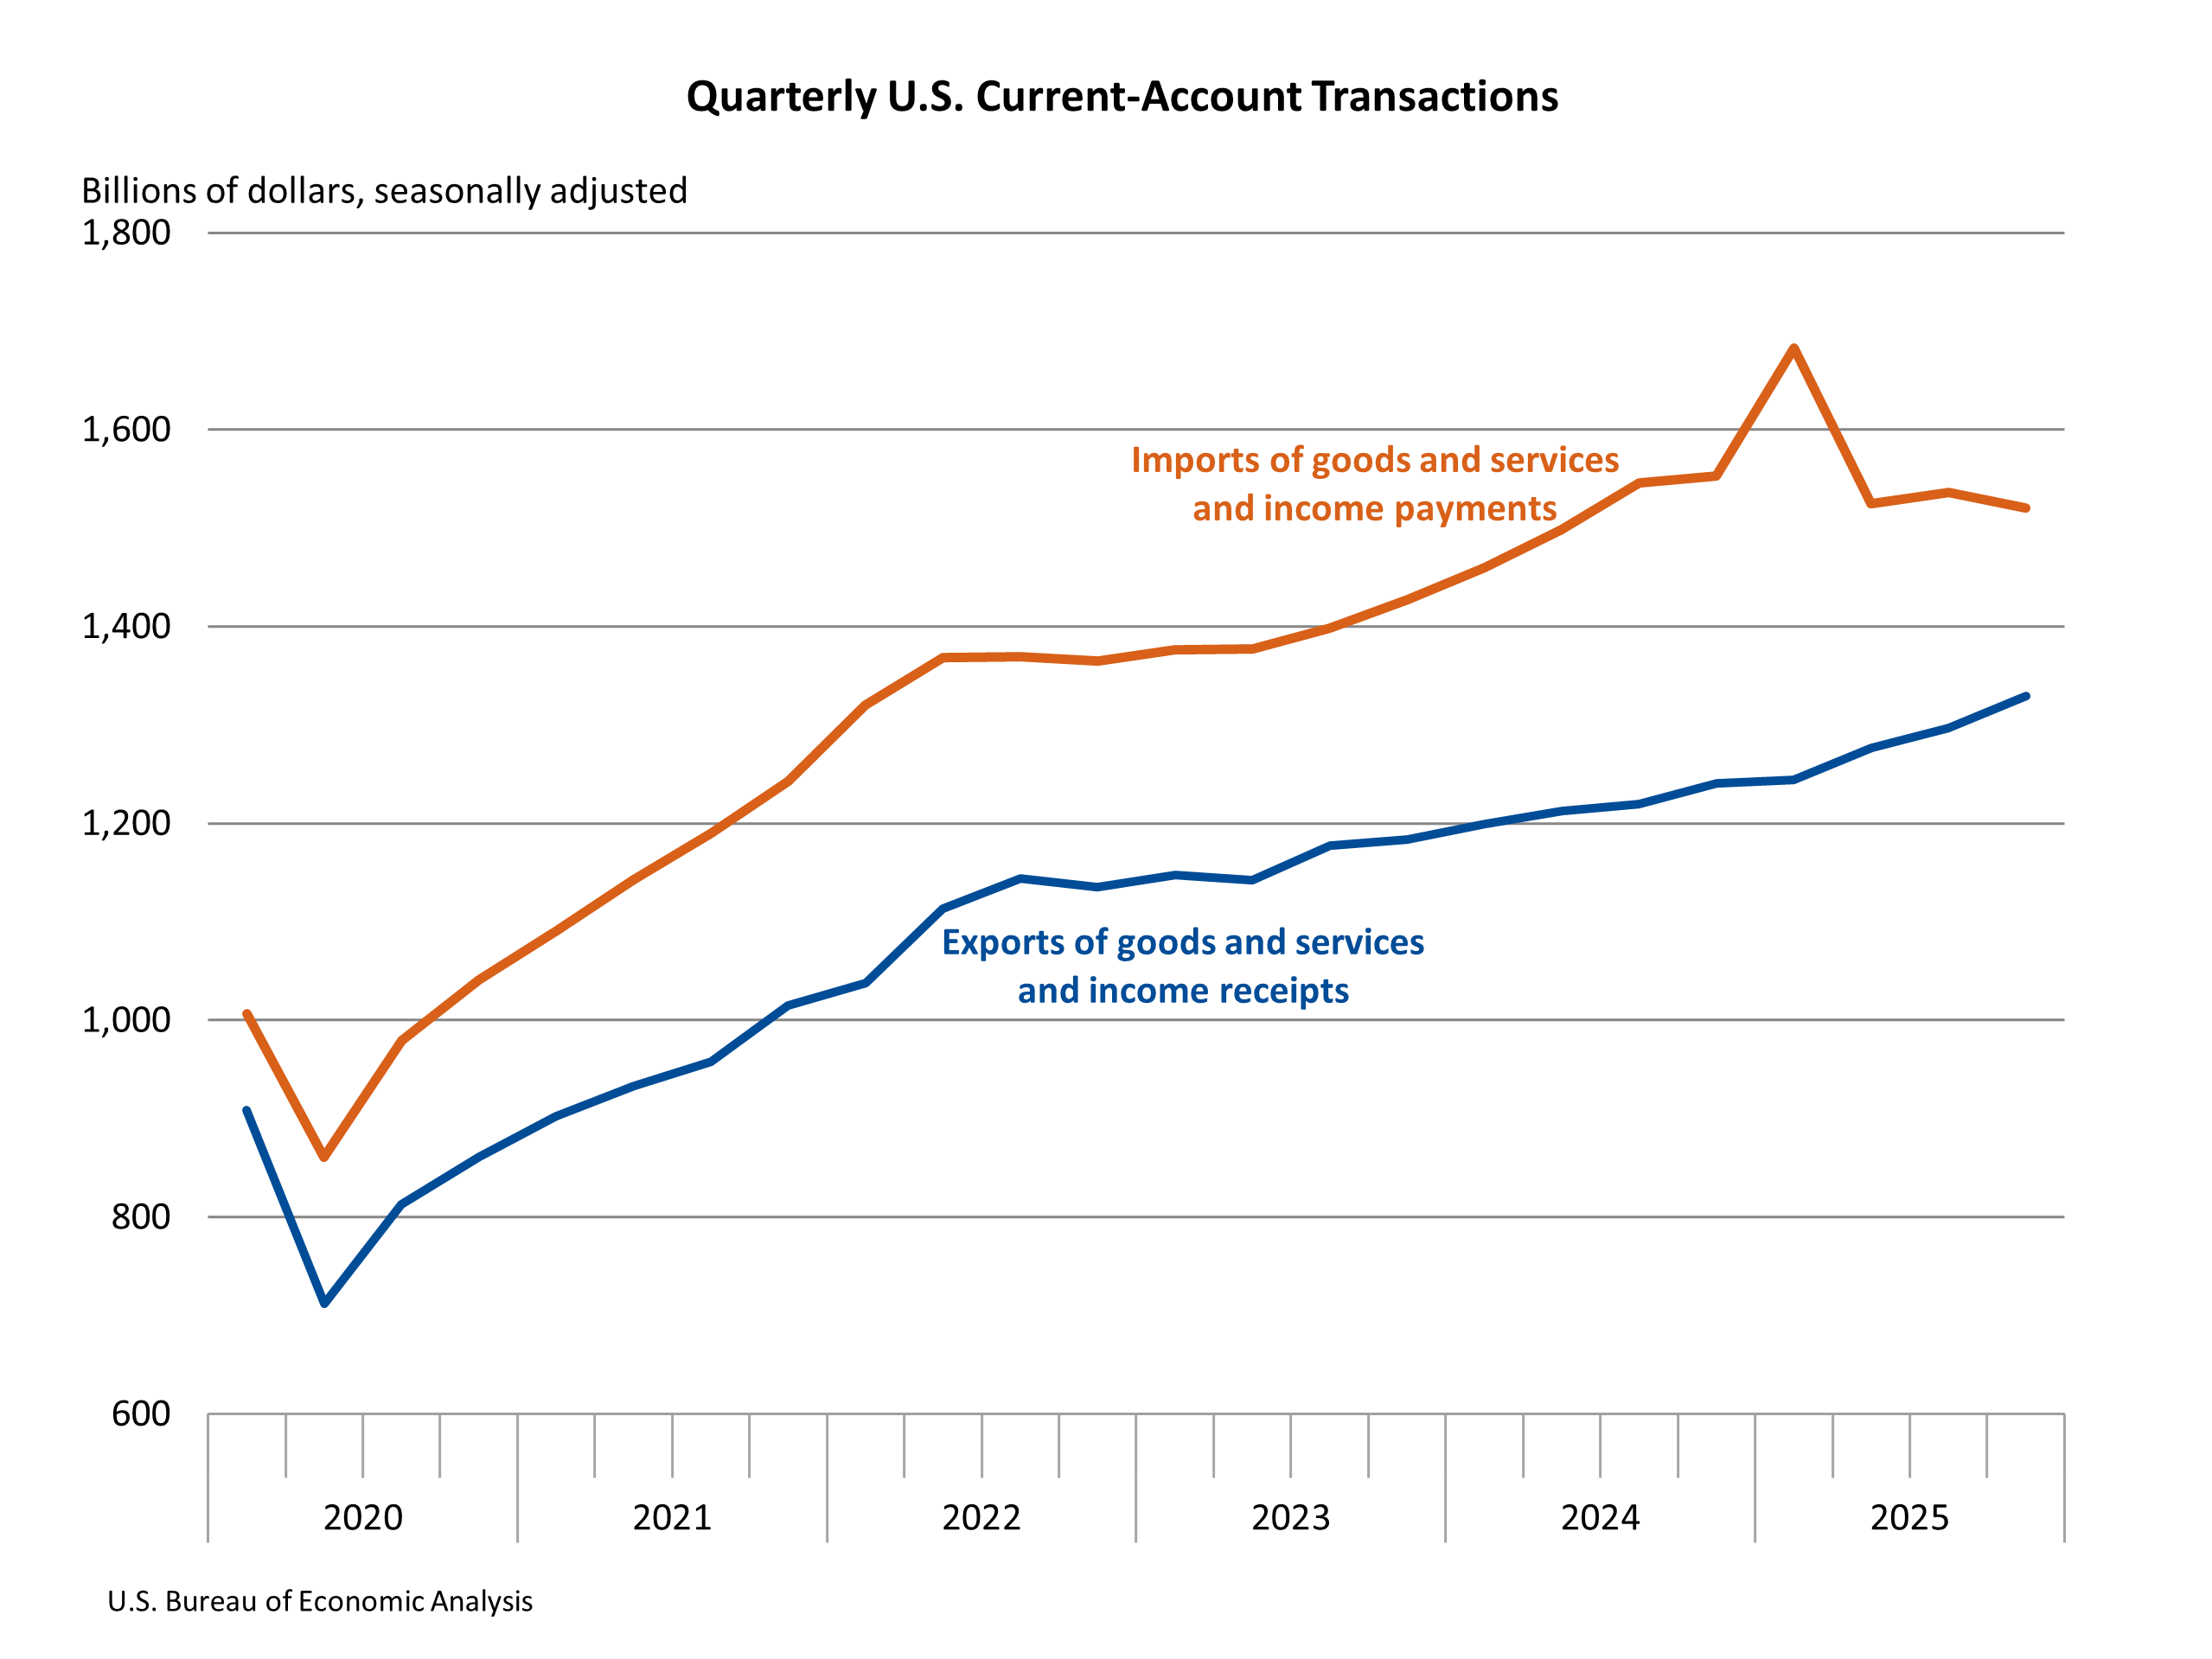
Exports of goods and services to, and income received from, foreign residents increased $32.4 billion to $1.33 trillion in the fourth quarter, reflecting increases in goods exports and in primary (earned) income receipts.
Imports of goods and services from, and income paid to, foreign residents decreased $16.0 billion to $1.52 trillion, reflecting decreases in primary (earned) income payments and in goods imports.
Capital-transfer receipts decreased $80 million to $101 million in the fourth quarter. Capital-transfer payments increased $1.8 billion to $3.0 billion.
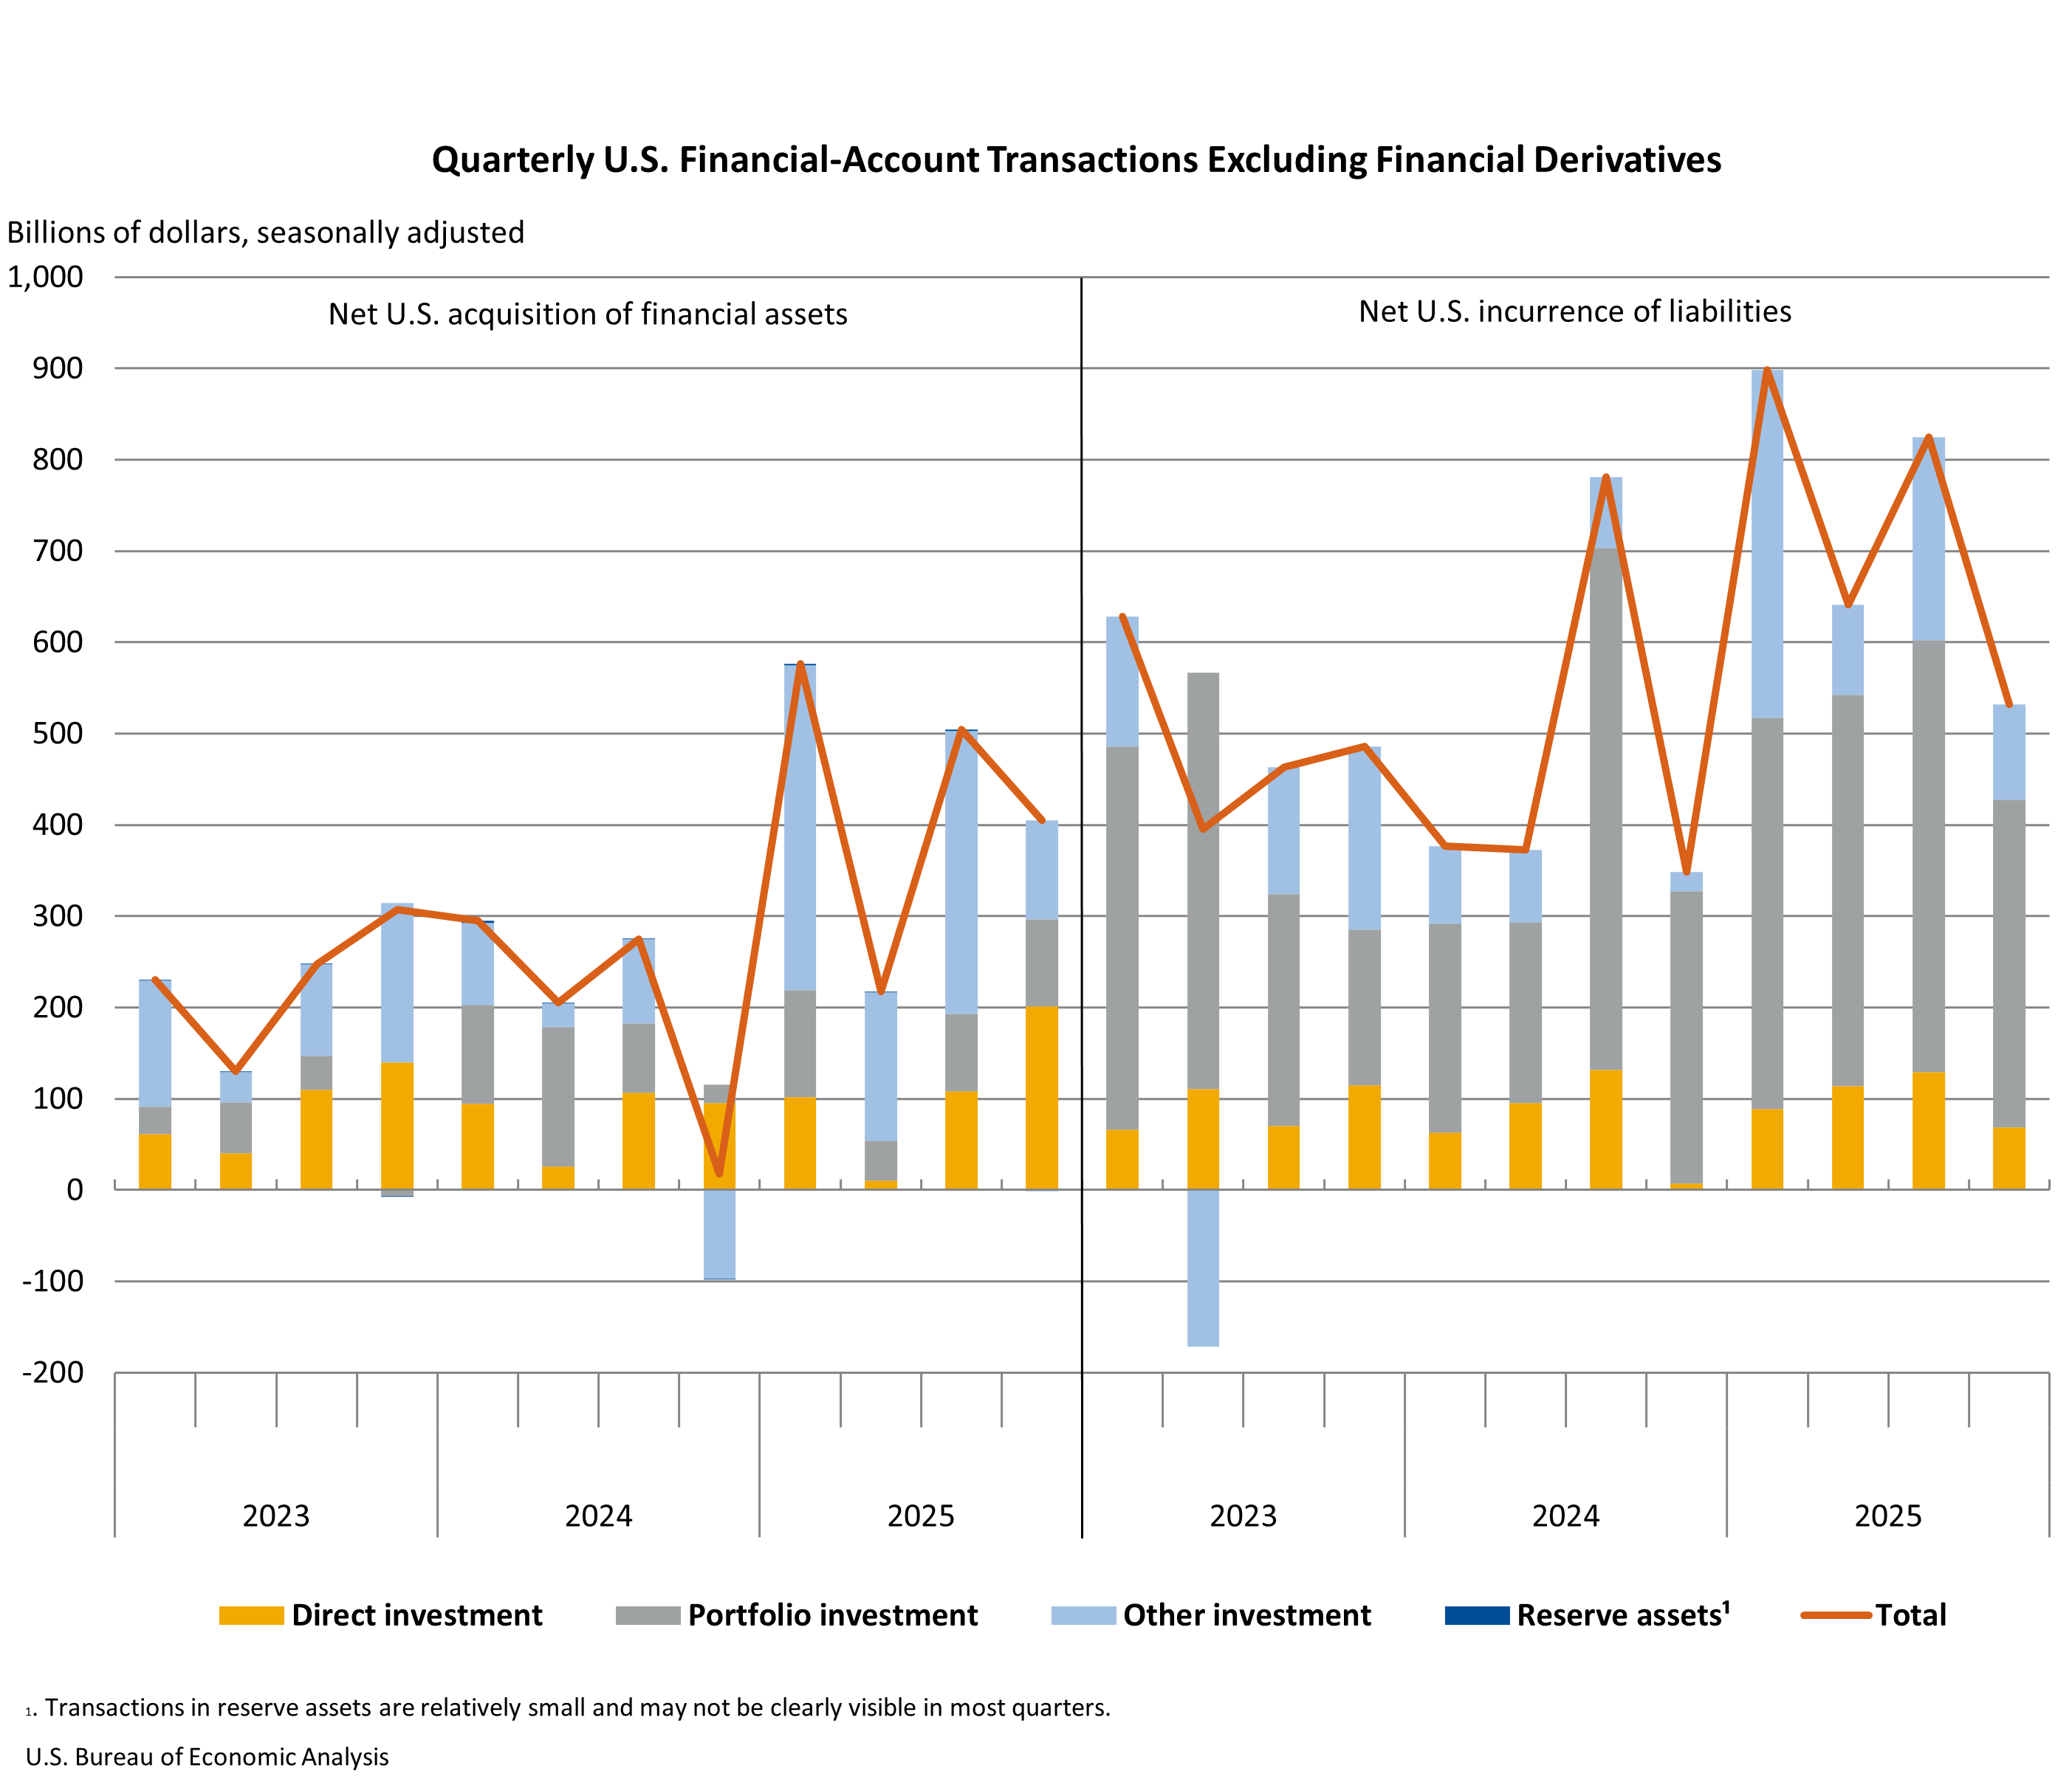
Net financial-account transactions were –$135.9 billion in the fourth quarter, reflecting net U.S. borrowing from foreign residents.1 Fourth-quarter transactions increased U.S. residents’ foreign financial assets by $405.0 billion and increased U.S. liabilities to foreign residents by $532.0 billion.
The U.S. net international investment position, the difference between U.S. residents’ foreign financial assets and liabilities, was –$27.54 trillion at the end of the fourth quarter of 2025. Assets totaled $42.96 trillion, and liabilities totaled $70.49 trillion. At the end of the third quarter of 2025, the net investment position was –$27.55 trillion (revised).
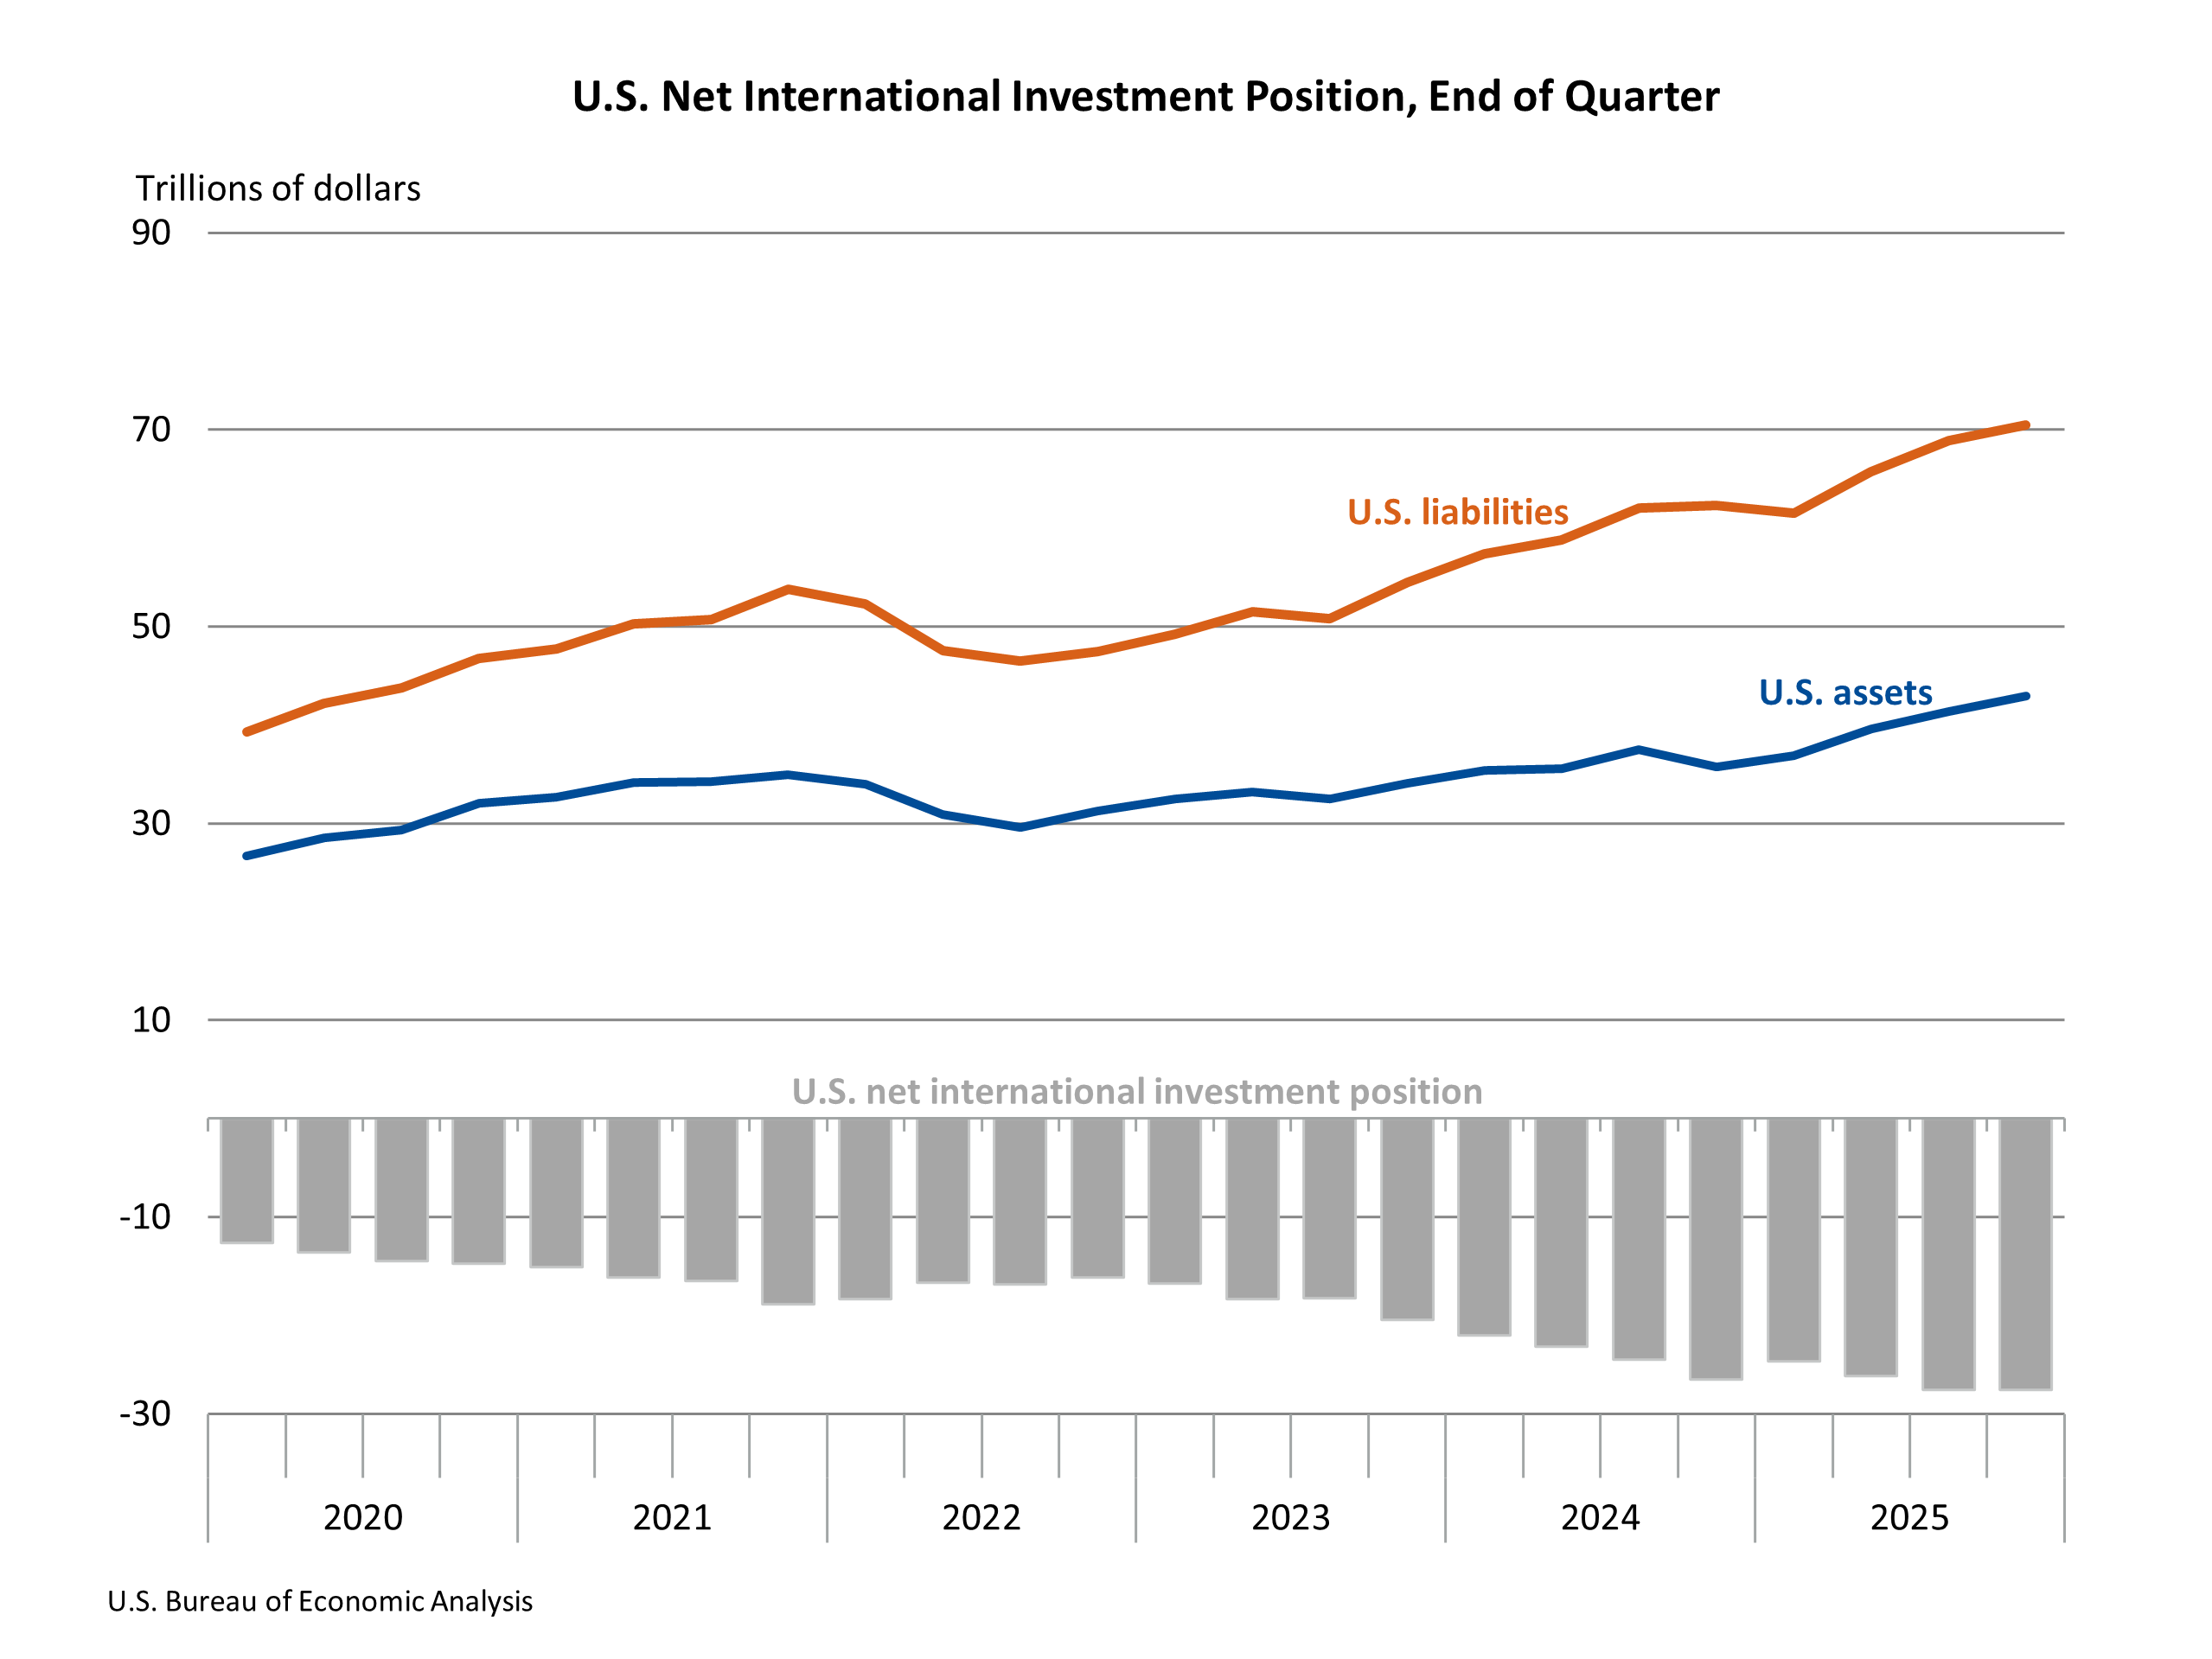
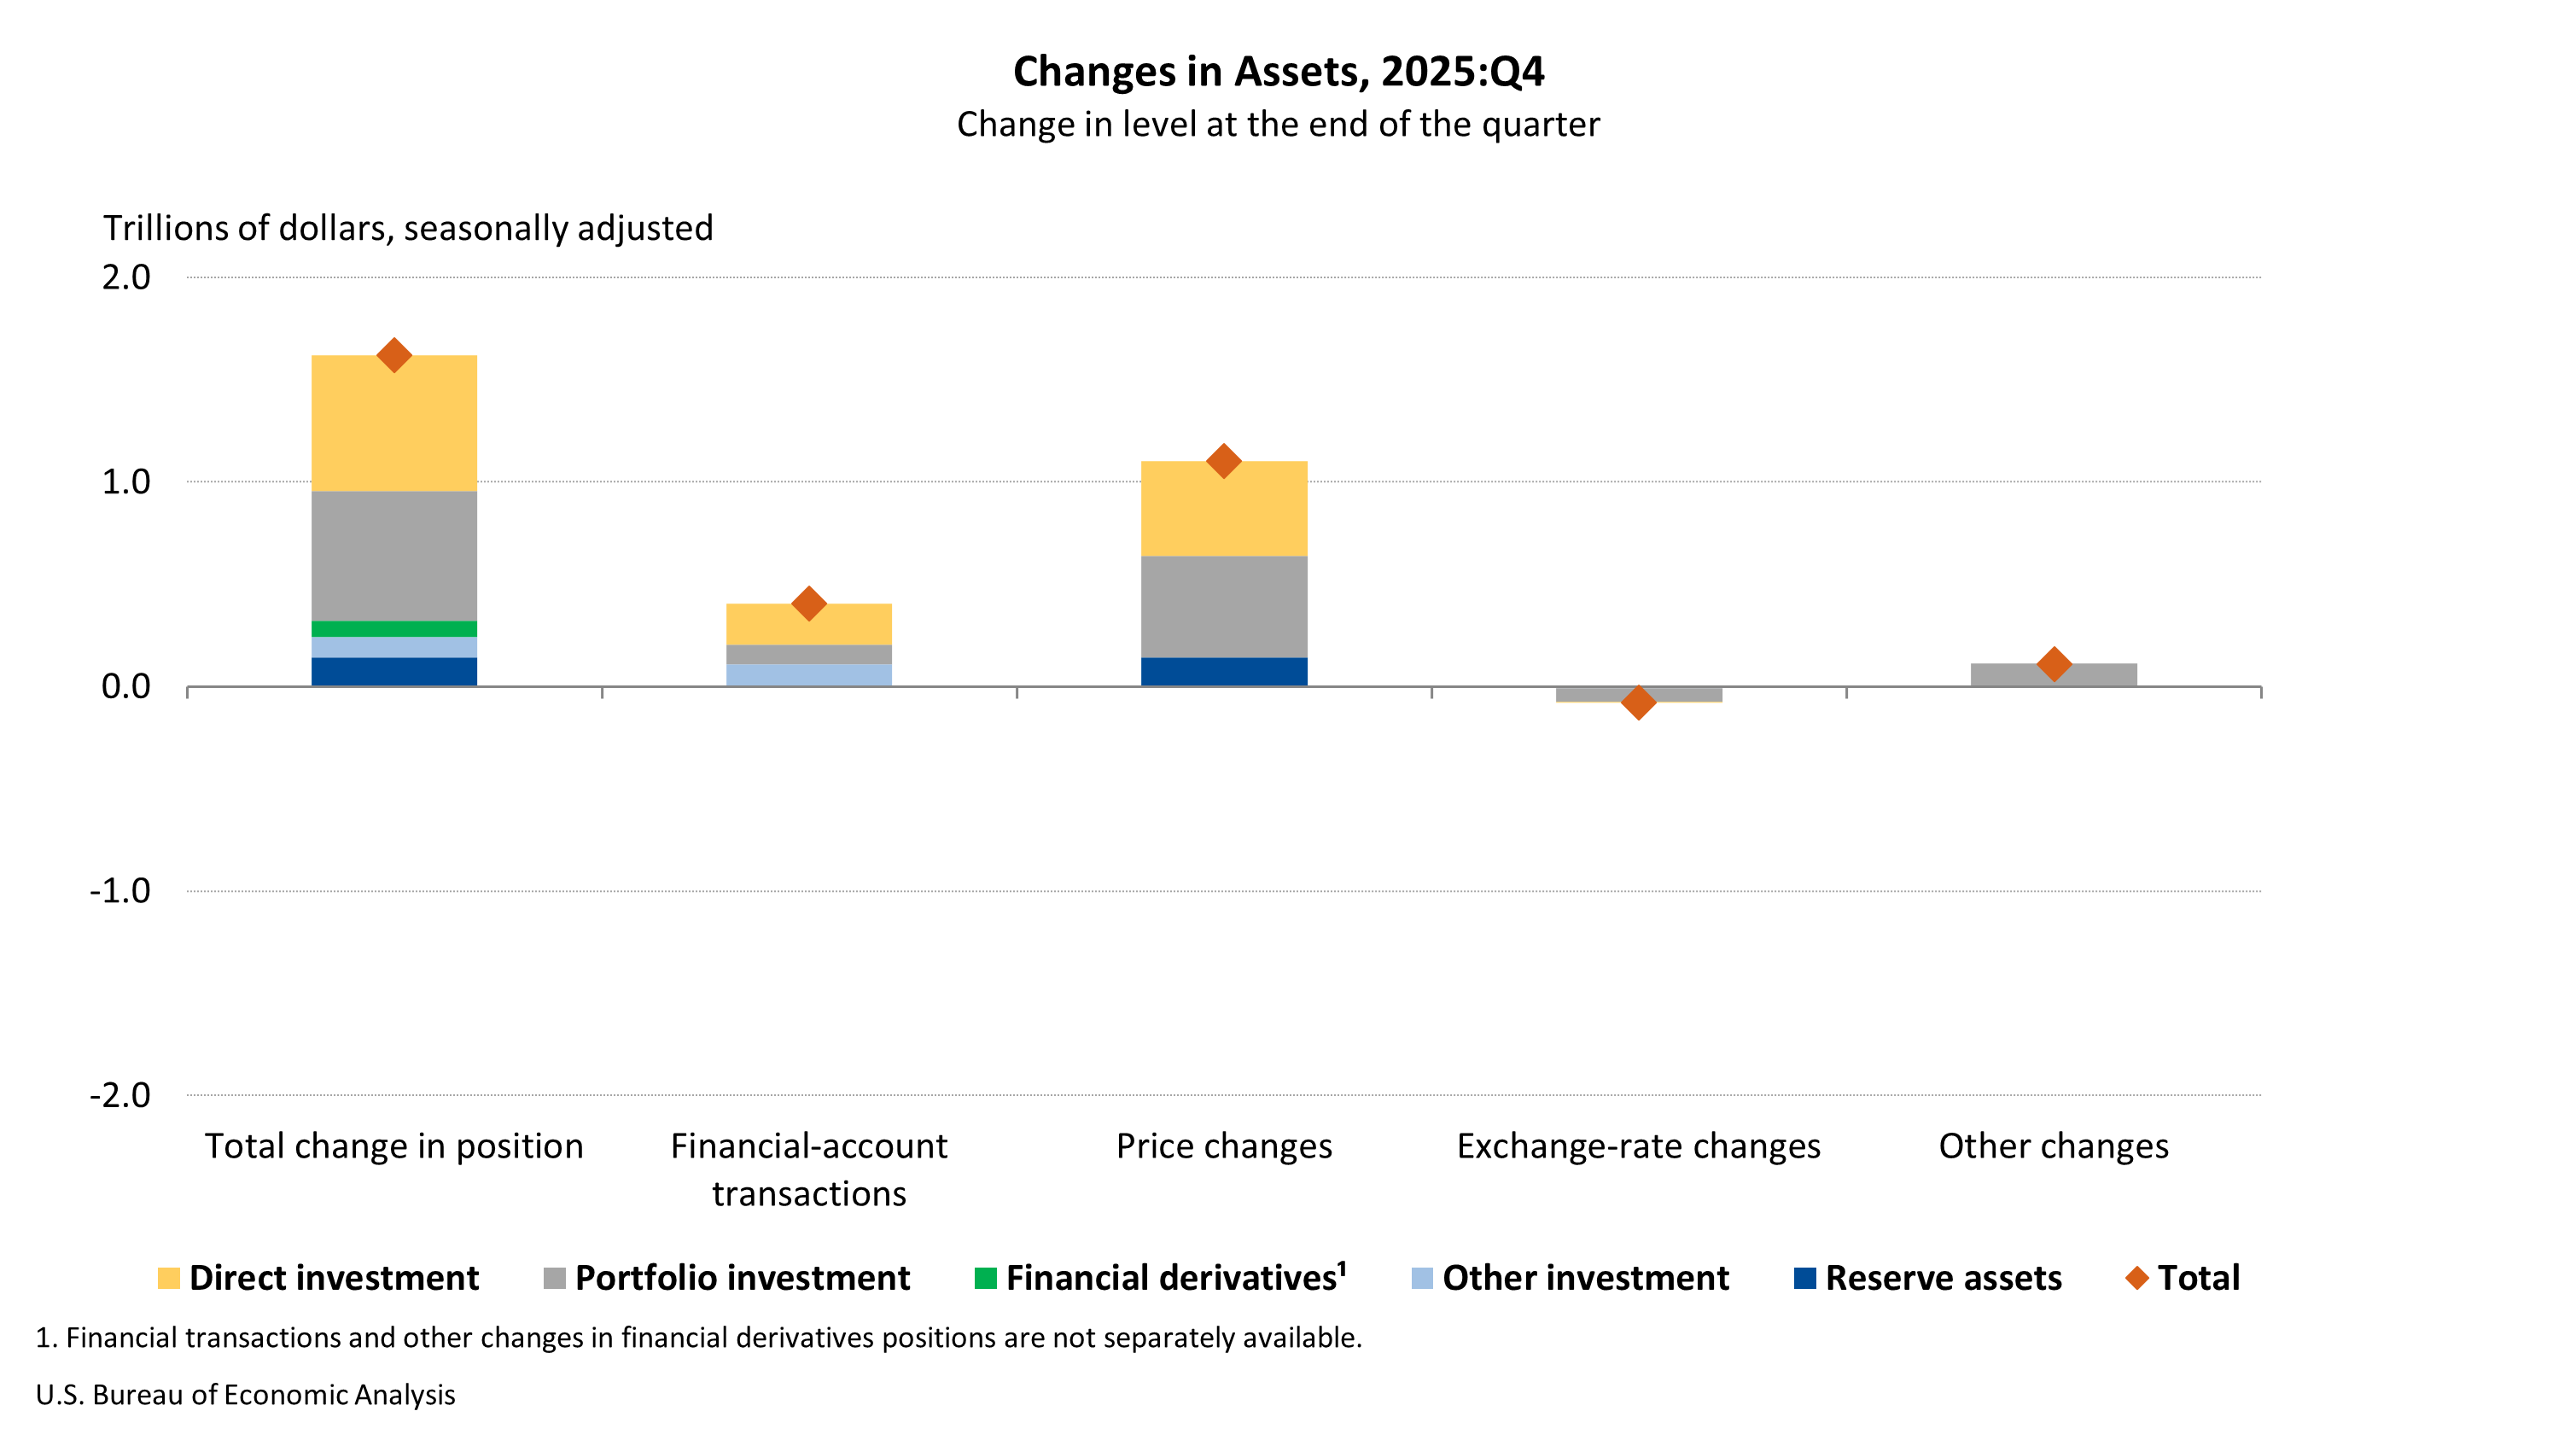
U.S. assets increased $1.62 trillion in the fourth quarter, reflecting increases in all major investment categories, particularly in direct investment and in portfolio investment. The overall increase was driven by price changes of $1.10 trillion and financial transactions of $405.0 billion.
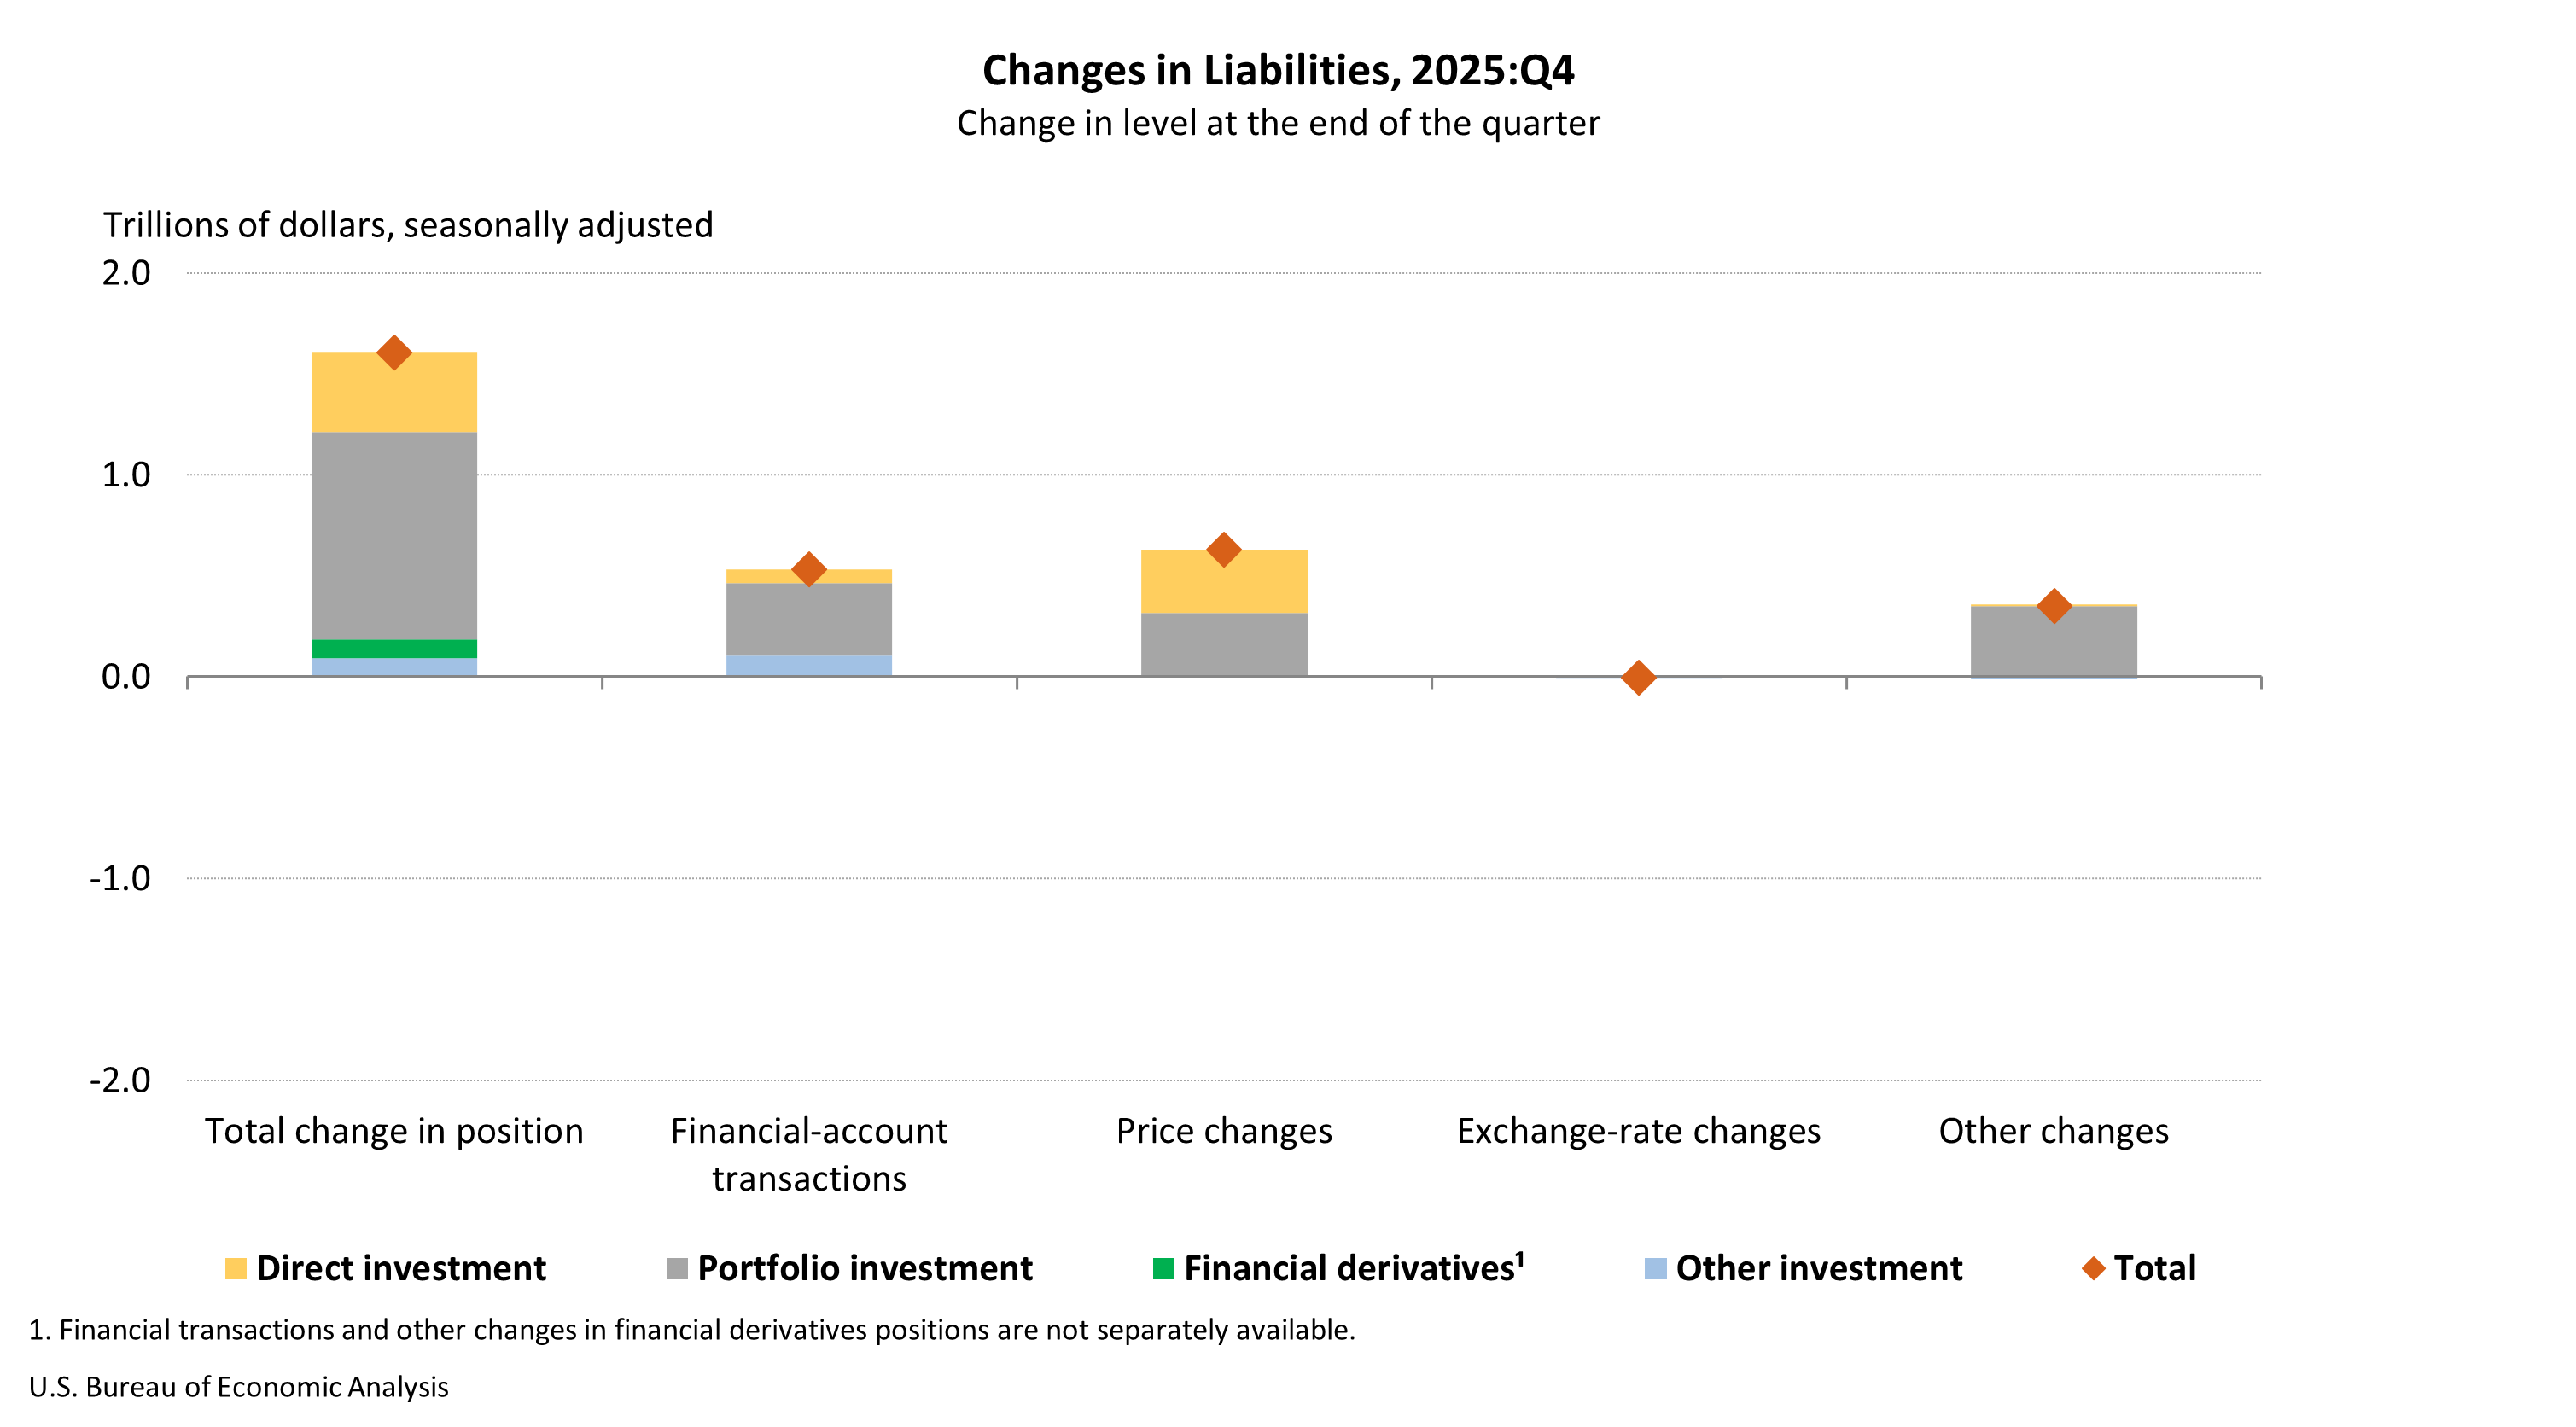
U.S. liabilities increased $1.61 trillion in the fourth quarter, reflecting increases in all major investment categories, particularly in portfolio investment. The overall increase was driven by price changes of $631.6 billion and financial transactions of $532.0 billion.
Updates for the Third Quarter of 2025 International Transactions Accounts Balances | ||
|---|---|---|
| Preliminary estimates | Revised estimates | |
| Billions of dollars, seasonally adjusted1 | ||
| Current-account balance | –226.4 | –239.1 |
| Goods balance | –267.4 | –265.9 |
| Services balance | 89.2 | 86.5 |
| Primary income balance | 5.2 | –2.5 |
| Secondary income balance | –53.5 | –57.2 |
| Net financial-account transactions | – 409.9 | –376.4 |
| International Investment Position Aggregates | ||
|---|---|---|
| Preliminary estimates | Revised estimates | |
| Trillions of dollars, not seasonally adjusted | ||
| U.S. net international investment position | –27.61 | –27.55 |
| U.S. assets | 41.27 | 41.34 |
| U.S. liabilities | 68.89 | 68.89 |
| 1. In addition to revisions to source data for the third quarter of 2025, seasonally adjusted statistics for the first, second, and third quarters of 2025 were revised to force the sum of seasonally adjusted quarters to equal annual totals. This forcing procedure was also applied to the fourth quarter of 2025. U.S. Bureau of Economic Analysis | ||
Year 2025
The U.S. current-account deficit narrowed by $69.3 billion, or 5.8 percent, to $1.12 trillion in 2025. The deficit was 3.6 percent of current-dollar GDP, down from 4.0 percent in 2024.
Exports of goods and services to, and income received from, foreign residents increased $276.2 billion to $5.15 trillion in 2025. Imports of goods and services from, and income paid to, foreign residents increased $206.9 billion to $6.26 trillion.
Capital-transfer receipts decreased $3.6 billion to $9.2 billion in 2025. Capital-transfer payments decreased $1.0 billion to $8.2 billion.
Net financial-account transactions were –$1.21 trillion in 2025, reflecting net U.S. borrowing from foreign residents. Transactions in 2025 increased U.S. residents’ foreign financial assets by $1.7 trillion and increased U.S. liabilities to foreign residents by $2.90 trillion.
The U.S. net international investment position was –$27.54 trillion at the end of 2025, compared to –$26.54 trillion at the end of 2024. U.S. assets increased $7.24 trillion to a total of $42.96 trillion at the end of 2025, and U.S. liabilities increased $8.24 trillion to a total of $70.49 trillion.
Update to “Table 1.3. Change in the U.S. Net International Investment Position”
With this combined release, BEA has updated “Table 1.3. Change in the U.S. Net International Investment Position” to include seasonally adjusted financial transactions. The only differences between the seasonally adjusted and not seasonally adjusted values presented in table 1.3 are in “direct investment transactions at market value–equity” (rows 8 and 40), “changes in volume and valuation” (rows 8 and 40), and their affected aggregates. See U.S. International Economic Accounts: Concepts and Methods for more information on seasonal adjustment.
Upcoming Annual Updates
The annual updates of the U.S. International Transactions Accounts (ITAs) and International Investment Position (IIP) Accounts, along with preliminary estimates for the first quarter of 2026, will be released on June 24, 2026. A preview of the annual updates will be available in the Survey of Current Business in April 2026.
Related Interactive Data Tables
For the fourth-quarter and year 2025 ITA and IIP statistics highlighted in this release, as well as historical time series for these estimates, see the below data tables in BEA’s Interactive Data Application.
International transactions
Table 1.1. U.S. International Transactions
Table 1.2. U.S. International Transactions, Expanded Detail
Table 2.1. U.S. International Trade in Goods
Table 3.1. U.S. International Trade in Services
Table 4.1. U.S. International Transactions in Primary Income
Table 5.1. U.S. International Transactions in Secondary Income
Table 6.1. U.S. International Financial Transactions for Direct Investment
Table 7.1. U.S. International Financial Transactions for Portfolio Investment
Table 8.1. U.S. International Financial Transactions for Other Investment
International investment position
Table 1.1. U.S. Net International Investment Position at the End of the Period
Table 1.2. U.S. Net International Investment Position at the End of the Period, Expanded Detail
Table 1.3. Change in the U.S. Net International Investment Position
Note. With the release of first-quarter 2026 ITA and IIP statistics on June 24, 2026, the fourth-quarter and 2025 data, as well as data affected by the annual update, will be superseded, and the links above will reflect the latest data. The original data featured in this release can then be accessed in BEA’s Data Archive.
Next release: June 24, 2026, at 8:30 a.m. EDT
U.S. International Transactions and Investment Position, 1st Quarter 2026 and Annual Update