
Interested in comparing buying power in your metropolitan area to another? Then, you’ll want to look at the Bureau of Economic Analysis’ latest batch of regional price indexes.
Some highlights from BEA’s recent news release, featuring our 2017 Regional Price Parities:
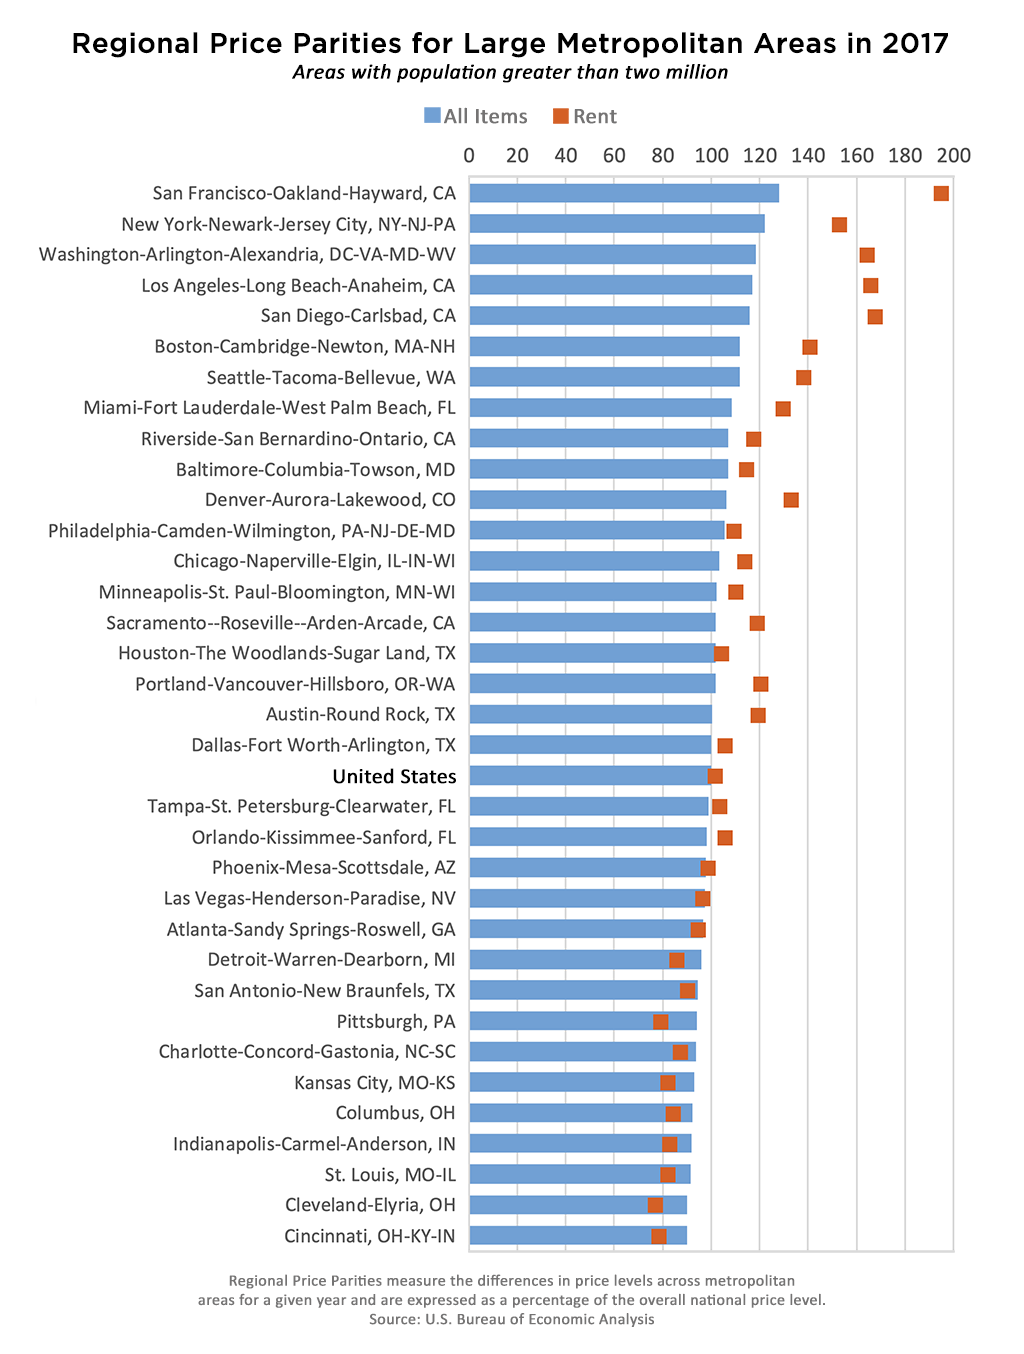
- Large metropolitan areas with the highest regional price parities were: San Francisco-Oakland-Hayward, CA (128.0); New York-Newark-Jersey City, NY-NJ-PA (122.3); and Washington-Arlington-Alexandria, DC-VA-MD-WV (118.4).
- Large metropolitan areas with the lowest regional price parities were: Cincinnati, OH-KY-IN (90.0); Cleveland-Elyria, OH (90.2); and St. Louis, MO-IL (91.4).
- Across large metropolitan areas, San Francisco-Oakland-Hayward, CA, had the highest regional price parity for housing rents (195.0), while Cleveland-Elyria, OH, had the lowest (77.2).
Regional Price Parities measure the differences in price levels across metropolitan areas for a given year. They are expressed as a percentage of the overall national price level. If the Regional Price Parity for one area is 120, that means prices are 20 percent higher than the national average. If the Regional Price Parity is 90, then prices are 10 percent lower than the national average.
Regional Price Parities are calculated using prices for a wide array of consumer goods and services, such as food, transportation, education, and housing rents.
Areas with high or low Regional Price Parities typically correspond to areas with high or low prices levels for rents.
Learn more about BEA’s Regional Price Parities for metro areas as well as states on our website.