10, 2004
| Technical: |
Peter Kuhbach: |
(202)
|
606-9543 |
BEA 04-26 |
| |
Bradlee Herauf: |
|
606-9978 |
| Media: |
Ralph Stewart: |
|
606-9690 |
| E-mail inquiries: |
industrysatellites@bea.gov |
BEA REPORTS SALES OF U.S. TOURISM INDUSTRIES GREW 11.6 PERCENT IN FIRST QUARTER 2004
Tourism Sales Exceed Fourth Quarter 2000 Peak
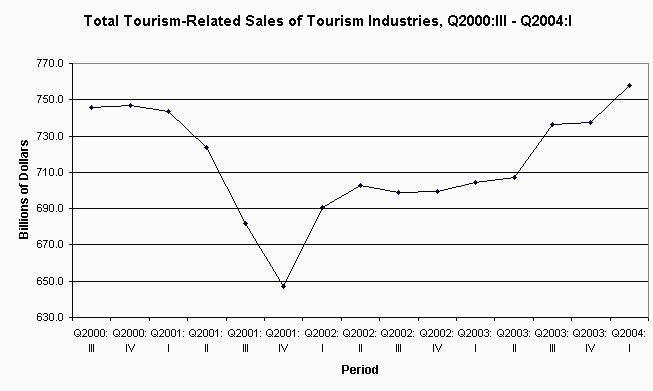
Total sales of U.S. tourism industries grew 11.6 percent (seasonally adjusted annual rate) in the first
quarter of 2004, following growth of 0.4 percent (revised) in the fourth quarter of 2003, according to
preliminary data released by the U.S. Bureau of Economic Analysis. Current dollar GDP grew 7.2 percent in
the first quarter. Total tourism-related sales were $757.7 billion in the first quarter of 2004, which
exceeded the previous peak of $746.7 billion in the fourth quarter of 2000. This recovery in tourism sales
is attributable to mixed growth in the two largest tourism industries, air transportation and hotels and
lodging places, and strong growth in other tourism industries such as eating and drinking places, amusement
and recreation services, and motion pictures and other entertainment.
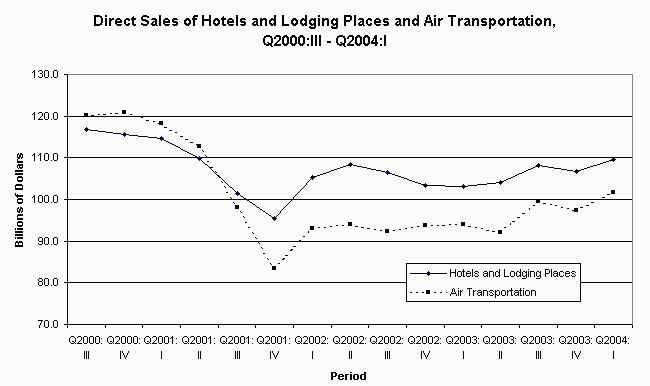
While overall tourism sales now exceed the fourth quarter 2000 peak, there have been significant changes in
the structure of those sales. Sales of air transportation and hotels and lodging places were hit hard by the
events of September 11, 2001, and they still have not reached their fourth quarter 2000 peak. In contrast,
other tourism industries grew at a 5.4 percent annualized rate since the previous peak. As a result, the
combined sales of air transportation and hotels and lodging places, which accounted for 59 percent of total
tourism sales at the fourth quarter 2000 peak, now account for 52 percent of total tourism sales in the first
quarter of 2004.
Other highlights from this release of the travel and tourism satellite account include:
Although their sales results have been mixed since the fourth quarter 2000 peak, and especially
since the events of September 11, 2001, direct sales of air transportation and hotels and lodging
places experienced high rates of growth - 18.6 percent and 10.9 percent - respectively, in the first
quarter of 2004.
Direct sales of eating and drinking places grew 14.2 percent in the first quarter.
Direct sales of amusement and recreation services grew 18.2 percent in the first quarter of 2004.
Total sales of all tourism-related industries increased 11.6 percent, or $20.5 billion, to $757.7 in
the first quarter of 2004.
Direct sales of all tourism-related industries increased $10.8 billion to $406.0 billion, and
indirect sales increased $9.7 billion to $351.7 billion.
- Direct tourism sales are sales by tourism industries to out-of-town visitors such as sales by
airlines and restaurants to leisure and business travelers Indirect tourism sales are sales
to tourism industries by the chain of industries that supply them, such as fuel to airlines
and oil to the fuel refineries to supply airlines.
Tourism industries are those identified in the BEA Travel and Tourism Satellite Accounts (TTSA) as industries
whose primary products are typically purchased by out-of-town visitors. Visitors are people whose travel for
pleasure or business takes them 50 miles or more away from home, or outside of their usual environment. The
definitions, framework, and estimating methods used for the U.S. TTSA's follow, as closely as practicable, the
guidelines for similar accounts that were developed by the World Tourism Organization (WTO) and the Organisation
for Economic Co-operation and Development (OECD).
BEA's estimates of U.S. tourism industry sales include figures for both direct and indirect sales. Direct tourism
sales are sales by tourism industries to out-of-town visitors. Indirect tourism sales are sales to tourism
industries by the chain of industries that supply them. Indirect sales were estimated using industry-by-industry
total requirements coefficients from BEA's input-output accounts.
Further information on BEA's TTSA and analyses of previous quarters are available on BEA's Web site. Go to
<www.bea.gov>, and below the "Industry" heading click on "Travel and Tourism." With the support of the U.S.
Department of Commerce's International Trade Administration, BEA's first TTSA's were published in the July 1998
Survey of Current Business. In late 2001, BEA began producing prototype quarterly estimates of tourism industry
sales. BEA is now publishing these estimates on a regular basis, approximately two weeks following the release of
BEA's preliminary estimates of GDP.
BEA's major national, international, regional, and industry estimates; the Survey of Current Business; and BEA
news releases are available without charge on BEA's Web site:
<www.bea.gov>
Summary BEA estimates are available on recorded messages at the time of public release at the following telephone
numbers:
(202) 606-5306 Gross domestic product
606-5303 Personal income and outlays
606-5362 U.S. international transactions
Most of BEA's estimates and analyses appear in the Survey of Current Business, BEA's monthly journal.
Subscriptions and single copies of the printed Survey are for sale by the Superintendent of Documents, U.S.
Government Printing Office. Internet: <bookstore.gpo.gov>; phone: 202-512-1800; fax: 202-512-2250;
mail: Stop SSOP, Washington, DC 20402-0001.
* * *
Next release - Sales of U.S. Tourism Industries for Second Quarter 2004 will be released on
September 8, 2004 at 8:30 A.M. EDT.
| Table 1. -- Direct Tourism-related Sales of Tourism Industries |
|
| Percent Change from Preceding Period |
|
| |
|
|
|
|
|
|
|
|
|
|
|
|
|
|
|
|
|
|
| |
|
|
|
|
Seasonally adjusted at annual rates |
|
| Tourism Industry |
|
Y2001 |
Y2002 |
Y2003 |
Q2000: IV |
Q2001: I |
Q2001: II |
Q2001: III |
Q2001: IV |
Q2002: I |
Q2002: II |
Q2002: III |
Q2002: IV |
Q2003: I |
Q2003: II |
Q2003: III |
Q2003: IV |
Q2004: I |
| |
|
|
|
|
|
|
|
|
|
|
|
|
|
|
|
|
|
|
| Hotels and lodging places |
|
-8.4 |
0.5 |
-0.3 |
-4.5 |
-3.1 |
-16.0 |
-26.9 |
-21.7 |
47.6 |
12.6 |
-7.2 |
-10.9 |
-0.8 |
3.5 |
16.9 |
-5.3 |
10.9 |
| Eating and drinking places |
|
3.8 |
5.1 |
7.1 |
1.1 |
10.6 |
-1.0 |
3.1 |
4.2 |
11.9 |
2.8 |
2.3 |
4.8 |
7.8 |
10.1 |
9.0 |
13.3 |
14.2 |
| Railroads and related services |
|
7.9 |
2.5 |
1.7 |
-2.9 |
3.8 |
-2.2 |
16.6 |
33.7 |
-2.0 |
-10.3 |
-16.7 |
2.2 |
5.9 |
0.0 |
19.7 |
12.0 |
-14.9 |
| Local and bus passenger transit |
|
-5.5 |
0.8 |
2.4 |
-8.6 |
-6.5 |
-7.0 |
0.8 |
-6.3 |
8.4 |
1.5 |
0.0 |
0.5 |
-2.4 |
8.1 |
9.4 |
3.9 |
-0.9 |
| Taxicabs |
|
2.8 |
3.3 |
8.9 |
2.2 |
4.1 |
2.5 |
5.2 |
2.9 |
2.7 |
4.9 |
2.2 |
2.3 |
4.0 |
26.6 |
15.1 |
4.0 |
6.8 |
| Air transportation |
|
-13.2 |
-9.5 |
2.6 |
3.0 |
-8.4 |
-18.0 |
-42.6 |
-47.4 |
54.2 |
4.2 |
-7.0 |
6.9 |
0.7 |
-8.2 |
36.8 |
-8.6 |
18.6 |
| Water transportation |
|
-4.3 |
1.3 |
3.6 |
-6.0 |
-7.2 |
-3.8 |
-5.4 |
0.8 |
3.2 |
3.6 |
3.2 |
2.9 |
4.7 |
3.9 |
2.5 |
2.4 |
3.7 |
| Automotive rental and leasing |
|
1.6 |
9.0 |
4.1 |
5.5 |
1.9 |
-8.4 |
-5.7 |
11.2 |
22.6 |
11.7 |
9.7 |
-7.3 |
0.9 |
5.2 |
14.8 |
11.3 |
-9.6 |
| Travel agency services |
|
-7.0 |
1.4 |
4.3 |
-11.2 |
-11.3 |
-8.1 |
3.3 |
-3.7 |
6.0 |
5.9 |
-2.9 |
1.3 |
2.0 |
13.2 |
8.2 |
3.1 |
2.3 |
| Amusement and recreation services |
|
5.3 |
5.7 |
4.8 |
0.8 |
5.6 |
3.3 |
3.0 |
5.0 |
9.3 |
5.1 |
7.2 |
1.2 |
4.7 |
5.7 |
6.8 |
4.2 |
18.2 |
| Membership sports and recreation clubs |
|
5.0 |
12.0 |
2.4 |
6.9 |
0.4 |
7.1 |
9.2 |
9.4 |
18.3 |
11.8 |
10.4 |
9.9 |
3.7 |
-1.5 |
-12.3 |
-4.8 |
0.0 |
| Motion pictures and other entertainment |
|
7.6 |
6.5 |
6.9 |
6.2 |
16.9 |
-2.4 |
5.0 |
15.3 |
6.1 |
8.7 |
-10.6 |
27.3 |
-10.8 |
21.6 |
11.3 |
13.3 |
2.5 |
| Professional sports clubs and promoters |
|
8.1 |
9.4 |
6.2 |
-0.1 |
14.3 |
18.7 |
-22.8 |
46.3 |
-1.7 |
14.2 |
14.5 |
4.4 |
4.6 |
3.8 |
4.5 |
5.3 |
19.2 |
| Gasoline service stations |
|
-1.5 |
-4.2 |
16.1 |
12.5 |
-3.0 |
8.9 |
-25.4 |
-37.3 |
-4.4 |
46.8 |
3.8 |
20.2 |
77.7 |
-38.3 |
27.6 |
5.4 |
46.5 |
| Retail excluding restaurants and gas stations |
|
3.9 |
4.1 |
4.5 |
5.2 |
0.1 |
2.8 |
5.7 |
4.4 |
5.6 |
3.4 |
1.1 |
4.3 |
5.7 |
2.2 |
10.2 |
4.2 |
8.2 |
| |
|
|
|
|
|
|
|
|
|
|
|
|
|
|
|
|
|
|
| All tourism industries |
|
-5.2 |
-0.1 |
3.2 |
0.4 |
-1.7 |
-10.5 |
-21.0 |
-18.8 |
29.9 |
7.2 |
-2.5 |
0.2 |
2.6 |
1.8 |
17.6 |
0.1 |
11.4 |
| |
|
|
|
|
|
|
|
|
|
|
|
|
|
|
|
|
|
|
| |
|
|
|
|
|
|
|
|
|
|
|
|
|
|
|
|
|
|
| |
|
|
|
|
|
|
|
|
|
|
|
|
|
|
|
|
|
|
| Source: Bureau of Economic Analysis |
|
|
|
|
|
|
|
|
|
|
|
|
|
|
|
|
|
|
| Table 2. -- Direct Tourism-related Sales of Tourism Industries |
|
| [Billions of dollars] |
|
| |
|
|
|
|
|
|
|
|
|
|
|
|
|
|
|
|
|
|
|
| |
|
|
|
|
Seasonally adjusted at annual rates |
|
| Tourism Industry |
Y2000 |
Y2001 |
Y2002 |
Y2003 |
Q2000: III |
Q2000: IV |
Q2001: I |
Q2001: II |
Q2001: III |
Q2001: IV |
Q2002: I |
Q2002: II |
Q2002: III |
Q2002: IV |
Q2003: I |
Q2003: II |
Q2003: III |
Q2003: IV |
Q2004: I |
| |
|
|
|
|
|
|
|
|
|
|
|
|
|
|
|
|
|
|
|
| Hotels and lodging places |
115.0 |
105.3 |
105.8 |
105.5 |
116.9 |
115.5 |
114.6 |
109.7 |
101.5 |
95.5 |
105.2 |
108.4 |
106.4 |
103.4 |
103.2 |
104.1 |
108.2 |
106.7 |
109.5 |
| Eating and drinking places |
56.7 |
58.9 |
61.9 |
66.3 |
57.0 |
57.1 |
58.6 |
58.4 |
58.9 |
59.5 |
61.2 |
61.6 |
62.0 |
62.7 |
63.9 |
65.4 |
66.9 |
69.0 |
71.3 |
| Railroads and related services |
1.3 |
1.4 |
1.4 |
1.4 |
1.3 |
1.3 |
1.3 |
1.3 |
1.4 |
1.5 |
1.5 |
1.4 |
1.4 |
1.4 |
1.4 |
1.4 |
1.5 |
1.5 |
1.5 |
| Local and bus passenger transit |
2.9 |
2.8 |
2.8 |
2.9 |
2.9 |
2.9 |
2.8 |
2.8 |
2.8 |
2.7 |
2.8 |
2.8 |
2.8 |
2.8 |
2.8 |
2.8 |
2.9 |
2.9 |
2.9 |
| Taxicabs |
4.6 |
4.8 |
4.9 |
5.4 |
4.6 |
4.7 |
4.7 |
4.7 |
4.8 |
4.8 |
4.9 |
4.9 |
4.9 |
5.0 |
5.0 |
5.3 |
5.5 |
5.6 |
5.7 |
| Air transportation |
118.8 |
103.1 |
93.3 |
95.7 |
120.1 |
121.0 |
118.3 |
112.6 |
98.0 |
83.5 |
93.0 |
94.0 |
92.3 |
93.9 |
94.0 |
92.0 |
99.5 |
97.3 |
101.6 |
| Water transportation |
7.8 |
7.4 |
7.5 |
7.8 |
7.8 |
7.7 |
7.5 |
7.4 |
7.3 |
7.4 |
7.4 |
7.5 |
7.5 |
7.6 |
7.7 |
7.8 |
7.8 |
7.9 |
7.9 |
| Automotive rental and leasing |
21.3 |
21.6 |
23.5 |
24.5 |
21.6 |
21.9 |
22.0 |
21.5 |
21.2 |
21.8 |
22.9 |
23.5 |
24.1 |
23.6 |
23.7 |
24.0 |
24.8 |
25.5 |
24.9 |
| Travel agency services |
4.6 |
4.2 |
4.3 |
4.5 |
4.6 |
4.4 |
4.3 |
4.2 |
4.2 |
4.2 |
4.3 |
4.3 |
4.3 |
4.3 |
4.3 |
4.5 |
4.6 |
4.6 |
4.6 |
| Amusement and recreation services |
15.2 |
16.0 |
16.9 |
17.7 |
15.5 |
15.6 |
15.8 |
15.9 |
16.0 |
16.2 |
16.6 |
16.8 |
17.1 |
17.1 |
17.3 |
17.6 |
17.9 |
18.1 |
18.8 |
| Membership sports and recreation clubs |
5.9 |
6.2 |
6.9 |
7.1 |
5.9 |
6.0 |
6.0 |
6.1 |
6.2 |
6.4 |
6.7 |
6.8 |
7.0 |
7.2 |
7.3 |
7.2 |
7.0 |
6.9 |
6.9 |
| Motion pictures and other entertainment |
7.1 |
7.7 |
8.2 |
8.7 |
7.2 |
7.3 |
7.6 |
7.5 |
7.6 |
7.9 |
8.0 |
8.2 |
8.0 |
8.5 |
8.2 |
8.6 |
8.9 |
9.1 |
9.2 |
| Professional sports clubs and promoters |
1.8 |
1.9 |
2.1 |
2.2 |
1.8 |
1.8 |
1.9 |
2.0 |
1.8 |
2.0 |
2.0 |
2.1 |
2.2 |
2.2 |
2.2 |
2.2 |
2.3 |
2.3 |
2.4 |
| Gasoline service stations |
3.2 |
3.2 |
3.0 |
3.5 |
3.3 |
3.4 |
3.3 |
3.4 |
3.2 |
2.8 |
2.8 |
3.1 |
3.1 |
3.2 |
3.7 |
3.3 |
3.5 |
3.6 |
3.9 |
| Retail excluding restaurants and gas stations |
29.6 |
30.8 |
32.0 |
33.5 |
29.9 |
30.3 |
30.3 |
30.5 |
30.9 |
31.3 |
31.7 |
32.0 |
32.1 |
32.4 |
32.8 |
33.0 |
33.8 |
34.2 |
34.9 |
| |
|
|
|
|
|
|
|
|
|
|
|
|
|
|
|
|
|
|
|
| All tourism industries |
395.7 |
375.2 |
374.7 |
386.8 |
400.4 |
400.8 |
399.1 |
388.2 |
366.0 |
347.4 |
370.9 |
377.5 |
375.1 |
375.2 |
377.6 |
379.3 |
395.0 |
395.2 |
406.0 |
| |
|
|
|
|
|
|
|
|
|
|
|
|
|
|
|
|
|
|
|
| |
|
|
|
|
|
|
|
|
|
|
|
|
|
|
|
|
|
|
|
| |
|
|
|
|
|
|
|
|
|
|
|
|
|
|
|
|
|
|
|
| Source: Bureau of Economic Analysis |
|
|
|
|
|
|
|
|
|
|
|
|
|
|
|
|
|
|
|
| Table 3. -- Total (Direct & Indirect) Tourism-related Sales of Tourism Industries |
|
| [Billions of dollars] |
|
| |
|
|
|
|
|
|
|
|
|
|
|
|
|
|
|
|
|
|
|
| |
|
|
|
|
Seasonally adjusted at annual rates |
|
| Tourism Industry |
Y2000 |
Y2001 |
Y2002 |
Y2003 |
Q2000: III |
Q2000: IV |
Q2001: I |
Q2001: II |
Q2001: III |
Q2001: IV |
Q2002: I |
Q2002: II |
Q2002: III |
Q2002: IV |
Q2003: I |
Q2003: II |
Q2003: III |
Q2003: IV |
Q2004: I |
| |
|
|
|
|
|
|
|
|
|
|
|
|
|
|
|
|
|
|
|
| Hotels and lodging places |
205.8 |
188.5 |
189.5 |
188.9 |
209.2 |
206.8 |
205.2 |
196.4 |
181.7 |
170.9 |
188.3 |
194.0 |
190.4 |
185.0 |
184.7 |
186.3 |
193.7 |
191.1 |
196.1 |
| Eating and drinking places |
116.8 |
121.3 |
127.5 |
136.6 |
117.4 |
117.7 |
120.7 |
120.4 |
121.3 |
122.6 |
126.1 |
127.0 |
127.7 |
129.2 |
131.6 |
134.8 |
137.7 |
142.1 |
146.9 |
| Railroads and related services |
2.3 |
2.4 |
2.5 |
2.5 |
2.4 |
2.3 |
2.4 |
2.3 |
2.4 |
2.6 |
2.6 |
2.5 |
2.4 |
2.4 |
2.5 |
2.5 |
2.6 |
2.7 |
2.6 |
| Local and bus passenger transit |
5.2 |
4.9 |
4.9 |
5.0 |
5.2 |
5.0 |
5.0 |
4.9 |
4.9 |
4.8 |
4.9 |
4.9 |
4.9 |
4.9 |
4.9 |
5.0 |
5.1 |
5.1 |
5.1 |
| Taxicabs |
8.1 |
8.4 |
8.7 |
9.4 |
8.1 |
8.2 |
8.3 |
8.3 |
8.4 |
8.5 |
8.5 |
8.6 |
8.7 |
8.7 |
8.8 |
9.4 |
9.7 |
9.8 |
10.0 |
| Air transportation |
224.6 |
194.9 |
176.3 |
180.9 |
227.0 |
228.6 |
223.7 |
212.9 |
185.2 |
157.8 |
175.8 |
177.6 |
174.4 |
177.4 |
177.7 |
173.9 |
188.1 |
183.9 |
191.9 |
| Water transportation |
16.6 |
15.9 |
16.1 |
16.6 |
16.6 |
16.4 |
16.1 |
15.9 |
15.7 |
15.7 |
15.9 |
16.0 |
16.1 |
16.3 |
16.4 |
16.6 |
16.7 |
16.8 |
17.0 |
| Automotive rental and leasing |
42.1 |
42.8 |
46.6 |
48.5 |
42.7 |
43.3 |
43.5 |
42.6 |
41.9 |
43.1 |
45.3 |
46.6 |
47.7 |
46.8 |
46.9 |
47.5 |
49.2 |
50.5 |
49.2 |
| Travel agency services |
8.0 |
7.5 |
7.6 |
7.9 |
8.0 |
7.8 |
7.6 |
7.4 |
7.5 |
7.4 |
7.5 |
7.6 |
7.6 |
7.6 |
7.6 |
7.9 |
8.0 |
8.1 |
8.1 |
| Amusement and recreation services |
26.6 |
28.0 |
29.6 |
31.0 |
27.2 |
27.3 |
27.6 |
27.9 |
28.1 |
28.4 |
29.0 |
29.4 |
29.9 |
30.0 |
30.4 |
30.8 |
31.3 |
31.6 |
33.0 |
| Membership sports and recreation clubs |
10.3 |
10.8 |
12.1 |
12.4 |
10.3 |
10.5 |
10.5 |
10.7 |
10.9 |
11.2 |
11.7 |
12.0 |
12.3 |
12.6 |
12.7 |
12.6 |
12.2 |
12.1 |
12.1 |
| Motion pictures and other entertainment |
12.5 |
13.4 |
14.3 |
15.3 |
12.6 |
12.7 |
13.3 |
13.2 |
13.3 |
13.8 |
14.0 |
14.3 |
13.9 |
14.8 |
14.4 |
15.1 |
15.5 |
16.0 |
16.1 |
| Professional sports clubs and promoters |
3.1 |
3.4 |
3.7 |
3.9 |
3.2 |
3.2 |
3.3 |
3.4 |
3.2 |
3.6 |
3.5 |
3.7 |
3.8 |
3.8 |
3.9 |
3.9 |
3.9 |
4.0 |
4.2 |
| Gasoline service stations |
9.1 |
9.0 |
8.6 |
10.0 |
9.2 |
9.5 |
9.4 |
9.6 |
8.9 |
7.9 |
7.9 |
8.7 |
8.7 |
9.1 |
10.6 |
9.4 |
9.9 |
10.1 |
11.1 |
| Retail excluding restaurants and gas stations |
46.2 |
48.0 |
50.0 |
52.2 |
46.7 |
47.3 |
47.3 |
47.6 |
48.3 |
48.8 |
49.4 |
49.9 |
50.0 |
50.5 |
51.2 |
51.5 |
52.8 |
53.3 |
54.4 |
| |
|
|
|
|
|
|
|
|
|
|
|
|
|
|
|
|
|
|
|
| All tourism industries |
737.2 |
699.0 |
697.8 |
721.3 |
745.7 |
746.7 |
743.7 |
723.5 |
681.9 |
647.1 |
690.6 |
702.8 |
698.6 |
699.2 |
704.3 |
707.1 |
736.6 |
737.2 |
757.7 |
| Percent change at annual rate |
|
-5.2 |
-0.2 |
3.4 |
|
0.5 |
-1.6 |
-10.4 |
-21.1 |
-18.9 |
29.7 |
7.3 |
-2.4 |
0.3 |
2.9 |
1.6 |
17.7 |
0.4 |
11.6 |
| |
|
|
|
|
|
|
|
|
|
|
|
|
|
|
|
|
|
|
|
| |
|
|
|
|
|
|
|
|
|
|
|
|
|
|
|
|
|
|
|
| Source: Bureau of Economic Analysis |
|
|
|
|
|
|
|
|
|
|
|
|
|
|
|
|
|
|
|

