
News Release
These data have been superseded. Please see our latest releases for current estimates and contact information.
Gross Domestic Product, 2nd quarter 2013 (advance estimate); Comprehensive Revision: 1929 through 1st quarter 2013
Real gross domestic product -- the output of goods and services produced by labor and property
located in the United States -- increased at an annual rate of 1.7 percent in the second quarter of 2013
(that is, from the first quarter to the second quarter), according to the "advance" estimate released by the
Bureau of Economic Analysis. In the first quarter, real GDP increased 1.1 percent (revised).
The Bureau emphasized that the second-quarter advance estimate released today is based on
source data that are incomplete or subject to further revision by the source agency (see the box on page 3
and "Comparisons of Revisions to GDP" on page 18). The "second" estimate for the second quarter,
based on more complete data, will be released on August 29, 2013.
The increase in real GDP in the second quarter primarily reflected positive contributions from
personal consumption expenditures (PCE), exports, nonresidential fixed investment, private inventory
investment, and residential investment that were partly offset by a negative contribution from federal
government spending. Imports, which are a subtraction in the calculation of GDP, increased.
The acceleration in real GDP in the second quarter primarily reflected upturns in nonresidential
fixed investment and in exports, a smaller decrease in federal government spending, and an upturn in
state and local government spending that were partly offset by an acceleration in imports and
decelerations in private inventory investment and in PCE.
BOX._______
Comprehensive Revision of the National Income and Product Accounts
The estimates released today reflect the results of the 14th comprehensive (or benchmark) revision
of the national income and product accounts (NIPAs) in conjunction with the second quarter 2013
"advance" estimate. More information on the revision is available on BEAs Web site at
www.bea.gov/gdp-revisions.
FOOTNOTE.______
Quarterly estimates are expressed at seasonally adjusted annual rates, unless otherwise specified.
Quarter-to-quarter dollar changes are differences between these published estimates. Percent changes are
calculated from unrounded data and are annualized. "Real" estimates are in chained (2009) dollars. Price
indexes are chain-type measures.
This news release is available on BEAs Web site along with the Technical Note
and Highlights related to this release.
_______________
The price index for gross domestic purchases, which measures prices paid by U.S. residents,
increased 0.3 percent in the second quarter, compared with an increase of 1.2 percent in the first.
Excluding food and energy prices, the price index for gross domestic purchases increased 0.8 percent in
the second quarter compared with 1.4 percent in the first.
Real personal consumption expenditures increased 1.8 percent in the second quarter, compared
with an increase of 2.3 percent in the first. Durable goods increased 6.5 percent, compared with an
increase of 5.8 percent. Nondurable goods increased 2.0 percent, compared with an increase of 2.7
percent. Services increased 0.9 percent, compared with an increase of 1.5 percent.
Real nonresidential fixed investment increased 4.6 percent in the second quarter, in contrast to a
decrease of 4.6 percent in the first. Nonresidential structures increased 6.8 percent, in contrast to a
decrease of 25.7 percent. Equipment increased 4.1 percent, compared with an increase of 1.6 percent.
Intellectual property products increased 3.8 percent, compared with an increase of 3.7 percent. Real
residential fixed investment increased 13.4 percent, compared with an increase of 12.5 percent.
Real exports of goods and services increased 5.4 percent in the second quarter, in contrast to a
decrease of 1.3 percent in the first. Real imports of goods and services increased 9.5 percent, compared
with an increase of 0.6 percent.
Real federal government consumption expenditures and gross investment decreased 1.5 percent
in the second quarter, compared with a decrease of 8.4 percent in the first. National defense decreased
0.5 percent, compared with a decrease of 11.2 percent. Nondefense decreased 3.2 percent, compared
with a decrease of 3.6 percent. Real state and local government consumption expenditures and gross
investment increased 0.3 percent, in contrast to a decrease of 1.3 percent.
The change in real private inventories added 0.41 percentage point to the second-quarter change
in real GDP after adding 0.93 percentage point to the first-quarter change. Private businesses increased
inventories $56.7 billion in the second quarter, following increases of $42.2 billion in the first quarter
and $7.3 billion in the fourth.
Real final sales of domestic product -- GDP less change in private inventories -- increased 1.3
percent in the second quarter, compared with an increase of 0.2 percent in the first.
Gross domestic purchases
Real gross domestic purchases -- purchases by U.S. residents of goods and services wherever
produced -- increased 2.4 percent in the second quarter, compared with an increase of 1.4 percent in the
first.
Disposition of personal income
Current-dollar personal income increased $140.1 billion (4.1 percent) in the second quarter, in
contrast to a decrease of $157.1 billion (4.4 percent) in the first. The upturn in personal income
primarily reflected sharp upturns in personal dividend income and in wages and salaries and a sharp
deceleration in contributions for government social insurance (a subtraction in the calculation of
personal income).
* Personal dividend income increased in the second quarter, in contrast to a large decrease in the
first. The first-quarter decline in dividend income primarily reflected the accelerated and special
dividends that were paid by many companies in the fourth quarter of 2012.
* Wages and salaries increased in the second quarter, in contrast to a decrease in the first. The
first-quarter decline in wages and salaries is based on preliminary quarterly census of
employment and wages data from the Bureau of Labor Statistics.
* The sharp deceleration in contributions for government social insurance primarily reflected the
first-quarter expiration of the "payroll tax holiday" that increased the social security contribution
rate for employees and self-employed workers by 2.0 percentage points.
Personal current taxes increased $36.0 billion in the second quarter, compared with an increase
of $74.3 billion in the first.
Disposable personal income increased $104.1 billion (3.4 percent) in the second quarter, in
contrast to a decrease of $231.5 billion (7.2 percent) in the first. Real disposable personal income
increased 3.4 percent, in contrast to a decrease of 8.2 percent.
Personal outlays increased $44.7 billion (1.5 percent) in the second quarter, compared with an
increase of $98.7 billion (3.4 percent) in the first. Personal saving -- disposable personal income less
personal outlays -- was $553.4 billion in the second quarter, compared with $494.0 billion in the first.
The personal saving rate -- personal saving as a percentage of disposable personal income -- was
4.5 percent in the second quarter, compared with 4.0 percent in the first. For a comparison of personal
saving in BEAs national income and product accounts with personal saving in the Federal Reserve
Boards flow of funds accounts and data on changes in net worth, go to
www.bea.gov/national/nipaweb/Nipa-Frb.asp.
Current-dollar GDP
Current-dollar GDP -- the market value of the nation's output of goods and services -- increased
2.4 percent, or $98.1 billion, in the second quarter to a level of $16,633.4 billion. In the first quarter,
current-dollar GDP increased 2.8 percent, or $115.0 billion.
Box._______
Information on the assumptions used for unavailable source data is provided in a technical note that
is posted with the news release on BEA's Web site. Within a few days after the release, a detailed "Key
Source Data and Assumptions" file is posted on the Web site. In the middle of each month, an analysis of
the current quarterly estimate of GDP and related series is made available on the Web site; click on Survey
of Current Business, "GDP and the Economy." For information on revisions, see "Revisions to GDP, GDI, and Their
Major Components."
____________
COMPREHENSIVE REVISION OF THE NATIONAL INCOME AND PRODUCT
ACCOUNTS: 1929 THROUGH FIRST QUARTER 2013
Today, BEA released revised statistics of gross domestic product (GDP) and of other national
income and product accounts (NIPAs) series from 1929 through the first quarter of 2013.
Comprehensive revisions, which are carried out about every 5 years, are an important part of BEAs
regular process for improving and modernizing its accounts to keep pace with the ever-changing U.S.
economy.
Most of the tables in this release present revised statistics for 2002 through the first quarter of
2013. Selected NIPA tables, with statistics from 1929 forward, are available on BEA's Web site
(www.bea.gov). Most of the remaining NIPA tables will be released later in August. An article
describing the statistics will be published in the September 2013 issue of BEAs monthly journal, the
Survey of Current Business.
Summary of revisions
The picture of the economy shown in the revised estimates is very similar in broad outline to the
picture shown in the previously published estimates. The similarity and some of the differences can be
seen in the following:
* For 19292012, the average annual growth rate of real GDP was 3.3 percent, 0.1 percentage
point higher than in the previously published estimates. For the more recent period, 20022012,
the growth rate was 1.8 percent, 0.2 percentage point higher than in the previously published
estimates.
* For 20022012, the average rate of change in the prices paid by U.S. residents was 2.3 percent,
0.1 percentage point lower than in the previously published estimates.
* For 20092012, the average annual growth rate of real GDP was 2.4 percent, 0.3 percentage
point higher than in the previously published estimates. The percent change in real GDP was
revised up 0.1 percentage point for 2010, was unrevised for 2011, and was revised up 0.6
percentage point for 2012.
* For the period of contraction from the fourth quarter of 2007 to the second quarter of 2009, real
GDP decreased at an average annual rate of 2.9 percent; in the previously published estimates, it
decreased 3.2 percent.
* For the period of expansion from the second quarter of 2009 to the first quarter of 2013, real
GDP increased at an average annual rate of 2.2 percent; in the previously published estimates, it
increased 2.1 percent.
Improvements incorporated in this comprehensive revision
Comprehensive revisions encompass three major types of improvements:
* Changes in definitions and in classifications that update the accounts to more accurately portray
the evolving U.S. economy,
* Changes in presentations that make the NIPA tables more informative, and
* Statistical changes that introduce new and improved methodologies and that bring in newly
available and revised source data (see box on page 8).
The improvements incorporated in the revised estimates have been previewed in a series of
articles in the Survey and are available on BEAs Web site at www.bea.gov/gdp-revisions.
Changes in definitions, classifications, and presentations. The changes in definitions, in
classifications, and in presentations introduced in this comprehensive revision include the following:
* Expenditures by business, government, and nonprofit institutions serving households (NPISH)
for research and development (R&D) are recognized as fixed investment. The new treatment
improves BEAs measures of fixed investment and allows users to better measure the effects of
innovation and intangible assets on the economy.
* Similarly, expenditures by private enterprises for the creation of entertainment, literary, and
artistic originals are recognized as fixed investment, further expanding BEAs measures of
intangible assets.
* In the NIPA fixed investment tables, a new category of investment, "intellectual property
products," consists of research and development; entertainment, literary, and artistic originals;
and software.
* Transactions of defined benefit pension plans are recorded on an accrual accounting basis, which
recognizes the costs of unfunded liabilities.
* An expanded set of ownership transfer costs for residential fixed assets is recognized as fixed
investment, and the accuracy of the associated asset values and services lives is improved.
* The reference year for the chain-type quantity and price indexes and for the chained-dollar
estimates is updated to 2009 from 2005.
Statistical changes. Important statistical changes that introduce new and improved
methodologies and that bring in newly available source data include the following:
* BEAs 2007 benchmark input-output (I-O) accounts, which provide the most thorough and
detailed information on the structure of the U.S. economy, are used to benchmark the
expenditure components of GDP and some of the income components.
* Beginning with 1966, the estimates of employers contributions to state and local government-
sponsored defined contribution pension plans are improved by incorporating new source data.
* Beginning with 1985, the methods for computing financial services provided by commercial
banks are improved to establish a more accurate picture of banking output.
* Beginning with 1993, the estimates of proprietors income are improved by more accurately
accounting for the capital gains and losses attributable to corporate partners.
* Beginning with 1993, the estimates of mortgage interest paid for nonfarm permanent-site
housing are improved by incorporating several new data sources.
A table that summarizes the major sources of revision for selected NIPA components is available on
BEAs Web site at www.bea.gov/gdp-revisions.
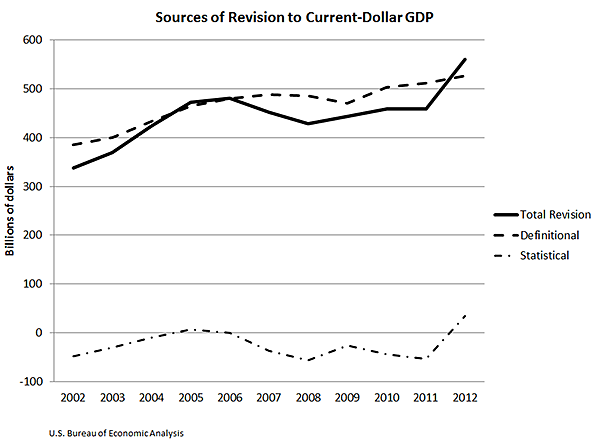
Effects of improvements on major aggregates. The improvements and the new and revised
source data incorporated with this comprehensive revision have notable effects on current-dollar NIPA
aggregates without changing broad economic trends or the general patterns of business cycles. In the
aggregate, changes in definitions (mainly the recognition of new forms of fixed investment) have the
largest effect on current-dollar GDP and GDI for 19292012, and statistical changes (improved data and
methodologies) tend to have smaller effects. For example, for 2012, the level of current-dollar GDP was
revised up $559.8 billion; $526.0 billion of this upward revision resulted from definitional changes.
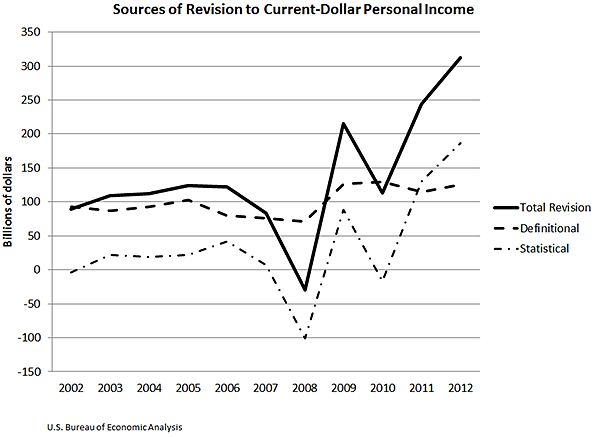
      Changes in definitions (mainly accrual accounting for defined benefit pension plans, which
credits households with the value of accrued benefits from these plans) raise personal income and
personal saving; statistical changes have mixed effects on personal income and on personal saving.
      News release tables.  This release includes the tables that will be regularly shown in future GDP
news releases; in addition, special tables have been included to highlight the effects of the
comprehensive revision.  The special tables are:

*	Tables 1A, 2A, and 4A compare revised and previously published estimates for percent changes
        in real GDP, for contributions to percent change in real GDP, and for percent changes in chain-
        type price indexes for GDP and related measures, respectively;

*	Tables 7A, 7B, and 7C show annual levels, percent changes, and revisions to percent changes for
        current-dollar GDP, for real (chained-dollar) GDP, and for chain-type price indexes for GDP,
        respectively;

*	Table 12C shows revisions to corporate profits by industry.

      Most of the tables show annual estimates beginning with 2002; quarterly estimates (if shown)
begin with the first quarter of 2007.  Three of the regular tables -- tables 3, 11, and 12 -- are split into A
and B segments in this release to accommodate this longer-than-usual time span.

      With this release, selected NIPA tables are available on BEAs Web site.  Most of the remaining
NIPA tables will be available later in August.


Box.________

                                         New and revised data

      The revised estimates reflect the incorporation of newly available and revised source data.  The
most important source data that affect the estimates are BEAs benchmark 2007 input-output (I-O)
accounts.  The revised estimates also incorporate data on inventories, on receipts and expenses of
business establishments and of governments, on sales by detailed commodity and by product line, on
final industry and product shipments from the 2007 Economic Census, and on trade margins from both
the 2007 Economic Census and the 2007 annual surveys of merchant wholesale and of retail trade.  In
addition, the revised estimates incorporate monthly and annual Census Bureau industry data on
manufacturing, on wholesale trade, and on retail trade for 2003 forward.  The revised estimates also
reflect data on housing from the 2010 decennial Census of Population and Housing.  Estimates that are
based on BEAs international transactions accounts (ITAs) -- primarily net exports of goods and services
and rest-of-the-world income receipts and payments -- were revised to reflect improvements to the ITAs
that were introduced since 2009.  Estimates of underreported income were revised using Internal
Revenue Service (IRS) National Research Program data for 2006.  Other data that were incorporated
include revised data on the expenditures and receipts of state and local governments for fiscal years
20062009 from the Census Bureau.

      The revised estimates for 20102012 also reflect the incorporation of newly available and
revised source data that became available since the last annual NIPA revision in July 2012.  The most
important of these data sources are Census Bureau annual surveys of state and local governments for
fiscal year 2010 (revised) and fiscal year 2011 (preliminary), of manufactures for 2010 (revised) and
2011 (preliminary), of merchant wholesale trade and of retail trade for 2010 (revised) and 2011
(preliminary), and of services and of the value of construction spending for 2010 and 2011 (revised) and
2012 (preliminary); federal government budget data for fiscal years 2012 and 2013 (revised); Bureau of
Labor Statistics (BLS) quarterly census of employment and wages (QCEW) for 20102012 (revised);
IRS tabulations of corporate tax returns for 2010 (revised) and 2011 (preliminary) and of sole
proprietorship and partnership tax returns for 2011; and U.S. Department of Agriculture (USDA) farm
statistics for 20102012 (revised).

      Data from BEAs annual revision of the ITAs were incorporated for 20102012 for most
components at their "best level;" revisions for earlier years, along with data from the June 2014 revision
of the ITAs, will be incorporated in the NIPAs in the 2014 annual revision.
_______________
FOOTNOTE.______
The 2007 benchmark input-output accounts are scheduled for release in December 2013. At that time, BEA will
also release the comprehensive revision of the annual industry accounts, which will be consistent with this
comprehensive revision of the NIPAs.
_______________

The revisions

      For this comprehensive revision, many current-dollar estimates were revised back to 1929, the
earliest year for which NIPA estimates are available, as a result of changes in definitions, in
classifications, and in presentations.

      Real GDP growth.  For 19292012, the average annual growth rate of real GDP was 3.3
percent, 0.1 percentage point higher than in the previously published estimates.  For the more recent
period, 20022012, the average annual growth rate was 1.8 percent, 0.2 percentage point higher than in
the previously published estimates.  For the most recent years, 20092012, the average annual growth
rate of real GDP was 2.4 percent, 0.3 percentage point higher than in the previously published estimates.
For the 3 most recent years, the annual growth rate:

*	was revised up from 2.4 percent to 2.5 percent for 2010,
*	was unrevised at 1.8 percent for 2011, and
*	was revised up from 2.2 percent to 2.8 percent for 2012.

      Real GDI growth.  For 19292012, the average annual growth rate of real GDI was 3.3 percent,
0.1 percentage point higher than in the previously published estimates.  For the more recent period,
20022012, the average annual growth rate was 1.8 percent, 0.2 percentage point higher than in the
previously published estimates.  For the most recent years, 20092012, the average annual growth rate
of real GDI was 2.6 percent, 0.3 percentage point higher than in the previously published estimates.  For
the 3 most recent years, the annual growth rate:

*	was revised down from 3.1 percent to 2.7 percent for 2010,
*	was revised up from 1.8 percent to 2.5 percent for 2011, and
*	was revised up from 2.2 percent to 2.5 percent for 2012.

      Business cycles.  For the contraction that lasted from the fourth quarter of 2007 to the second
quarter of 2009, real GDP decreased at a 2.9 percent annual rate; in the previously published estimates,
it decreased 3.2 percent.  The cumulative decrease in real GDP (not at an annual rate) was 4.3 percent; in
the previously published estimates, the cumulative decrease was 4.7 percent.  In the revised estimates,
real GDP decreased in the first, third, and fourth quarters of 2008 and in the first and second quarters of
2009.

      For the expansion from the second quarter of 2009 to the first quarter of 2013, real GDP
increased at a 2.2 percent annual rate; in the previously published estimates, it increased 2.1 percent.
From the third quarter of 2009 to the first quarter of 2013, real GDP increased in all quarters except for
the first quarter of 2011, when real GDP decreased 1.3 percent; in the previously published estimates,
real GDP increased in all quarters during this period.  Earlier business cycles show little revision.

      Price changes.  The revisions to major price indexes are small.  For 19292012, the average
annual increase in the price index for gross domestic purchases was revised down from 3.0 percent to
2.9 percent; the average annual increase in the price index for GDP was unrevised at 2.9 percent.  For
20022012, the average annual increase in the price index for gross domestic purchases was revised
down from 2.4 percent to 2.3 percent; the average annual increase in the price index for GDP was
revised down from 2.3 percent to 2.1 percent.  For 20092012, the average annual increase in the price
index for gross domestic purchases was revised down from 1.9 percent to 1.8 percent; the average
annual increase in the price index for GDP was revised down from 1.8 percent to 1.6 percent.

      For 19292012, the average annual increase in the price index for personal consumption
expenditures (PCE) was unrevised at 2.9 percent.  For 20022012, the average annual increase in the
PCE price index was revised down from 2.2 percent to 2.1 percent.  For 20092012, the average annual
increase in the PCE price index was unrevised at 2.0 percent.

      Real disposable personal income (DPI) growth.  For 19292012, the average annual increase
in real DPI was 3.2 percent, 0.1 percentage point higher than in the previously published estimates.  For
20022012, the average annual increase was 2.0 percent, 0.2 percentage point higher than in the
previously published estimates.  For 20092012, the average annual increase was 1.8 percent, 0.2
percentage point higher than in the previously published estimates.

      Personal saving.  Personal saving (DPI less personal outlays) was revised up for 19292007,
down for 2008, and up for 20092012.  These revisions reflect the revisions to DPI and are mainly the
result of adopting the accrual treatment of defined benefit pension plans.  The personal saving rate
(personal saving as a percentage of DPI) was revised up for 19292007, down for 2008, and up for
20092012, reflecting the revisions to personal saving.


Revisions to current-dollar estimates

      The revisions to current-dollar GDP, to personal income and its disposition, and to national
income are shown in table 1B.  This table shows the "revisions in level," that is, the revised estimates
less the previously published estimates; table 1B also shows the revisions as a percent of the previously
published estimates for selected years.  The revised levels of annual GDP and its major components for
19652012, along with percent changes from the preceding year and revisions to the percent changes,
are shown in table 7A.

      GDP.  Current-dollar GDP was revised up for all years (19292012).  The upward revisions to
current-dollar GDP mainly reflect the recognition of additional expenditures -- for R&D; for the creation
of entertainment, literary, and artistic originals; and for an expanded set of ownership transfer costs -- as
fixed investment (see "Revision Analysis for GDP, 2012").  The new accrual treatment for government-
sponsored defined benefit pension plans results in revisions to current-dollar GDP through revisions to
supplements to wages and salaries for government employees (specifically, employer contributions for
employee pension and insurance funds); these revisions are upward for 19291978, downward for
19791991, and upward for 19922012.


Box._______

                                             Revision Analysis for GDP, 2012
                                              (Billions of current dollars)

Total Revision                                                                             559.8

Due to major definitional changes                                                          526.0

Capitalization of research and development                                                 396.7
Capitalization of entertainment, literary, and artistic originals                           74.3
Expanded set of ownership transfer costs for residential fixed assets                       42.3
Accrual accounting for defined benefit pension programs                                     12.6

Due to statistical changes                                                                  33.8

___________

      PCE.  Revisions to PCE are generally small before 1985; PCE was revised up for 1985 and
1986, down for 19872011, and up for 2012.  PCE for services accounts for most of the revisions for all
years except for 2011.

      Services.  PCE for services was revised up for 1985 and 1986, down for 19872010, and up for
2011 and 2012.  For most years beginning with 1985, the improved method for estimating services of
commercial banks results in downward revisions to PCE for financial services.  For 19652012 (and for
several prior years), the gross output of NPISH was revised down; the removal of R&D expenses of
NPISH (and their reclassification as fixed investment) more than offsets the addition to expenses of
consumption of fixed capital (CFC) for R&D capital.  The revisions also reflect the incorporation of the
2007 benchmark I-O accounts, of new and revised annual Census Bureau surveys of services, and of
other new and revised source data.

      Goods.  Revisions to PCE for goods begin with 1998 and follow a mixed pattern, with
downward revisions for 20102012.  The revisions to PCE for goods reflect the incorporation of the
2007 benchmark I-O accounts, of new and revised data from the Census Bureaus retail trade surveys,
and of other new and revised source data.

      Private fixed investment.  Current-dollar private fixed investment was revised up for 1929
2012.  The upward revisions reflect the recognition of additional expenditures -- for R&D; for the
creation of entertainment, literary, and artistic originals; and for an expanded set of ownership transfer
costs -- as fixed investment.

      Nonresidential structures.  The downward revisions for 20032012 primarily reflect the
incorporation of data from the 2007 benchmark I-O accounts, of revised footage drilled and expenditure
data from the Census Bureau and trade sources, and of revised Census Bureau construction spending
data.

      Equipment.   Software is now classified as part of intellectual property products rather than as
part of private equipment and software.  Private equipment (without software) was revised up for 2003
2012, reflecting the incorporation of BEAs 2007 benchmark I-O accounts, of new and revised Census
Bureau surveys of manufactures, and of other new and revised source data.

      Residential fixed investment.  The upward revisions to residential fixed investment for 1929
2012 mainly reflect the recognition of an expanded set of ownership transfer costs for residential fixed
assets as fixed investment.  The revisions also reflect the incorporation of data from the 2007 benchmark
I-O accounts and of new and revised data from the Census Bureau surveys of construction spending.

      Intellectual property products.  Beginning with this comprehensive revision, the NIPA tables
include a new category of fixed investment, "intellectual property products."  The recognition of
expenditures for R&D and for the creation of entertainment, literary, and artistic originals as fixed
investment results in upward revisions to gross private domestic investment.  The downward revisions to
software investment for 20102012 (and small revisions for 20032009) reflect the incorporation of the
2007 benchmark I-O accounts and of new and revised annual Census Bureau surveys of services.
      Change in private inventories.  The revisions begin with 2002 and are mostly upward; the
revisions are dominated by revisions to nonfarm inventories for 20022010 and by farm inventories for
2011 and 2012.  The revisions to nonfarm inventories reflect data from a variety of sources, including
newly available and revised Census Bureau data on inventory book values, and the incorporation of new
commodity price weights from the 2007 benchmark I-O accounts.  The revisions to farm inventories
reflect revised USDA farm statistics for 20102012.

      Exports and imports of goods and services.  Revisions to net exports of goods and services are
generally small before 2002; the revisions are upward for 20022007, downward for 20082011, and
upward for 2012.  The revisions to net exports are mostly due to revisions to exports for 20022009 and
for 2012 and are mostly due to revisions to imports for 2010 and 2011.  Exports were revised up for
20022007, down for 20082010, and up for 2011and 2012.  The revisions to imports are upward for
2010 and 2011 and are small for other years.  The estimates reflect the incorporation of revised data
from BEAs ITAs for 19992012.

      Government consumption expenditures and gross investment.  Government consumption
expenditures and gross investment was revised up for 19292012.  The revisions mainly reflect the
recognition of expenditures for R&D as fixed investment and the addition to consumption expenditures
of the CFC for R&D assets.

      Federal government.  The upward revisions to federal government consumption expenditures
and gross investment for 19292012 mainly reflect the recognition of expenditures for R&D as fixed
investment.  The new accrual treatment for defined benefit pension plans results in upward revisions to
contributions for employee pension and insurance funds for 19291979 and downward revisions for
19802012.  The revisions also reflect improved source data and methods, including revised federal
budget data for 2012 and 2013.

      State and local government.  State and local government consumption expenditures and gross
investment was revised up for 19291975, down for 19761988, and up for 19892012.  These revisions
mainly reflect the new accrual approach for measuring state and local government-sponsored defined
benefit pension plans, which results in revisions to state and local government contributions for
employee pension and insurance funds that are upward for 19291978, downward for 19791986, and
upward for 19872012.  Revisions also result from statistical changes, including the incorporation of
improved source data on expenditures for defined contribution pension plans and the improved method
for estimating services of commercial banks.  The revisions also reflect the incorporation of the 2007
benchmark I-O accounts, of new and revised government finances data from the Census Bureau, and of
other new and revised source data.

      Personal income.   Personal income was revised up for 19292007, down for 2008, and up for
20092012.  These revisions mainly reflect the accrual approach for measuring defined benefit pension
plans, which results in upward revisions to personal income receipts on assets for 19292012 and in
upward revisions to supplements (specifically, employer contributions for employee pension and
insurance funds) for 19291975, for 19892002, and for 20042011.  A number of other definitional
and statistical changes affected the revisions to personal income.  The revisions to the components of
personal income are discussed below.
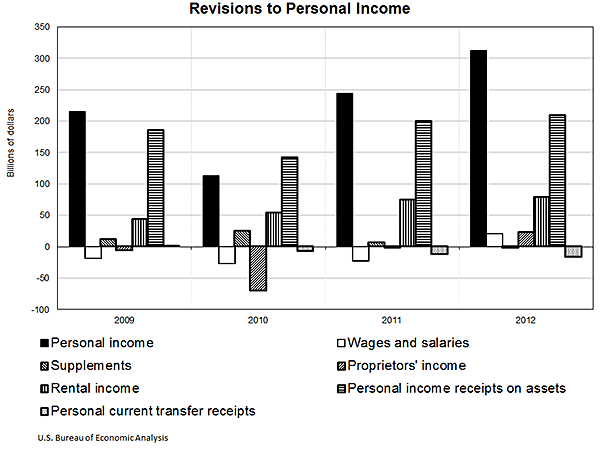
      Wages and salaries.  The revisions mainly reflect revisions to private wages and salaries.  The
revisions are generally small and mixed for years prior to 2002, are downward for 20022011, and are
upward for 2012.  The revisions reflect revised estimates of misreporting and new and revised BLS
QCEW data.

      Supplements to wages and salaries.  The revisions to supplements reflect the revisions to
employer contributions for pension and insurance funds that result from the accrual approach for
measuring defined benefit pension plans.  Employer contributions for state and local government
defined benefit plans was revised up for 19291978, down for 19791986, and up for 19872012.
Employer contributions for federal government defined benefit plans was revised up for 19291979 and
down for 19802012.  Employer contributions for private defined benefit plans was revised down for
19681985, up for 19862001, down for 20022006, up for 2007, and down for 20082012.
Contributions for state and local government defined contribution pension plans was revised up for
19672012, reflecting the incorporation of improved source data.

      Proprietors income.  Proprietors income was revised down for 19652011 and up for 2012;
the revisions for years before 1965 are small.  Nonfarm proprietors income was revised down for 1965
2011 and up for 2012.  The revisions to proprietors income primarily reflect revisions to nonfarm
proprietors income for most years (except for 2009 and for 2012).  Farm proprietors income had
relatively large upward revisions for 2011 and 2012, reflecting the incorporation of revised USDA data
for 20102012.

      The revisions to nonfarm proprietors income reflect a number of definitional and statistical
changes as well as revised source data.  Revisions due to the improved accounting for the capital gains
and losses attributable to corporate partners are downward for 20022008, upward for 2009, and
downward for 20102012.  Revisions due to the capitalization of expenditures for the creation of
entertainment, literary, and artistic originals and for an expanded set of ownership transfer costs are
downward, while the revisions due to the capitalization of R&D expenditures are upward.  The revisions
also reflect new IRS estimates for underreporting of income as well as new IRS tabulations of tax return
data for sole proprietorships and partnerships for 2011.

      Rental income of persons.  Rental income of persons was revised down for 19292002 and was
revised up for 2003 forward.  The improved methodology for estimating mortgage interest paid for
nonfarm permanent site housing results in downward revisions to rental income of persons for 1993
2001 and upward revisions for 20022012.  The recognition of an expanded set of ownership transfer
costs for residential assets as fixed investment results in downward revisions for all years, partly
offsetting the upward revisions to rental income of persons for 20032012.  The revisions also reflect
revisions to owner- and tenant-occupied space rent, based on data from the 2010 Census of Housing and
the incorporation of other new and revised source data.

      Personal interest income.  Personal interest income was revised up for all years except for
2008.  The upward revisions mainly reflect the new accrual treatment of defined benefit pension plans.
Personal interest income was also affected by several other changes in methodology, including an
improved method for distributing the investment income of regulated investment companies by type of
income and the improved method for measuring interest associated with financial services of
commercial banks.  Revisions to personal interest income also reflect the incorporation of new and
revised source data from the Federal Reserve Board and other sources.

      Personal dividend income.  Personal dividend income was revised up for most years for 1991
2009, was revised down for 2010, was revised up for 2011, and was revised down for 2012.  The
revisions to personal dividend income reflect the improved method for distributing the investment
income of regulated investment companies by type of income as well as the incorporation of new and
revised IRS tabulations of corporate tax returns and of data from BEAs ITAs on dividends from the rest
of the world.

      Personal current transfer receipts.  Personal current transfer receipts was revised down for
2002, up for 20032009, and down for 20102012.  The revisions reflect the incorporation of new and
revised source data.

      Contributions for government social insurance.  The revisions to contributions for
government social insurance (which is deducted in the calculation of personal income) are small for
20022012.

      Personal current taxes.  Personal current taxes was revised up for 2011 and 2012; revisions are
generally small for prior years.  The revisions reflect the incorporation of new tax collections data from
the Treasury Department and the Social Security Administration and of new and revised Census Bureau
state and local government finances data.

      Disposable personal income.  The pattern of revisions to disposable personal income, which is
equal to personal income less personal current taxes, is similar to that of personal income.

      Personal outlays.  This series consists of PCE, personal interest payments, and personal current
transfer payments.  The revisions to personal outlays primarily reflect the revisions to PCE that were
previously described.  Personal interest payments was revised up for 1985 forward; revisions for prior
years are small.  The revisions to personal interest payments result from the improved method for
measuring the financial services of commercial banks and associated interest income from the
incorporation of new and revised source data.  Personal current transfer payments was revised down for
20072012.

      GDI.  Current-dollar GDI, like current-dollar GDP, was revised up for all years for 19292012.
The upward revisions to current-dollar GDI and GDP mainly reflect the recognition of additional
expenditures -- for R&D; for the creation of entertainment, literary, and artistic originals; and for an
expanded set of ownership transfer costs -- as fixed investment.

      National income.  National income was revised up for 19291978, down for 19792001, up for
20022004, down for 20052010, and up for 2011 and 2012.  The revisions to national income reflect
the revisions to the components of national income that were previously described; the revisions to the
remaining components of national income are discussed below.
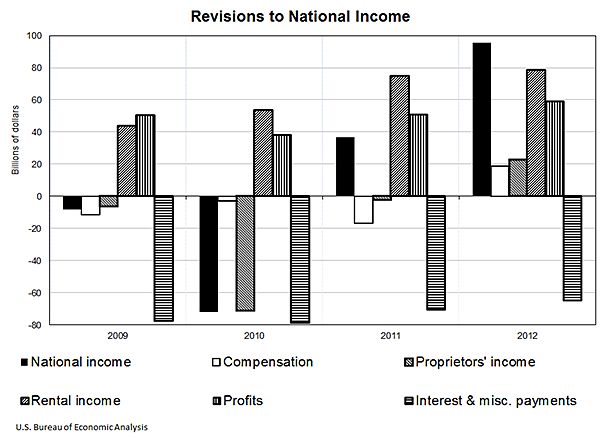
      Corporate profits with inventory valuation and capital consumption adjustments.
Corporate profits was revised up for 19291986, down for 19872001, and up for 20022012.
Revisions to corporate profits due to the capitalization of expenditures for R&D and for the creation of
entertainment, literary, and artistic originals are upward for 19292012.  Revisions to corporate profits
due to the new accrual treatment of defined benefit pension plans are upward for 19681985, downward
for 19862002, upward for 20032006, downward for 20072009, and upward for 20102012.  The
improved method for distributing the investment income of regulated investment companies by type of
income results in revisions that are downward for 19922001, upward for 2002, and downward for
20032012.  The revisions to corporate profits also reflect the incorporation of new and revised IRS
tabulations of corporate tax return data and of new and revised data from BEAs ITAs and from other
sources.

      Net interest and miscellaneous payments.  Net interest and miscellaneous payments was
revised up for most years for 19652001 and down for 20022012.  Revisions for years prior to 1965
are small.  The revisions reflect the incorporation of several definitional and statistical improvements,
including the new accrual treatment of defined benefit pension plans, the improved method for
distributing the investment income of regulated investment companies by type of income, the improved
methodology for estimating mortgage interest paid for nonfarm permanent site housing, and the
improved method for measuring the financial services of commercial banks, and the incorporation of
new and revised data from a number of sources.

      Consumption of fixed capital (CFC).  CFC was revised up substantially for 19292012.  The
upward revisions to CFC reflect the addition of CFC for R&D; for the creation of entertainment, literary,
and artistic originals; and for an expanded set of ownership transfer costs of residential assets.  In
addition, CFC was revised up to reflect a faster depreciation rate of brokers commissions on residential
structures.  The revisions to CFC also reflect statistical improvements and revisions to BEAs estimates
of fixed investment and prices.

      Statistical discrepancy.  The statistical discrepancy, which is the difference between GDP and
GDI, was revised for 19292012.  The directions of the revisions are mixed for 19292000; the
statistical discrepancy was revised down for 20012003, was revised up for 20042008, was revised
down for 2009, was revised up for 2010, and was revised down for 2011 and 2012.  (In theory, GDP
should equal GDI; in practice, they differ because their components are estimated using largely
independent and less-than-perfect source data.)


Box._______
                    Availability of Revised Estimates and Related Information

Revised estimates for selected NIPA tables are on BEA's Web site:
www.bea.gov

The comprehensive revision was previewed in a series of articles in the Survey of Current Business;
the articles are also available on BEA's Web site:
www.bea.gov/gdp-revisions

The release schedule for revised NIPA tables is available at
www.bea.gov/national/table_schedule_20130606.htm
___________


      BEA's national, international, regional, and industry estimates; the Survey of Current Business;
and BEA news releases are available without charge on BEA's Web site at www.bea.gov.  By visiting
the site, you can also subscribe to receive free e-mail summaries of BEA releases and announcements.


                                         *          *          *


                             Next release -- August 29, 2013, at 8:30 A.M. EDT for:
                          Gross Domestic Product:  Second Quarter 2013 (Second Estimate)
                            Corporate Profits:  Second Quarter (Preliminary Estimate)


                                            Comparisons of Revisions to GDP

     Quarterly estimates of GDP are released on the following schedule:  the "advance" estimate, based on
source data that are incomplete or subject to further revision by the source agency, is released near the end of the
first month after the end of the quarter; as more detailed and more comprehensive data become available,
the "second" and "third" estimates are released near the end of the second and third months, respectively.
The "latest" estimate reflects the results of both annual and comprehensive revisions.

     Annual revisions, which generally cover the quarters of the 3 most recent calendar years, are usually carried
out each summer and incorporate newly available major annual source data.  Comprehensive (or benchmark)
revisions are carried out at about 5-year intervals and incorporate major periodic source data, as well as
improvements in concepts and methods that update the accounts to portray more accurately the evolving U.S.
economy.

The table below shows comparisons of the revisions between quarterly percent changes of current-dollar
and of real GDP for the different vintages of the estimates.  From the advance estimate to the second estimate (one
month later), the average revision to real GDP without regard to sign is 0.5 percentage point, while from the
advance estimate to the third estimate (two months later), it is 0.6 percentage point.  From the advance estimate to
the latest estimate, the average revision without regard to sign is 1.3 percentage points.  The average revision
(with regard to sign) from the advance estimate to the latest estimate is 0.2 percentage point, which is larger
than the average revisions from the advance estimate to the second or to the third estimates.  The larger average
revisions to the latest estimate reflect the fact that comprehensive revisions include major improvements, such as
the incorporation of BEAs latest benchmark input-output accounts.  The quarterly estimates correctly indicate the
direction of change of real GDP 97 percent of the time, correctly indicate whether GDP is accelerating or
decelerating 72 percent of the time, and correctly indicate whether real GDP growth is above, near, or below trend
growth more than four-fifths of the time.

                           Revisions Between Quarterly Percent Changes of GDP: Vintage Comparisons
                                                     [Annual rates]

       Vintages                                   Average         Average without     Standard deviation of
       compared                                                    regard to sign      revisions without
                                                                                         regard to sign

____________________________________________________Current-dollar GDP_______________________________________________

Advance to second....................               0.2                 0.6                  0.4
Advance to third.....................                .1                  .7                   .4
Second to third......................                .0                  .3                   .2

Advance to latest....................                .3                 1.2                  1.0

________________________________________________________Real GDP_____________________________________________________

Advance to second....................               0.1                 0.5                  0.4
Advance to third.....................                .1                  .6                   .5
Second to third......................                .0                  .2                   .2

Advance to latest....................                .2                 1.3                  1.0

NOTE.  These comparisons are based on the period from 1983 through 2009.