
News Release
U.S. International Investment Position, 2nd quarter 2017
The U.S. net international investment position increased to -$7,934.9 billion (preliminary) at the end of the second quarter of 2017 from -$8,091.6 billion (revised) at the end of the first quarter, according to statistics released today by the Bureau of Economic Analysis (BEA). The $156.7 billion increase reflected a $1,004.2 billion increase in U.S. assets and an $847.5 billion increase in U.S. liabilities (table 1).
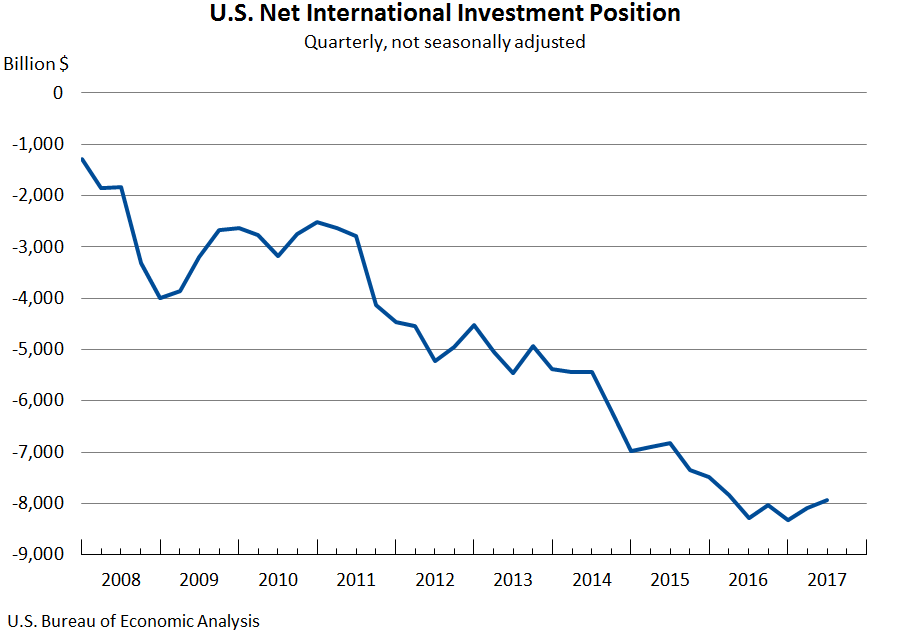
The $156.7 billion increase reflected net financial transactions of –$107.5 billion and net other changes in position, such as price and exchange-rate changes, of $264.2 billion (table A).
The net investment position increased 1.9 percent in the second quarter, compared with an increase of 2.7 percent in the first quarter, and an average quarterly decrease of 5.6 percent from the first quarter of 2011 through the fourth quarter of 2016.
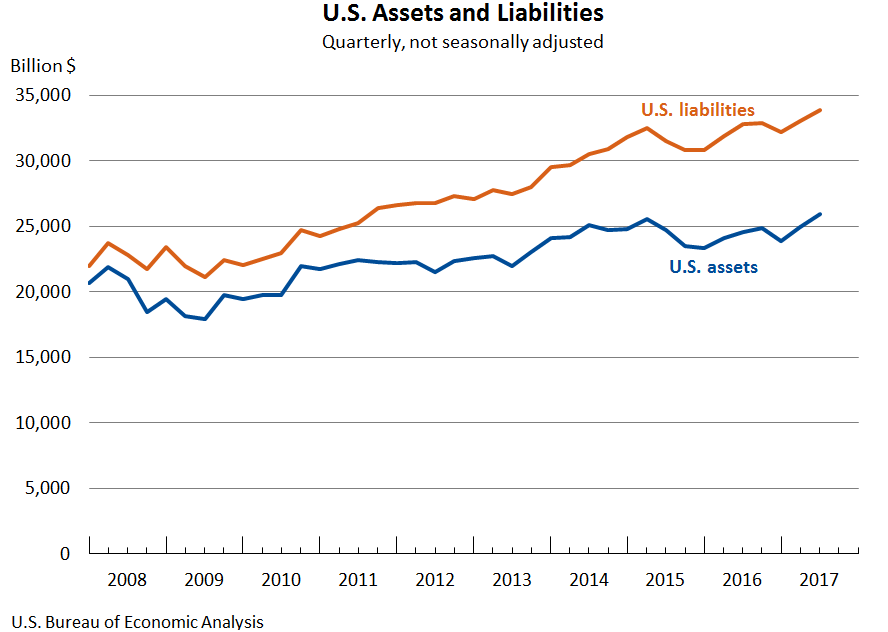
U.S. assets increased $1,004.2 billion to $25,937.6 billion at the end of the second quarter, mostly reflecting increases in portfolio investment and direct investment assets.
- Assets excluding financial derivatives increased $1,019.6 billion to $24,006.3 billion. The increase resulted from other changes in position of $657.3 billion and financial transactions of $362.2 billion (table A). Other changes in position mostly reflected the appreciation of major foreign currencies against the U.S. dollar that raised the value of assets in dollar terms. Financial transactions mostly reflected net acquisition of portfolio investment and direct investment equity assets.
| Position, 2017:I | Change in position in 2017:II | Position, 2017:II | |||
|---|---|---|---|---|---|
| Total | Attributable to: | ||||
| Financial transactions | Other changes in position 1 | ||||
| U.S. net international investment position | -8,091.6 | 156.7 | -107.5 | 264.2 | -7,934.9 |
| Net position excluding financial derivatives | -8,133.3 | 161.3 | -116.8 | 278.1 | -7,972.0 |
| Financial derivatives other than reserves, net | 41.6 | -4.6 | 9.3 | -13.9 | 37.1 |
| U.S. assets | 24,933.4 | 1,004.2 | (2) | (2) | 25,937.6 |
| Assets excluding financial derivatives | 22,986.7 | 1,019.6 | 362.2 | 657.3 | 24,006.3 |
| Financial derivatives other than reserves | 1,946.7 | -15.4 | (2) | (2) | 1,931.3 |
| U.S. liabilities | 33,025.0 | 847.5 | (2) | (2) | 33,872.5 |
| Liabilities excluding financial derivatives | 31,120.0 | 858.3 | 479.1 | 379.2 | 31,978.2 |
| Financial derivatives other than reserves | 1,905.1 | -10.8 | (2) | (2) | 1,894.3 |
| 1 Disaggregation of other changes in position into price changes, exchange-rate changes, and other changes in volume and valuation is only presented for annual statistics released in June each year. | |||||
| 2 Financial transactions and other changes in financial derivatives positions are available only on a net basis; they are not separately available for U.S. assets and U.S. liabilities. | |||||
U.S. liabilities increased $847.5 billion to $33,872.5 billion at the end of the second quarter, mostly reflecting increases in portfolio investment and direct investment liabilities.
- Liabilities excluding financial derivatives increased $858.3 billion to $31,978.2 billion. The increase resulted from financial transactions of $479.1 billion and other changes in position of $379.2 billion (table A). Financial transactions mostly reflected net incurrence of portfolio investment liabilities. Other changes in position mostly reflected price increases on portfolio investment and direct investment liabilities.
| Preliminary estimate | Revised estimate | |
|---|---|---|
| U.S. net international investment position | −8,141.2 | −8,091.6 |
| U.S. assets | 24,833.2 | 24,933.4 |
| Direct investment at market value | 7,843.6 | 7,895.4 |
| Portfolio investment | 10,570.2 | 10,591.6 |
| Financial derivatives other than reserves | 1,946.7 | 1,946.7 |
| Other investment | 4,039.6 | 4,066.6 |
| Reserve assets | 433.1 | 433.1 |
| U.S. liabilities | 32,974.5 | 33,025.0 |
| Direct investment at market value | 7,952.4 | 7,952.4 |
| Portfolio investment | 17,859.8 | 17,908.3 |
| Financial derivatives other than reserves | 1,905.1 | 1,905.1 |
| Other investment | 5,257.2 | 5,259.2 |
Next release: December 28, 2017 at 8:30 A.M. EST
- U.S. Net International Investment Position, Third Quarter 2017