
News Release
Gross Domestic Product by Industry, 1st Quarter 2020
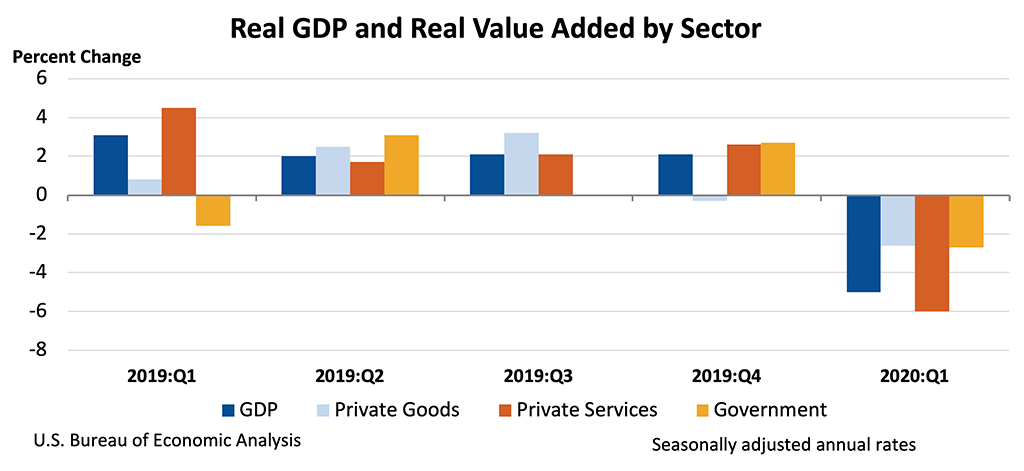
Accommodation and food services; finance and insurance; and health care and social assistance industries were the leading contributors to the 5.0 percent (annual rate) decrease in gross domestic product (GDP) in the first quarter of 2020, according to the Bureau of Economic Analysis. All sectors of the U.S. economy contributed to the decrease, led by a decline in private services-producing industries.
The decline in first-quarter GDP reflected the response to the spread of COVID-19, as governments issued "stay-at-home" orders in March. This led to rapid changes in production, as businesses and schools switched to remote work or canceled operations, and consumers and businesses canceled, restricted, or redirected their spending. The full economic effects of the COVID-19 pandemic cannot be quantified in the GDP estimate for the first quarter of 2020 because the impacts are generally embedded in source data and cannot be separately identified. For more information, see "Federal Recovery Programs and BEA Statistics: COVID-19 and Recovery" on the BEA website.
Real value added by industry
Overall, 17 of 22 industry groups contributed to the first-quarter decline in real GDP. Of the five industry groups that offset the decline in the first-quarter real GDP, agriculture, forestry, fishing, and hunting was the largest contributor, increasing 15.5 percent.
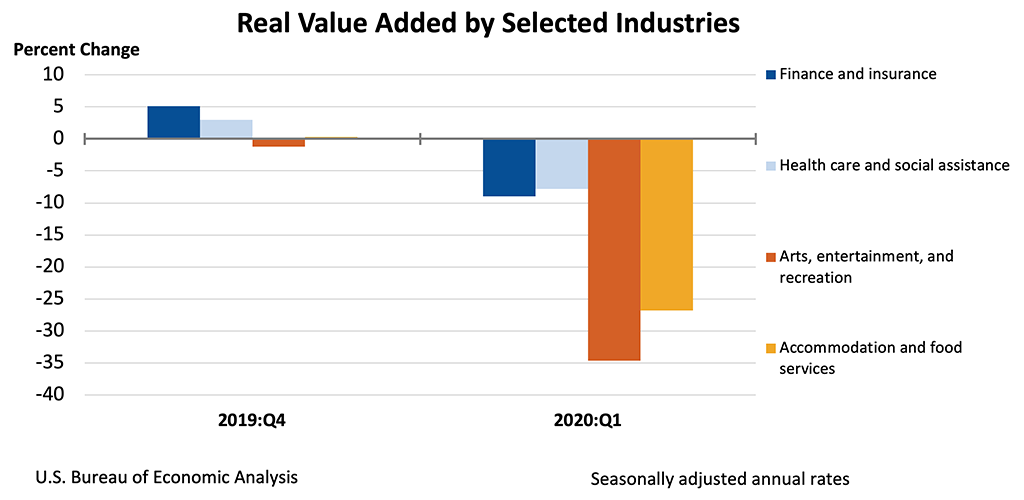
- For accommodation and food services, real value added—a measure of an industry's contribution to GDP—decreased 26.8 percent in the first quarter, primarily reflecting a decrease in food services and drinking places.
- Finance and insurance decreased 9.0 percent in the first quarter. The largest contributor to the decrease was insurance carriers and related activities.
- Health care and social assistance decreased 7.8 percent in the first quarter, primarily reflecting decreases in ambulatory health care services and in hospitals.
- Arts, entertainment, and recreation decreased 34.7 percent in the first quarter, primarily reflecting a decrease in performing arts, spectator sports, museums, and related activities.
Gross output by industry
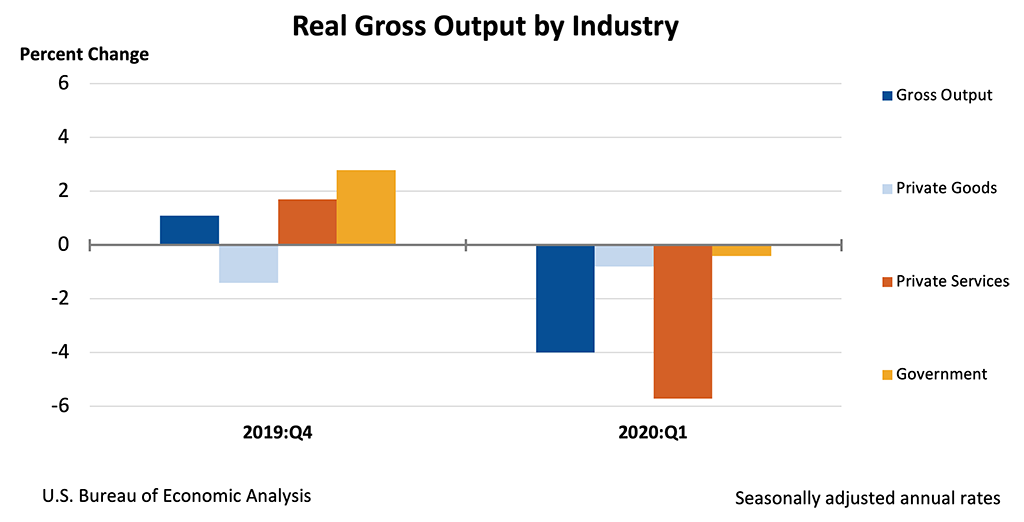
Real gross output—principally a measure of an industry's sales or receipts, which includes sales to final users in the economy (GDP) and sales to other industries (intermediate inputs)—decreased 4.0 percent in the first quarter. This reflected a decrease of 5.7 percent for the private services-producing sector, a decrease of 0.8 percent for the private goods-producing sector, and a decrease of 0.4 percent for the government sector. Overall, 16 of 22 industry groups contributed to the decrease in real gross output.
***
Next release – September 30, 2020 at 8:30 A.M. EDT for:
Gross Domestic Product by Industry: Second Quarter 2020
Annual Update of the Industry Economic Accounts
BEA is speeding up the release of its industry and state GDP statistics to coordinate more closely with the quarterly estimates of national GDP. Starting on September 30, industry GDP statistics will be issued on the same day – and in the same news release – as the third estimate of national GDP. State-by-state GDP statistics will follow in a separate news release within two days. These three major dimensions of GDP will be synchronized to cover the same quarter, giving users a fuller and more timely view of the U.S. economy.