
News Release
U.S. International Trade in Goods and Services, June 2020
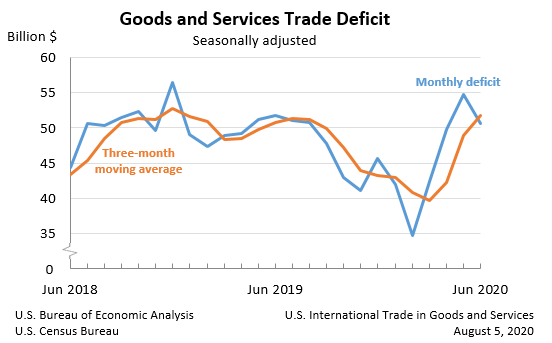
The U.S. Census Bureau and the U.S. Bureau of Economic Analysis announced today that the goods and services deficit was $50.7 billion in June, down $4.1 billion from $54.8 billion in May, revised.
| Deficit: | $50.7 Billion | -7.5%° |
| Exports: | $158.3 Billion | +9.4%° |
| Imports: | $208.9 Billion | +4.7%° |
|
Next release: September 3, 2020 (°) Statistical significance is not applicable or not measurable. Data adjusted for seasonality but not price changes Source: U.S. Census Bureau, U.S. Bureau of Economic Analysis; U.S. International Trade in Goods and Services, August 5, 2020 |
||
Exports and imports increased in June following monthly declines since March that were, in part, due to the impact of COVID-19, as many businesses were operating at limited capacity or ceased operations completely, and the movement of travelers across borders was restricted. The full economic effects of the COVID-19 pandemic cannot be quantified in the trade statistics for June because the impacts are generally embedded in source data and cannot be separately identified. The Census Bureau and the Bureau of Economic Analysis have monitored data quality and determined estimates in this release meet publication standards. For more information on the impact of COVID-19 on the statistics, see the frequently asked questions on goods from the Census Bureau and on services from BEA.
Exports, Imports, and Balance (exhibit 1)
June exports were $158.3 billion, $13.6 billion more than May exports. June imports were $208.9 billion, $9.5 billion more than May imports.
The June decrease in the goods and services deficit reflected a decrease in the goods deficit of $4.0 billion to $72.2 billion and an increase in the services surplus of $0.1 billion to $21.5 billion.
Year-to-date, the goods and services deficit decreased $23.1 billion, or 7.8 percent, from the same period in 2019. Exports decreased $199.1 billion or 15.7 percent. Imports decreased $222.3 billion or 14.2 percent.
Three-Month Moving Averages (exhibit 2)
The average goods and services deficit increased $2.8 billion to $51.8 billion for the three months ending in June.
- Average exports decreased $10.6 billion to $151.4 billion in June.
- Average imports decreased $7.9 billion to $203.1 billion in June.
Year-over-year, the average goods and services deficit increased $1.0 billion from the three months ending in June 2019.
- Average exports decreased $59.1 billion from June 2019.
- Average imports decreased $58.1 billion from June 2019.
Exports (exhibits 3, 6, and 7)
Exports of goods increased $13.0 billion to $102.9 billion in June.
Exports of goods on a Census basis increased $12.9 billion.
- Automotive vehicles, parts, and engines increased $4.9 billion.
- Automotive parts and accessories increased $1.8 billion.
- Passenger cars increased $1.7 billion.
- Capital goods increased $3.8 billion.
- Civilian aircraft increased $0.6 billion.
- Other industrial machinery increased $0.6 billion
- Telecommunications equipment increased $0.5 billion.
- Electric apparatus increased $0.5 billion.
- Industrial supplies and materials increased $2.8 billion.
- Fuel oil increased $0.8 billion.
- Other petroleum products increased $0.5 billion.
- Crude oil increased $0.4 billion.
Net balance of payments adjustments increased $0.1 billion.
Exports of services increased $0.6 billion to $55.4 billion in June.
- Transport increased $0.4 billion.
- Other business services increased $0.1 billion.
Imports (exhibits 4, 6, and 8)
Imports of goods increased $9.0 billion to $175.0 billion in June.
Imports of goods on a Census basis increased $8.5 billion.
- Automotive vehicles, parts, and engines increased $9.7 billion.
- Passenger cars increased $4.1 billion.
- Automotive parts and accessories increased $2.7 billion.
- Trucks, buses, and special purpose vehicles increased $2.1 billion.
- Consumer goods increased $4.7 billion.
- Cell phones and other household goods increased $1.1 billion.
- Gem diamonds increased $0.7 billion.
- Cotton apparel and household goods increased $0.5 billion.
- Artwork and other collectibles increased $0.5 billion.
- Capital goods increased $2.2 billion.
- Computers increased $0.8 billion.
- Telecommunications equipment increased $0.4 billion.
- Electric apparatus increased $0.4 billion.
- Industrial supplies and materials decreased $8.3 billion.
- Nonmonetary gold decreased $5.9 billion.
- Finished metal shapes decreased $2.9 billion.
Net balance of payments adjustments increased $0.5 billion.
Imports of services increased $0.5 billion to $33.9 billion in June.
- Transport increased $0.3 billion.
- Other business services increased $0.1 billion.
- Charges for the use of intellectual property increased $0.1 billion.
Real Goods in 2012 Dollars – Census Basis (exhibit 11)
The real goods deficit decreased $5.2 billion to $81.0 billion in June.
- Real exports of goods increased $13.1 billion to $120.0 billion.
- Real imports of goods increased $7.8 billion to $201.0 billion.
Revisions
Revisions to May exports
- Exports of goods were revised down $0.1 billion.
- Exports of services were revised up $0.3 billion.
Revisions to May imports
- Imports of goods were revised up less than $0.1 billion.
- Imports of services were revised up $0.4 billion.
Goods by Selected Countries and Areas: Monthly – Census Basis (exhibit 19)
The June figures show surpluses, in billions of dollars, with South and Central America ($1.8), United Kingdom ($1.3), Hong Kong ($1.0), OPEC ($0.5), and Brazil ($0.4). Deficits were recorded, in billions of dollars, with China ($26.7), European Union ($13.1), Mexico ($9.0), Germany ($3.8), Taiwan ($2.4), Italy ($2.1), South Korea ($1.9), Japan ($1.8), India ($1.7), France ($1.0), Saudi Arabia ($0.7), Singapore ($0.2), and Canada ($0.1).
- The deficit with Japan decreased $1.4 billion to $1.8 billion in June. Exports increased $0.2 billion to $4.9 billion and imports decreased $1.3 billion to $6.6 billion.
- The deficit with Singapore decreased $1.4 billion to $0.2 billion in June. Exports increased $0.3 billion to $2.1 billion and imports decreased $1.1 billion to $2.2 billion.
- The deficit with Mexico increased $4.8 billion to $9.0 billion in June. Exports increased $4.8 billion to $15.5 billion and imports increased $9.6 billion to $24.5 billion.
* * *
All statistics referenced are seasonally adjusted; statistics are on a balance of payments basis unless otherwise specified. Additional statistics, including not seasonally adjusted statistics and details for goods on a Census basis, are available in exhibits 1-20b of this release. For information on data sources, definitions, and revision procedures, see the explanatory notes in this release. The full release can be found at www.census.gov/foreign-trade/Press-Release/current_press_release/index.html or www.bea.gov/data/intl-trade-investment/international-trade-goods-and-services. The full schedule is available in the Census Bureau's Economic Briefing Room at www.census.gov/economic-indicators/ or on BEA's website at www.bea.gov/news/schedule.
* * *
Next release: September 3, 2020, at 8:30 A.M. EDT
U.S. International Trade in Goods and Services, July 2020
* * *
Change to OPEC
With the release of the “U.S. International Trade in Goods and Services, July 2020” report (FT-900) on September 3, 2020, statistics for OPEC will exclude Ecuador, which withdrew from OPEC effective January 1, 2020. This change will affect exhibits 14, 17a, 19, 20, 20a, and 20b of the FT-900 and exhibit 4 of the FT-900 Supplement.
If you have questions or need additional information, please contact the Census Bureau, Economic Indicators Division, on (800) 549-0595, option 4, or at eid.international.trade.data@census.gov.