
News Release
U.S. International Trade in Goods and Services, January 2020
The U.S. Census Bureau and the U.S. Bureau of Economic Analysis announced today that the goods and services deficit was $45.3 billion in January, down $3.3 billion from $48.6 billion in December, revised.
| Deficit: | $45.3 Billion | -6.7%° |
| Exports: | $208.6 Billion | -0.4%° |
| Imports: | $253.9 Billion | -1.6%° |
|
Next release: April 2, 2020 (°) Statistical significance is not applicable or not measurable. Data adjusted for seasonality but not price changes Source: U.S. Census Bureau, U.S. Bureau of Economic Analysis; U.S. International Trade in Goods and Services, March 6, 2020 |
||
Exports, Imports, and Balance (exhibit 1)
January exports were $208.6 billion, $0.9 billion less than December exports. January imports were $253.9 billion, $4.2 billion less than December imports.
The January decrease in the goods and services deficit reflected a decrease in the goods deficit of $2.6 billion to $67.0 billion and an increase in the services surplus of $0.6 billion to $21.7 billion.
Year-over-year, the goods and services deficit decreased $8.5 billion, or 15.8 percent, from January 2019. Exports increased $2.3 billion or 1.1 percent. Imports decreased $6.2 billion or 2.4 percent.
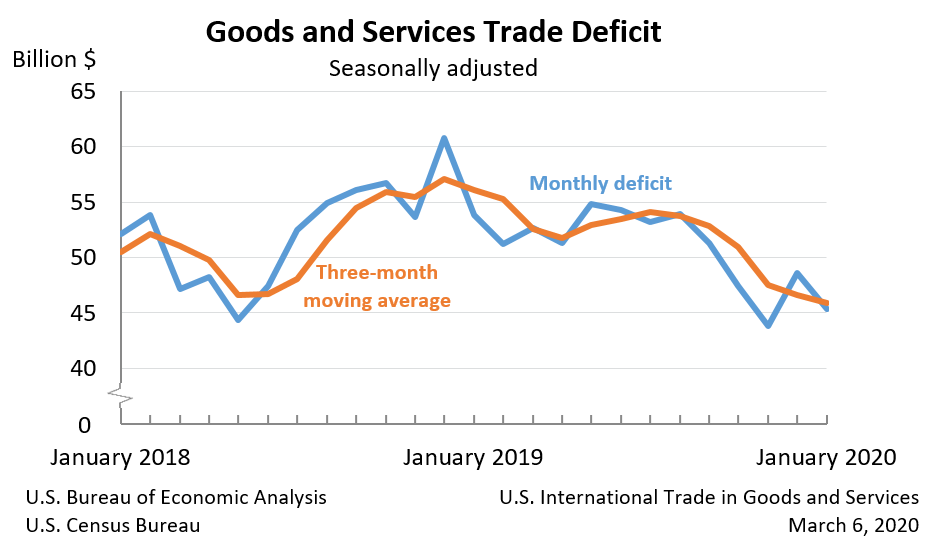
Three-Month Moving Averages (exhibit 2)
The average goods and services deficit decreased $0.7 billion to $45.9 billion for the three months ending in January.
- Average exports increased $0.7 billion to $208.6 billion in January.
- Average imports decreased less than $0.1 billion to $254.5 billion in January.
Year-over-year, the average goods and services deficit decreased $10.2 billion from the three months ending in January 2019.
- Average exports increased $1.9 billion from January 2019.
- Average imports decreased $8.2 billion from January 2019.
Exports (exhibits 3, 6, and 7)
Exports of goods decreased $1.4 billion to $136.4 billion in January.
Exports of goods on a Census basis decreased $1.4 billion.
- Capital goods decreased $1.0 billion.
- Civilian aircraft decreased $1.7 billion.
- Industrial supplies and materials decreased $1.0 billion..
- Crude oil decreased $0.8 billion.
- Fuel oil decreased $0.6 billion.
- Other goods decreased $0.9 billion.
- Automotive vehicles, parts, and engines increased $0.9 billion.
Net balance of payments adjustments decreased less than $0.1 billion.
Exports of services increased $0.5 billion to $72.2 billion in January.
- Other business services increased $0.1 billion.
- Financial services increased $0.1 billion.
- Maintenance and repair services increased $0.1 billion.
- Transport increased $0.1 billion.
Imports (exhibits 4, 6, and 8)
Imports of goods decreased $4.1 billion to $203.4 billion in January.
Imports of goods on a Census basis decreased $4.0 billion.
- Industrial supplies and materials decreased $2.4 billion.
- Nonmonetary gold decreased $1.3 billion.
- Other petroleum products decreased $0.6 billion.
- Other goods decreased $1.4 billion.
Net balance of payments adjustments decreased $0.1 billion.
Imports of services decreased $0.1 billion to $50.5 billion in January.
- Transport decreased $0.2 billion.
Real Goods in 2012 Dollars – Census Basis (exhibit 11)
The real goods deficit decreased $2.3 billion to $77.7 billion in January.
- Real exports of goods decreased $2.7 billion to $146.9 billion.
- Real imports of goods decreased $5.1 billion to $224.6 billion.
Revisions
Exports and imports of goods and services were revised for July through December 2019 to incorporate more comprehensive and updated quarterly and monthly data. In addition to these revisions, seasonally adjusted data for all months in 2019 were revised so that the totals of the seasonally adjusted months equal the annual totals.
Revisions to December exports
- Exports of goods were revised up less than $0.1 billion.
- Exports of services were revised down $0.2 billion.
Revisions to December imports
- Imports of goods were revised down less than $0.1 billion.
- Imports of services were revised down $0.4 billion.
Goods by Selected Countries and Areas: Monthly – Census Basis (exhibit 19)
The January figures show surpluses, in billions of dollars, with South and Central America ($5.8), Hong Kong ($1.8), Brazil ($1.7), United Kingdom ($1.6), and OPEC ($1.3). Deficits were recorded, in billions of dollars, with China ($23.7), European Union ($13.5), Mexico ($9.2), Germany ($5.6), Japan ($5.3), Italy ($2.6), Taiwan ($1.8), India ($1.7), Canada ($0.7), France ($0.7), South Korea ($0.6), Singapore ($0.1), and Saudi Arabia (less than $0.1).
- The deficit with Canada decreased $3.7 billion to $0.7 billion in January. Exports increased $0.7 billion to $24.6 billion and imports decreased $2.9 billion to $25.3 billion.
- The deficit with China decreased $2.1 billion to $23.7 billion in January. Exports increased $0.2 billion to $7.7 billion and imports decreased $1.8 billion to $31.4 billion.
- The deficit with Japan increased $0.9 billion to $5.3 billion in January. Exports decreased $1.1 billion to $5.7 billion and imports decreased $0.2 billion to $10.9 billion.
Goods and Services by Selected Countries and Areas: Quarterly – Balance of Payments Basis (exhibit 20)
Statistics on trade in goods and services by country and area are only available quarterly, with a one-month lag. With this release, fourth-quarter figures are now available.
The fourth-quarter figures show surpluses, in billions of dollars, with South and Central America ($20.5), Brazil ($8.7), OPEC ($7.8), Hong Kong ($6.4), United Kingdom ($5.5), Singapore ($4.8), and Saudi Arabia ($3.6). Deficits were recorded, in billions of dollars, with China ($69.4), European Union ($26.9), Mexico ($25.5), Germany ($14.8), Japan ($11.3), Italy ($9.0), India ($6.7), Taiwan ($5.0), Canada ($3.9), France ($2.9), and South Korea ($1.6).
- The deficit with the European Union decreased $8.1 billion to $26.9 billion in the fourth quarter. Exports increased $1.9 billion to $152.7 billion and imports decreased $6.2 billion to $179.6 billion.
- The deficit with China decreased $7.9 billion to $69.4 billion in the fourth quarter. Exports decreased $4.1 billion to $38.0 billion and imports decreased $12.0 billion to $107.5 billion.
- The deficit with Canada increased $1.9 billion to $3.9 billion in the fourth quarter. Exports decreased $1.6 billion to $88.2 billion and imports increased $0.3 billion to $92.1 billion.
* * *
All statistics referenced are seasonally adjusted; statistics are on a balance of payments basis unless otherwise specified. Additional statistics, including not seasonally adjusted statistics and details for goods on a Census basis, are available in exhibits 1-20b of this release. For information on data sources, definitions, and revision procedures, see the explanatory notes in this release. The full release can be found at www.census.gov/foreign-trade/Press-Release/current_press_release/index.html or www.bea.gov/data/intl-trade-investment/international-trade-goods-and-services. The full schedule is available in the Census Bureau’s Economic Briefing Room at www.census.gov/economic-indicators/ or on BEA’s website at www.bea.gov/news/schedule.
* * *
Next release: April 2, 2020, at 8:30 A.M. EDT
U.S. International Trade in Goods and Services, February 2020
* * *
Change to Exhibit 17
With this release of the “U.S. International Trade in Goods and Services” report (FT-900), exports of energy-related petroleum products have been added to exhibit 17, which has been renamed Exhibit 17. U.S. Trade in Energy-Related Petroleum Products, Including Crude Oil.
Change to the European Union
With the release of the FT-900 for February 2020 statistics on April 2, 2020, statistics for the area grouping “European Union” will exclude the United Kingdom, which exited the European Union effective February 1, 2020. This change will affect exhibits 14, 16a, 19, 20, 20a, and 20b of the FT-900 and exhibit 4 of the FT-900 Supplement.
Upcoming Updates to Goods and Services
With the releases of the FT-900 for April 2020 statistics and the FT-900 Annual Revision on June 4, 2020, statistics on trade in goods on both a Census basis and a balance of payments (BOP) basis will be revised beginning with 2015, and statistics on trade in services will be revised beginning with 1999. The revised statistics for goods on a BOP basis and for services will also be included in the “U.S. International Transactions, First Quarter 2020 and Annual Update” report and in the international transactions interactive database, both to be released by the U.S. Bureau of Economic Analysis (BEA) on June 19, 2020.
Revised statistics on trade in goods will reflect:
- Corrections and adjustments to previously published not seasonally adjusted statistics for goods on a Census basis.
- Reclassifications of several end-use commodities.
- Recalculated seasonal and trading-day adjustments.
- Newly available and revised source data on BOP adjustments, which are adjustments that BEA applies to goods on a Census basis to convert them to a BOP basis. See the “Goods (balance of payments basis)” section in the explanatory notes for more information.
Revised statistics on trade in services will reflect:
- Reclassifications of transactions between current services categories and new services categories (see below).
- Improved estimation methods for several services categories.
- Newly available and revised source data, primarily from BEA surveys, including the results of BEA’s benchmark surveys of insurance services and of selected services and intellectual property transactions.
- Recalculated seasonal adjustments.
- Revised temporal distributions of quarterly source data to monthly statistics. See the “Services” section in the explanatory notes for more information.
To further align BEA statistics with international guidelines, such as the sixth edition of the Balance of Payments and International Investment Position Manual published by the International Monetary Fund, exhibits 3 and 4 will be expanded to include two new major services categories: construction and personal, cultural, and recreational services. Examples of modified exhibits 3 and 4 will be made available with the April 2, 2020, release of the FT-900. In addition, some transactions will be reclassified between charges for the use of intellectual property n.i.e. (not included elsewhere), other business services, maintenance and repair services n.i.e., and the new categories construction and personal, cultural, and recreational services.
More information on these changes will be provided in an article previewing BEA’s 2020 annual update of the international transactions accounts in the April 2020 issue of the Survey of Current Business, BEA’s monthly online journal.
If you have questions or need additional information, please contact the U.S. Census Bureau, Economic Indicators Division, International Trade Macro Analysis Branch, on (800) 549-0595, option 4, or at eid.international.trade.data@census.gov; or BEA, Balance of Payments Division, at InternationalAccounts@bea.gov.