
News Release
U.S. International Trade in Goods and Services, October 2020
The U.S. Census Bureau and the U.S. Bureau of Economic Analysis announced today that the goods and services deficit was $63.1 billion in October, up $1.0 billion from $62.1 billion in September, revised.
| Deficit: |
$63.1 Billion |
+1.7%° |
| Exports: |
$182.0 Billion |
+2.2%° |
| Imports: |
$245.1 Billion |
+2.1%° |
|
Next release: January 7, 2021 (°) Statistical significance is not applicable or not measurable. Data adjusted for seasonality but not price changes Source: U.S. Census Bureau, U.S. Bureau of Economic Analysis; U.S. International Trade in Goods and Services, December 4, 2020 |
||
Exports and imports in October reflect both the ongoing impact of the COVID-19 pandemic and the continued recovery from the sharp declines earlier this year. The full economic effects of the pandemic cannot be quantified in the trade statistics because the impacts are generally embedded in source data and cannot be separately identified. The Census Bureau and the Bureau of Economic Analysis continue to monitor data quality and have determined estimates in this release meet publication standards. For more information, see the frequently asked questions on goods from the Census Bureau and on services from BEA.
Exports, Imports, and Balance (exhibit 1)
October exports were $182.0 billion, $4.0 billion more than September exports. October imports were $245.1 billion, $5.0 billion more than September imports.
The October increase in the goods and services deficit reflected an increase in the goods deficit of $0.6 billion to $81.4 billion and a decrease in the services surplus of $0.4 billion to $18.3 billion.
Year-to-date, the goods and services deficit increased $46.6 billion, or 9.5 percent, from the same period in 2019. Exports decreased $345.9 billion or 16.4 percent. Imports decreased $299.4 billion or 11.5 percent.
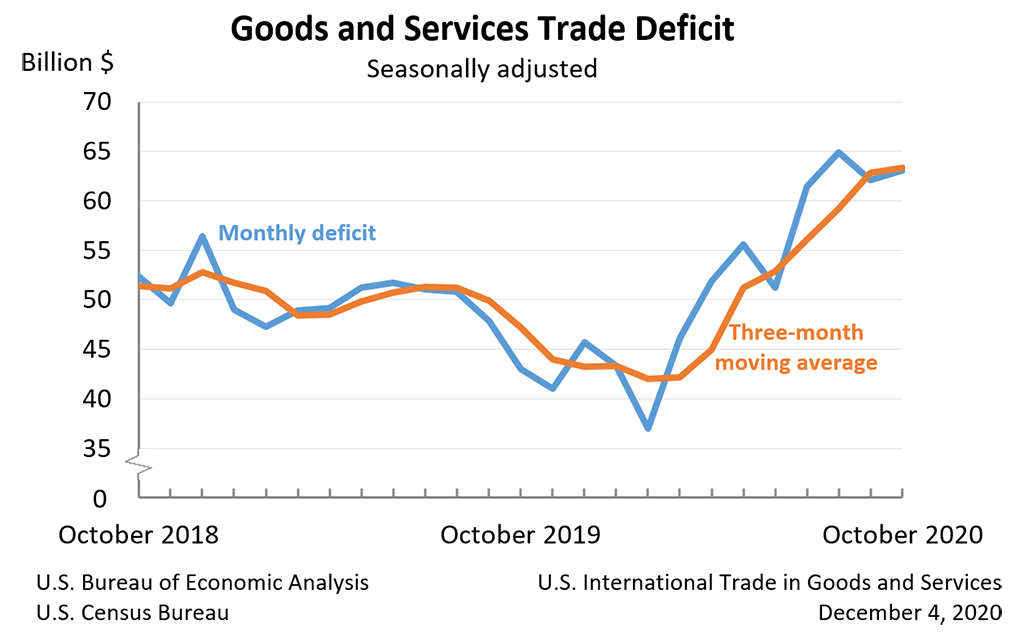
Three-Month Moving Averages (exhibit 2)
The average goods and services deficit increased $0.6 billion to $63.4 billion for the three months ending in October.
- Average exports increased $4.0 billion to $178.0 billion in October.
- Average imports increased $4.6 billion to $241.3 billion in October.
Year-over-year, the average goods and services deficit increased $16.2 billion from the three months ending in October 2019.
- Average exports decreased $32.1 billion from October 2019.
- Average imports decreased $15.9 billion from October 2019.
Exports (exhibits 3, 6, and 7)
Exports of goods increased $3.7 billion to $126.3 billion in October.
Exports of goods on a Census basis increased $3.6 billion.
- Industrial supplies and materials increased $1.6 billion.
- Natural gas increased $0.5 billion.
- Organic chemicals increased $0.4 billion.
- Capital goods increased $1.5 billion.
- Civilian aircraft engines increased $0.7 billion.
- Semiconductors increased $0.4 billion.
Net balance of payments adjustments increased $0.1 billion.
Exports of services increased $0.3 billion to $55.7 billion in October.
- Travel increased $0.2 billion.
- Transport increased $0.2 billion.
Imports (exhibits 4, 6, and 8)
Imports of goods increased $4.3 billion to $207.8 billion in October.
Imports of goods on a Census basis increased $4.7 billion.
- Consumer goods increased $1.4 billion.
- Cell phones and other household goods increased $1.1 billion.
- Capital goods increased $1.4 billion.
- Computer accessories increased $0.6 billion.
- Other industrial machinery increased $0.3 billion.
- Industrial supplies and materials increased $1.3 billion.
- Nonmonetary gold increased $0.5 billion.
- Crude oil increased $0.4 billion.
- Automotive vehicles, parts, and engines increased $1.0 billion.
- Automotive parts and accessories increased $0.5 billion.
- Passenger cars increased $0.3 billion.
Net balance of payments adjustments decreased $0.4 billion.
Imports of services increased $0.7 billion to $37.4 billion in October.
- Travel increased $0.3 billion.
- Transport increased $0.3 billion.
Real Goods in 2012 Dollars – Census Basis (exhibit 11)
The real goods deficit increased $2.3 billion to $89.9 billion in October.
- Real exports of goods increased $3.7 billion to $143.7 billion.
- Real imports of goods increased $6.0 billion to $233.7 billion.
Revisions
Exports and imports of goods and services were revised for April through September 2020 to incorporate more comprehensive and updated quarterly and monthly data.
Revisions to September exports
- Exports of goods were revised down $0.1 billion.
- Exports of services were revised up $1.8 billion.
Revisions to September imports
- Imports of goods were revised down less than $0.1 billion.
- Imports of services were revised down $0.1 billion.
Goods by Selected Countries and Areas: Monthly – Census Basis (exhibit 19)
The October figures show surpluses, in billions of dollars, with South and Central America ($2.2), OPEC ($2.1), Hong Kong ($1.9), United Kingdom ($1.3), Saudi Arabia ($0.7), and Brazil ($0.5). Deficits were recorded, in billions of dollars, with China ($26.5), European Union ($15.7), Mexico ($11.8), Japan ($5.7), Germany ($5.2), South Korea, ($3.0), Taiwan ($3.0), India ($2.6), Italy ($2.5), Canada ($1.3), France ($0.9), and Singapore (less than $0.1).
- The deficit with China increased $2.2 billion to $26.5 billion in October. Exports increased $1.1 billion to $13.1 billion and imports increased $3.3 billion to $39.7 billion.
- The deficit with Mexico increased $1.1 billion to $11.8 billion in October. Exports increased $0.7 billion to $19.2 billion and imports increased $1.8 billion to $31.0 billion.
- The deficit with the European Union decreased $1.6 billion to $15.7 billion in October. Exports decreased $0.2 billion to $19.4 billion and imports decreased $1.8 billion to $35.2 billion.
Goods and Services by Selected Countries and Areas: Quarterly – Balance of Payments Basis
(exhibit 20)
Statistics on trade in goods and services by country and area are only available quarterly, with a one-month lag. With this release, third-quarter figures are now available.
The third-quarter figures show surpluses, in billions of dollars, with South and Central America ($12.2), OPEC ($7.4), Hong Kong ($5.1), Brazil ($4.9), United Kingdom ($4.3), Singapore ($3.2), Saudi Arabia ($2.6), and Canada ($2.0). Deficits were recorded, in billions of dollars, with China ($74.6), Mexico ($34.2), European Union ($31.1), Germany ($14.1), Japan ($12.8), India ($8.5), Taiwan ($7.3), Italy ($6.9), France ($5.9), and South Korea ($4.3).
- The deficit with Mexico increased $19.2 billion to $34.2 billion in the third quarter. Exports increased $15.6 billion to $58.8 billion and imports increased $34.8 billion to $92.9 billion.
- The deficit with the European Union increased $9.9 billion to $31.1 billion in the third quarter. Exports increased $10.4 billion to $98.5 billion and imports increased $20.3 billion to $129.6 billion.
- The surplus with Hong Kong increased $3.3 billion to $5.1 billion in the third quarter. Exports decreased $0.2 billion to $8.5 billion and imports decreased $3.5 billion to $3.3 billion.
* * *
All statistics referenced are seasonally adjusted; statistics are on a balance of payments basis unless otherwise specified. Additional statistics, including not seasonally adjusted statistics and details for goods on a Census basis, are available in exhibits 1-20b of this release. For information on data sources, definitions, and revision procedures, see the explanatory notes in this release. The full release can be found at www.census.gov/foreign-trade/Press-Release/current_press_release/index.html or www.bea.gov/data/intl-trade-investment/international-trade-goods-and-services. The full schedule is available in the Census Bureau's Economic Briefing Room at www.census.gov/economic-indicators/
or on BEA's website at www.bea.gov/news/schedule.
* * *
Next release: January 7, 2021, at 8:30 A.M. EST
U.S. International Trade in Goods and Services, November 2020
* * *
U.S. International Trade in Goods and Services Release Dates in 2021
| Statistical Month | Date |
|---|---|
| November 2020 | January 7 |
| December 2020 | February 5 |
| January 2021 | March 5 |
| February 2021 | April 7 |
| March 2021 | May 4 |
| April 2021 | June 8 |
| May 2021 | July 2 |
| June 2021 | August 5 |
| July 2021 | September 2 |
| August 2021 | October 5 |
| September 2021 | November 4 |
| October 2021 | December 7 |