
News Release
Gross Domestic Product for the CNMI, 2019
Today, the Bureau of Economic Analysis (BEA) is releasing estimates of gross domestic product (GDP) for the Commonwealth of the Northern Mariana Islands (CNMI) for 2019, in addition to estimates of GDP by industry and compensation by industry for 2018.1 These estimates were developed under the Statistical Improvement Program funded by the Office of Insular Affairs (OIA) of the U.S. Department of the Interior.
Gross Domestic Product for 2019
The estimates of GDP for the CNMI show that real GDP—GDP adjusted to remove price changes—decreased 11.2 percent in 2019 after decreasing 19.3 percent in 2018 (table 1.3).
As shown in chart 1, the decrease in real GDP reflected decreases in exports and private fixed investment. These decreases were partly offset by an increase in government spending.
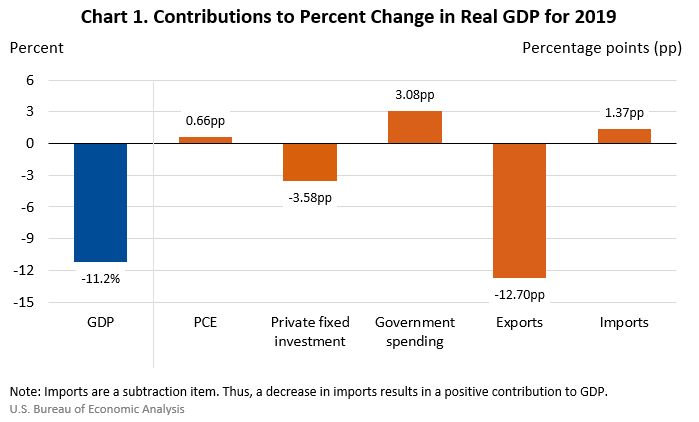
Exports of goods and services was the primary driver of the decline in real GDP. The decrease in exports was accounted for by exports of services, which decreased 27.7 percent. Visitor spending, including on casino gambling, declined in 2019. Statistics published by the CNMI government showed that the number of visitor arrivals to the CNMI decreased 5.9 percent. According to publicly available financial statements, revenues from casino gambling dropped over 80 percent.
There is often interest in how much a specific GDP component contributes to the change in real GDP. BEA publishes this measure in news release table 1.4. Chart 1 shows both the percent change of total real GDP and the contributions (in percentage points) of each major component to that change. For example, exports of goods and services accounted for -12.70 percentage points of the 11.2 percent decrease in real GDP in 2019. This means that, all else equal, had exports neither increased nor decreased in 2019, real GDP would have increased 1.5 percent.
Private fixed investment decreased 20.8 percent, reflecting a decline in business spending on construction and equipment. Despite this substantial decline, business spending on construction and equipment remained at historically high levels, supported by continued development of a casino resort on Saipan and post-typhoon reconstruction activity (table 1.2).
Partly offsetting the declines in exports and private fixed investment was growth in government spending, both by the federal government and the territorial government. Federal government spending increased 42.3 percent, primarily due to recovery activities following Typhoon Yutu. Territorial government spending increased 4.1 percent, reflecting an increase in expenditures funded by federal disaster grants.
Gross Domestic Product by Industry and Compensation by Industry for 2018
The estimates of GDP by industry for the CNMI show that the private sector was the source of the decline in real GDP in 2018 (table 2.5). The decline was more than accounted for by the accommodations, food services, and amusement sectors, reflecting the drop in tourism and output of the casino industry.
The compensation by industry estimates, which are measured in current dollars, show trends in compensation for major industries (table 2.6). Total compensation increased in 2018, reflecting growth in all industries shown except manufacturing. The largest contributor was the territorial government. Government financial statements for the Commonwealth and its independent agencies show that wages increased in fiscal year 2018.
The accompanying tables present estimates for GDP and its major components, GDP by industry, and compensation by industry. Also included in this release are estimates for the major components of gross domestic income.
Revisions to GDP and Related Estimates
This release also includes the results of a comprehensive update of the territorial economic accounts. Comprehensive updates are typically performed every 5 years, based on the Census Bureau’s every-5-years economic censuses of island areas.
With the comprehensive update, estimates for 2002 to 2018 have been revised to incorporate improvements to source data and methods, including information from:
- The U.S. Census Bureau’s 2017 Economic Census of Island Areas (ECIA), which provides the most thorough and detailed statistics on the structure of the CNMI economy,
- CNMI government data sources, such as updated data on business revenues, imports of goods, and government financial statements for the CNMI government and its independent agencies,
- Construction in progress data from publicly available financial statements covering casino activity, and
- BEA’s U.S. national income and product accounts.
Chart 2 shows that the revised estimates exhibit a pattern of inflation-adjusted GDP growth similar to the previously published estimates. However, there are notable revisions within the components of GDP, including to imports, consumer spending, and private fixed investment.
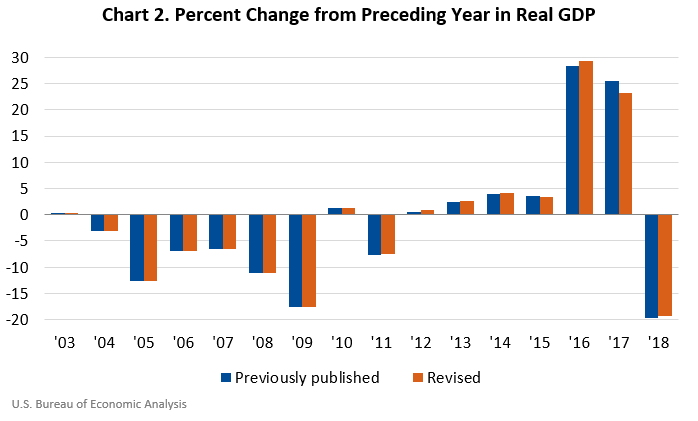
For example, consumer spending increased more than previously estimated between 2012 and 2017, reflecting the incorporation of 2017 ECIA data on sales to resident households.
Private fixed investment also increased more than previously estimated over this period, reflecting the incorporation of 2017 ECIA data on capital expenditures by private businesses and of construction in progress data collected from casino financial statements.
Comparisons of these updated estimates of consumer spending and private investment with ECIA and CNMI government data on business revenues showed that many of the goods and services purchased by households and businesses in the CNMI were produced outside of the islands. Thus, imports, which are a subtraction in the calculation of GDP, were also revised upward.
Future Directions
OIA and BEA will continue to work to extend and improve the estimates of GDP for the CNMI. The information provided by the CNMI government will continue to be critical to the successful production of these estimates.
BEA plans to release GDP estimates for 2020 for the CNMI in the fall of 2021. GDP by industry and compensation by industry estimates for 2019 will be released at the same time.
1 These estimates are based on limited source data and are subject to revision.