
News Release
Gross Domestic Product for American Samoa, 2021
Gross Domestic Product by Industry and Compensation by Industry, 2020
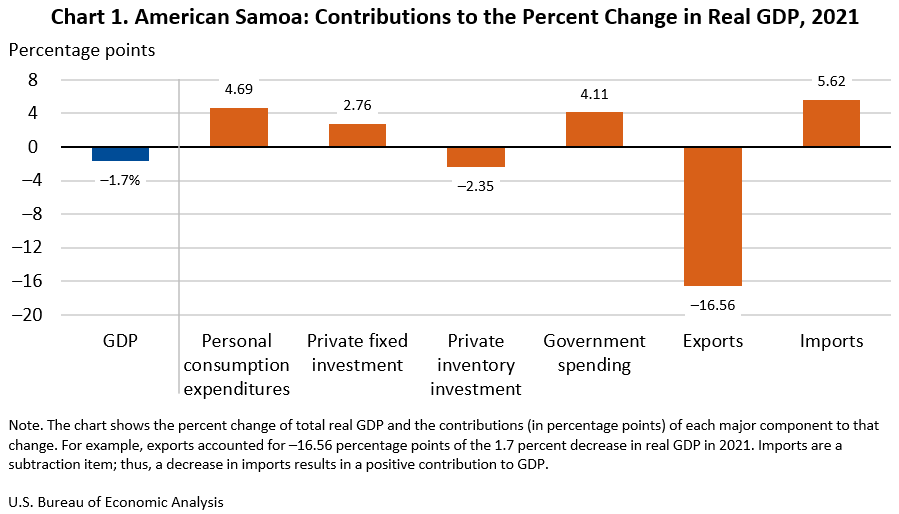
Real gross domestic product (GDP) for American Samoa decreased 1.7 percent in 2021 after increasing 5.0 percent in 2020 (table 1.3), according to statistics released today by the U.S. Bureau of Economic Analysis (BEA). These statistics were developed under the Statistical Improvement Program, funded by the Office of Insular Affairs (OIA) of the U.S. Department of the Interior.
GDP for 2021
The decrease in real GDP reflected decreases in exports and private inventory investment (table 1.4). These decreases were partly offset by increases in personal consumption expenditures, government spending, and private fixed investment. Imports, a subtraction item in the calculation of GDP, declined.
In 2021, the American Samoa economy was affected by the continued federal government response related to the COVID–19 pandemic. Territorial government and consumer spending were supported by federal payments authorized by the Coronavirus Aid, Relief, and Economic Security (CARES) Act of 2020; the Coronavirus Response and Relief Supplemental Appropriations (CRRSA) Act of 2021; and the American Rescue Plan Act of 2021. Expenditures funded by these payments are reflected in the GDP estimates. However, the full effects of the pandemic cannot be quantified in BEA statistics for American Samoa, because the impacts are generally embedded in the data sources used to estimate the components of GDP.
Exports decreased 27.0 percent (table 1.3), primarily reflecting a decline in exports of canned tuna and related products. Data from the U.S. Census Bureau U.S. Trade with Puerto Rico and U.S. Possessions reports show that the quantities of prepared or preserved fish shipped from American Samoa to the 50 states and the District of Columbia were 29 percent lower in 2021 compared with 2020.
Private inventory investment decreased (table 1.2), reflecting a decline in inventory investment of the tuna canning industry.
Personal consumption expenditures increased 6.2 percent (table 1.3), primarily reflecting growth in spending on goods, such as food and beverages, clothing, and furniture. Consumer spending was supported by government assistance payments distributed to households through the CRRSA Act and the American Rescue Plan Act.
Government spending increased 8.0 percent (table 1.3), reflecting growth in territorial government spending. Territorial government spending was supported by federal grant revenues, including Coronavirus Relief Fund payments and Education Stabilization Fund payments authorized by the CARES Act and the American Rescue Plan Act.
Private fixed investment increased 30.8 percent (table 1.3), primarily reflecting growth in residential and nonresidential structures.
GDP by industry and compensation by industry for 2020
In 2020, GDP increased 5.0 percent. The newly available GDP by industry data, which are released on a 1-year lag, reveal that both the government and private sector contributed to growth in real GDP in 2020 (table 2.5).
The government sector increased 9.1 percent (table 2.4), primarily reflecting growth in compensation for territorial government employees.
The private sector increased 3.1 percent (table 2.4), primarily reflecting growth in manufacturing. The growth in manufacturing reflected increased tuna cannery output.
Total compensation increased from $309 million to $345 million in 2020 (table 2.6). The $36 million increase primarily reflected growth in territorial government compensation.
- Value of imported goods by type from the American Samoa Department of Commerce,
- Audited financial statements for the American Samoa Government and its independent agencies, and
- Wage and employment information from the U.S. Census Bureau County Business Patterns.
The revised estimates exhibit a pattern of inflation-adjusted GDP growth similar to the previously published estimates (table 1.7).
Due to lags in the availability of data for various components of GDP, the statistics presented today for 2021 are preliminary estimates. For example, data covering government spending and imports of goods for the fourth quarter of 2021 were not available in time for incorporation into this year's estimates of GDP. As additional source data become available, BEA will incorporate the information and will release updated estimates once a year.
For more information on the data sources underlying these estimates, see Summary of Methodologies: Gross Domestic Product for American Samoa, the Commonwealth of the Northern Mariana Islands, Guam and the U.S. Virgin Islands.
Gross Domestic Product for American Samoa, 2022
American Samoa GDP by Industry and Compensation by Industry, 2021