
News Release
Gross Domestic Product by State and Personal Income by State, 4th Quarter 2022 and Year 2022
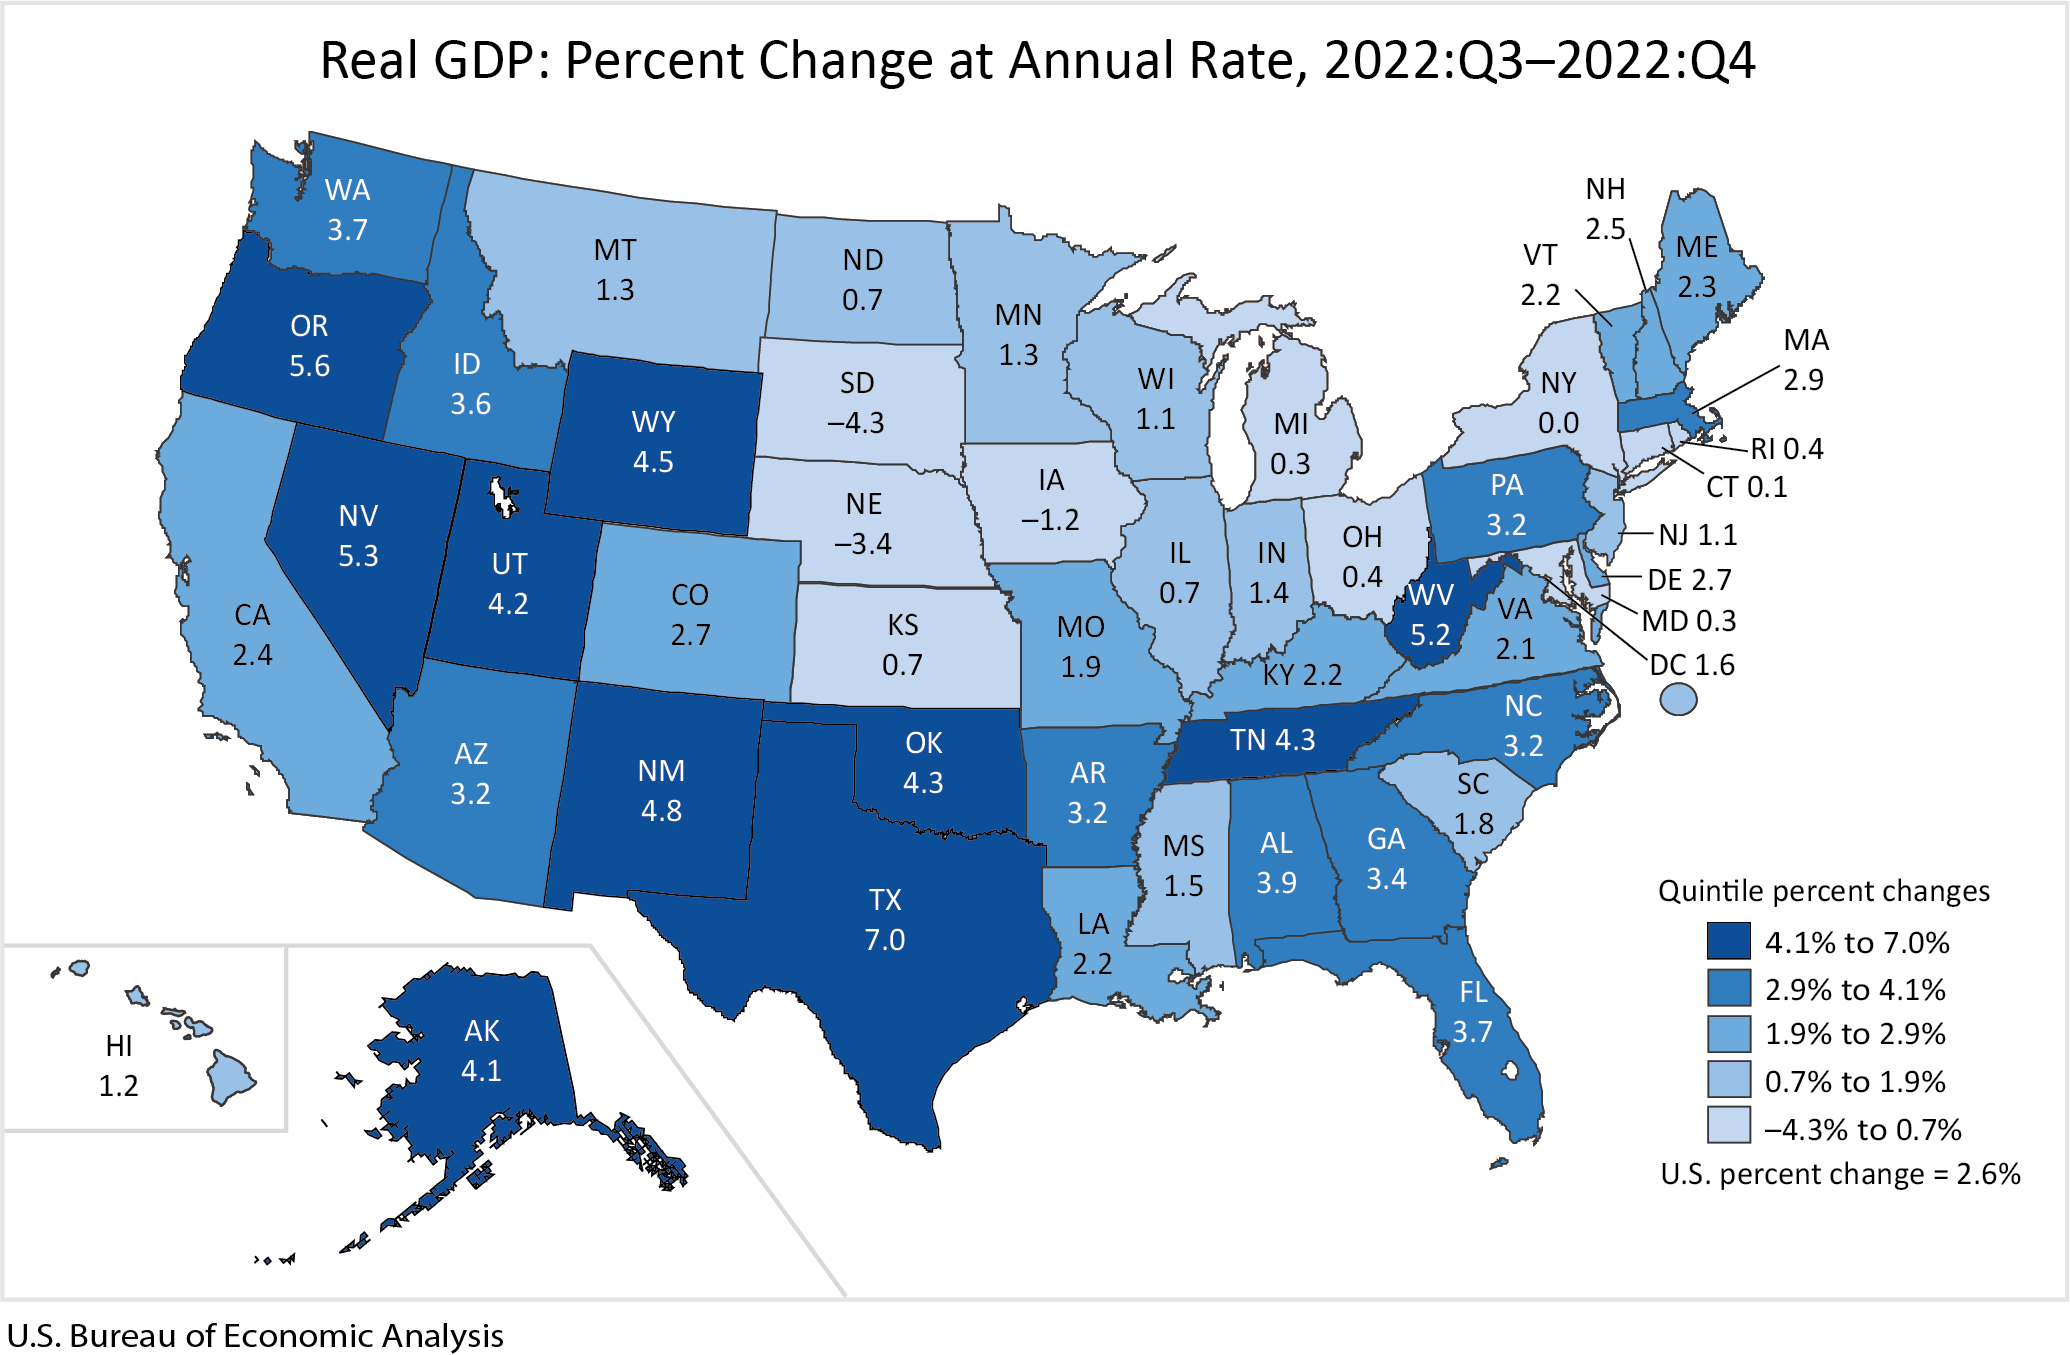
Real gross domestic product (GDP) increased in 46 states and the District of Columbia in the fourth quarter of 2022, with the percent change in real GDP ranging from 7.0 percent in Texas to –4.3 percent in South Dakota (table 1), according to statistics released today by the U.S. Bureau of Economic Analysis (BEA). Current-dollar GDP increased in 45 states and the District of Columbia. For the year 2022, real, or inflation-adjusted, GDP increased in 42 states and the District of Columbia.
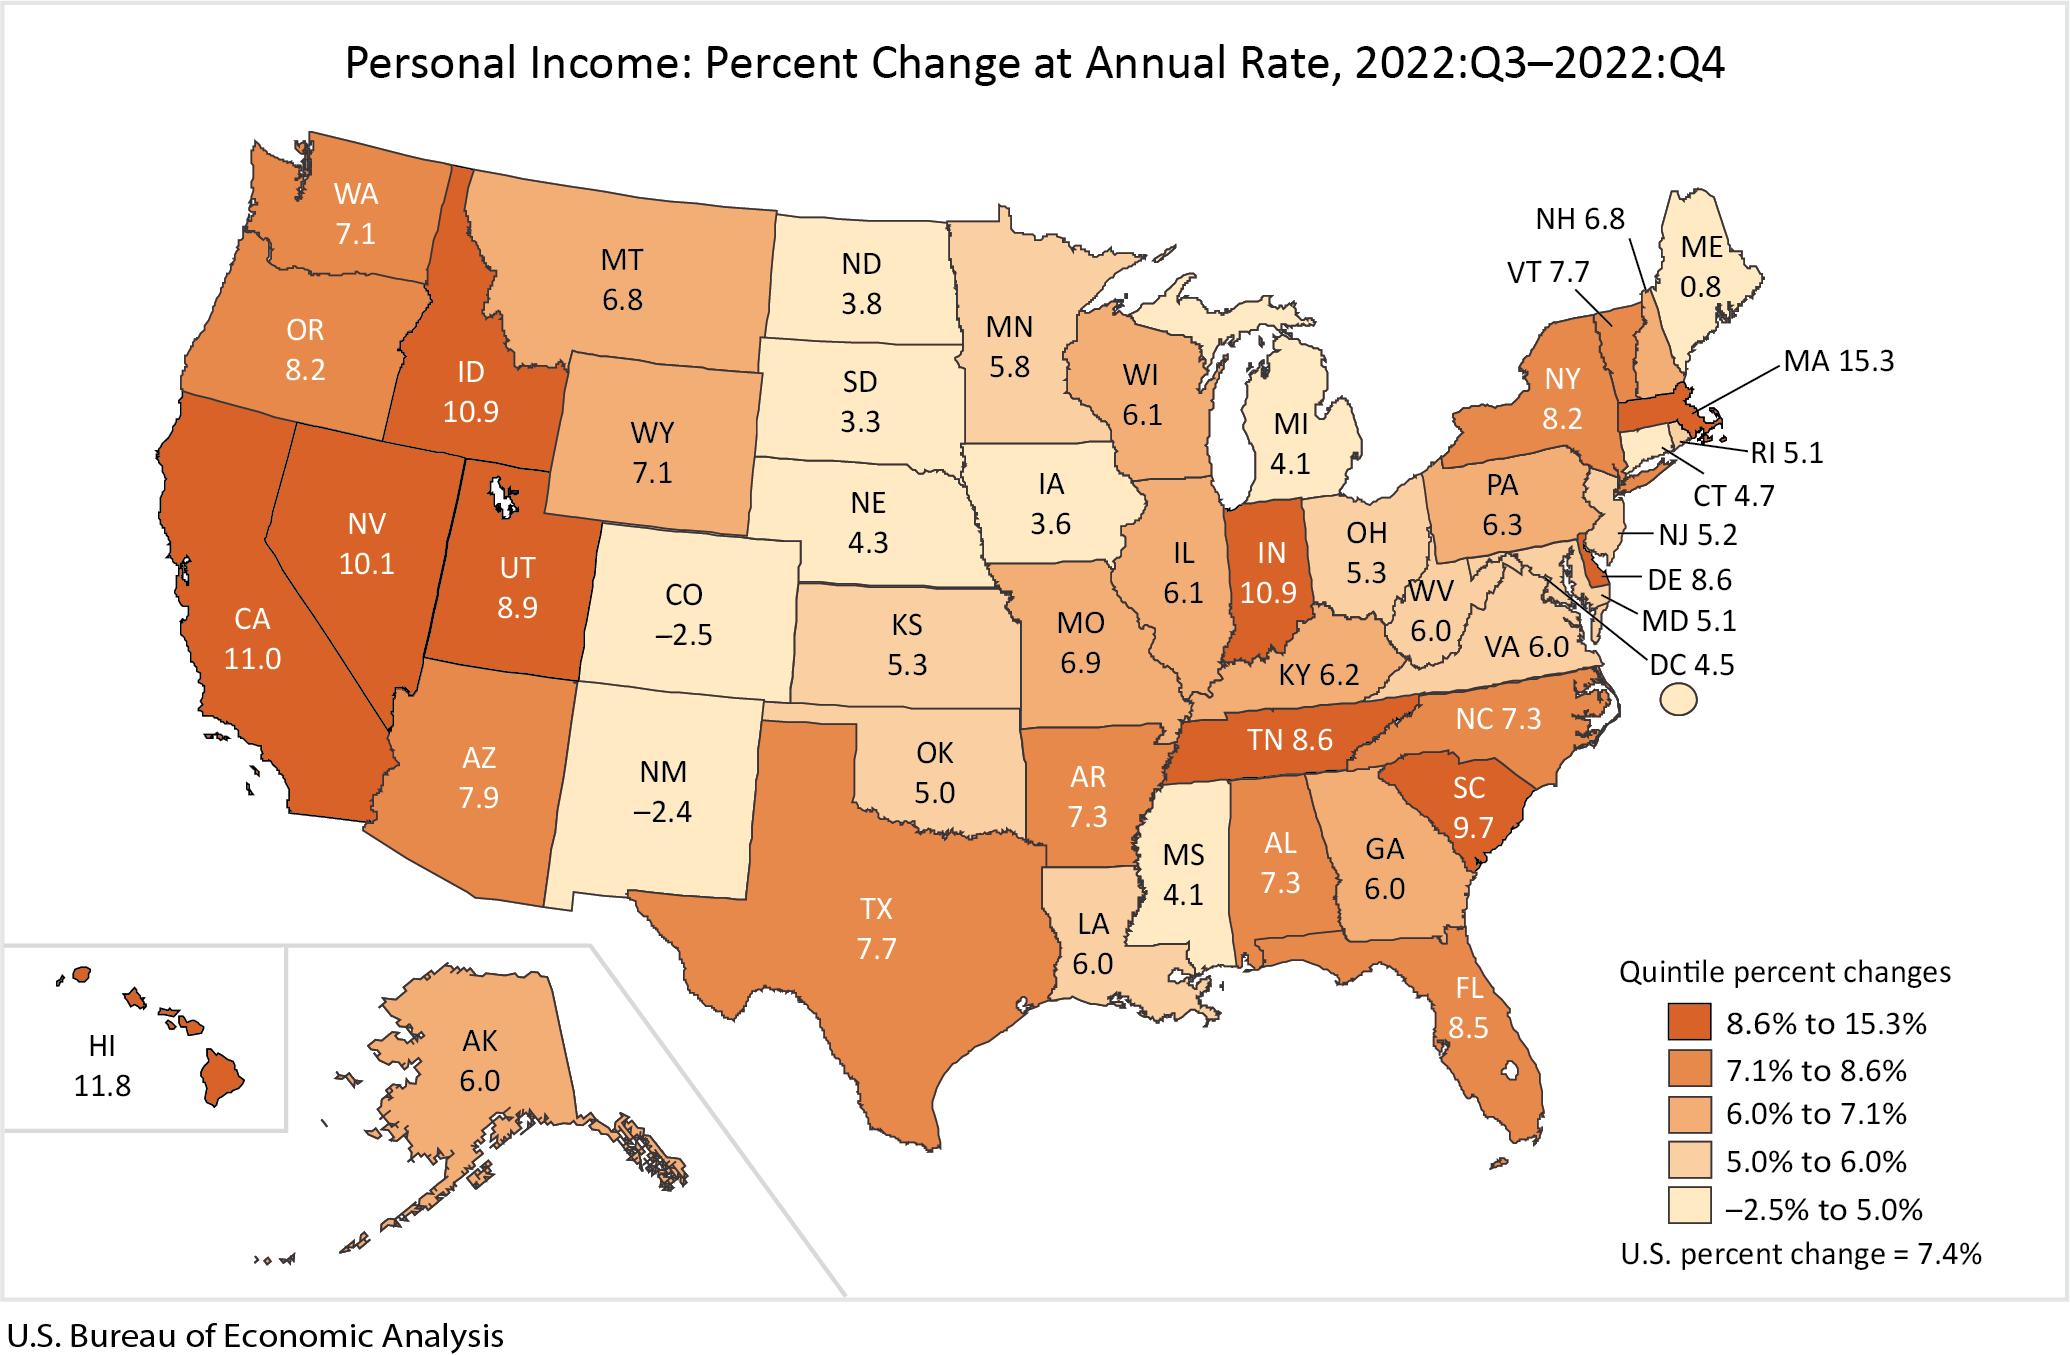
Personal income, in current dollars, increased in 48 states and the District of Columbia in the fourth quarter of 2022, with the percent change ranging from 15.3 percent in Massachusetts to –2.5 percent in Colorado (table 4). For the year 2022, current-dollar personal income increased in 49 states and the District of Columbia.
Quarterly GDP
In the fourth quarter of 2022, as real GDP for the nation increased at an annual rate of 2.6 percent, real GDP increased in 16 of the 23 industry groups for which BEA prepares quarterly state estimates (table 2). Professional, scientific, and technical services; retail trade; durable goods manufacturing; and mining were the leading contributors to the increase in real GDP nationally.
- The professional, scientific, and technical services industry increased in all 50 states and the District of Columbia and was the leading contributor to the increase in 15 states and the District of Columbia including Nevada, the state with the third-largest increase in real GDP.
- Retail trade increased in all 50 states and the District of Columbia and was the leading contributor to the increase in 10 states including Oregon, the state with the second-largest increase in real GDP.
- The mining industry increased in 49 states and was the leading contributor to the increases in real GDP in Texas, the state with the largest increase in real GDP, and in West Virginia, New Mexico, Wyoming, and Oklahoma, the states with the fourth, fifth, sixth, and seventh-largest increases in real GDP.
- The agriculture, forestry, fishing, and hunting industry decreased in 20 states. This industry was the leading contributor to the decreases in South Dakota, Nebraska, and Iowa, the only states with decreases.
Annual GDP
In 2022, real GDP for the nation increased at an annual rate of 2.1 percent, with the percent change in real GDP ranging from 4.9 percent in Idaho to –2.4 percent in Alaska. Real GDP increased in 15 of the 23 industry groups for which BEA prepares preliminary annual state estimates (table 3). Professional, scientific, and technical services; information; and real estate and rental and leasing were the leading contributors to the increase in real GDP nationally.
- Professional, scientific, and technical services increased in 49 states and the District of Columbia. This industry was the leading contributor to the increase in 13 states and the District of Columbia, including Colorado and New York the states with the seventh and eighth-largest increases.
- The information industry increased in 47 states and the District of Columbia. This industry was the leading contributor to the increase in eight states including Texas, the state with the fifth-largest increase.
- The real estate and rental and leasing industry increased in 43 states and the District of Columbia. This industry was the leading contributor to the increase in six states including Idaho and Florida, the states with the first and third-largest increases.
- The mining industry decreased in 28 states. This industry was the leading contributor to the decreases in Alaska, North Dakota, Oklahoma, and Wyoming, the states with the first, fourth, fifth, and sixth-largest decreases.
Quarterly personal income
In the fourth quarter of 2022, as personal income for the nation increased at an annual rate of 7.4 percent, state personal income increased in 48 states and the District of Columbia.
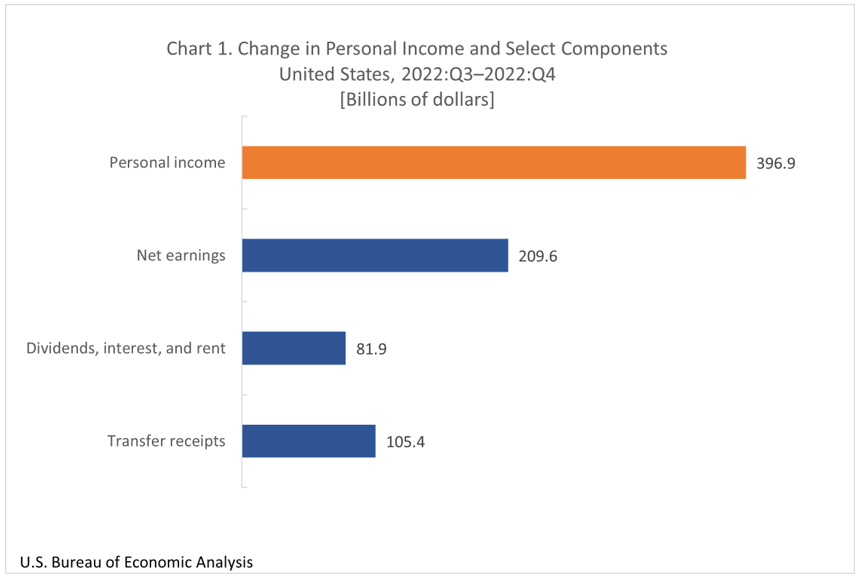
Nationally, increases in earnings, property income (dividends, interest, and rent), and transfer receipts all contributed to the increase in personal income (chart 1).
Transfer receipts increased in 46 states and the District of Columbia, increasing 11.3 percent nationally. The percent change in transfer receipts ranged from 76.1 percent in Massachusetts to –38.5 percent in Colorado (table 5).
Transfer receipts was the leading contributor to increases in personal income in Massachusetts, Hawaii, California, and Indiana, the states with the largest increases in personal income. One-time state refundable tax credits resulted in above-average increases in personal income in these states in the fourth quarter.
Earnings increased in all 50 states and the District of Columbia, increasing 6.2 percent nationally. The percent change in earnings ranged from 10.8 percent in Nevada to 1.0 percent in South Dakota.
Earnings increased in 21 of the 24 industries for which BEA prepares quarterly estimates (table 6). Health care and social assistance; professional, scientific, and technical services; and state and local government were the leading contributors to the overall increase in earnings.
Property income increased in all 50 states and the District of Columbia, increasing 8.1 percent nationally. The percent change ranged from 12.1 percent in Utah to 4.6 percent in Kansas (table 5).
Annual personal income
In 2022, personal income for the nation increased at an annual rate of 2.4 percent, with the percent change ranging from 6.2 percent in Idaho to 0.0 percent in Louisiana.
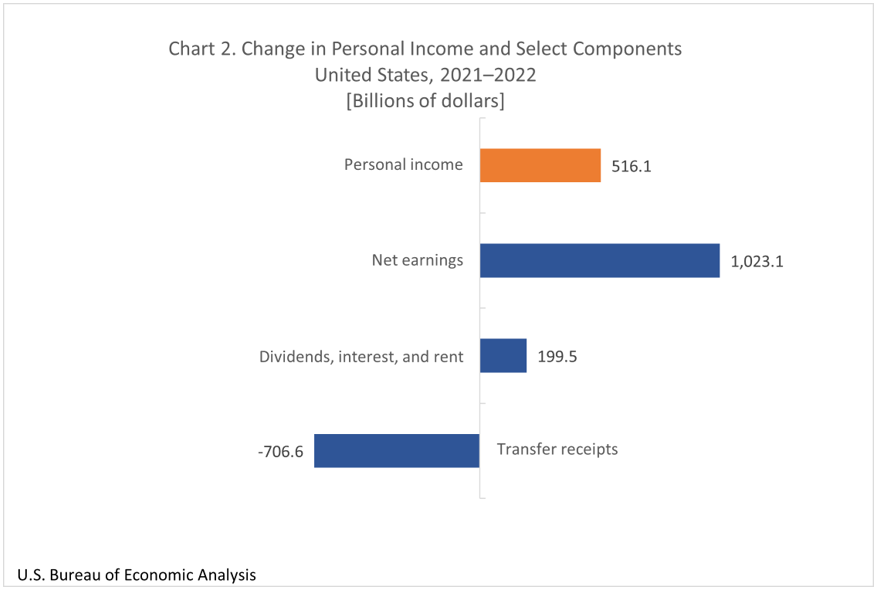
Nationally, increases in earnings and property income (dividends, interest, and rent) contributed to the increase in personal income (chart 2).
Earnings increased in all 50 states and the District of Columbia, increasing 8.0 percent nationally. The percent change in earnings ranged from 12.5 percent in Idaho to 4.7 percent in the District of Columbia (table 7).
Earnings increased in all 24 industries for which BEA prepares quarterly estimates (table 8). Professional, scientific, and technical services; health care and social assistance; and administrative and support and waste management and remediation services industries were the leading contributors to the overall growth in earnings.
- In Idaho, the state with the largest increase in personal income, the increase in earnings in the construction industry was the leading contributor to the increase in personal income (table 8).
- In Colorado and Texas, the states with the second- and third-largest increases in personal income, the increase in earnings in professional, scientific, and technical services was the leading contributor to the increase in personal income.
Property income increased in all 50 states and the District of Columbia, increasing 5.1 percent nationally. The percent change ranged from 7.1 percent in Idaho to 3.1 percent in Mississippi (table 7).
Transfer receipts decreased in 49 states and the District of Columbia, decreasing 15.3 percent nationally. The percent change in transfer receipts ranged from 1.1 percent in Alaska to –20.7 percent in the District of Columbia (table 7).
Update of state statistics
Today, BEA also released revised quarterly estimates of personal income by state for the first quarter of 2022 through the third quarter of 2022. The updates incorporate new and revised source data that are more complete and more detailed than previously available and to align the states with revised national estimates from the National Income and Product Accounts released on March 30, 2023.
BEA also released new estimates of per capita personal income for the fourth quarter of 2022, along with revised estimates for the first quarter of 2020 through the third quarter of 2022. BEA used U.S. Census Bureau (Census) population figures to calculate per capita personal income estimates for the first quarter of 2020 through the fourth quarter of 2022. BEA also used new Census population figures to update annual 2020 to 2021 per capita personal income statistics and to produce new per capita personal income statistics for 2022. For earlier estimates, BEA used intercensal population statistics that it developed based on Census methodology. See "Note on Per Capita Personal Income and Population."
Next release: June 30, 2023, 10:00 a.m. EDT
Gross Domestic Product by State and Personal Income by State, 1st Quarter 2023