
News Release
Outdoor Recreation Satellite Account, U.S. and States, 2022
New Statistics for 2022; Updates for 2017–2021
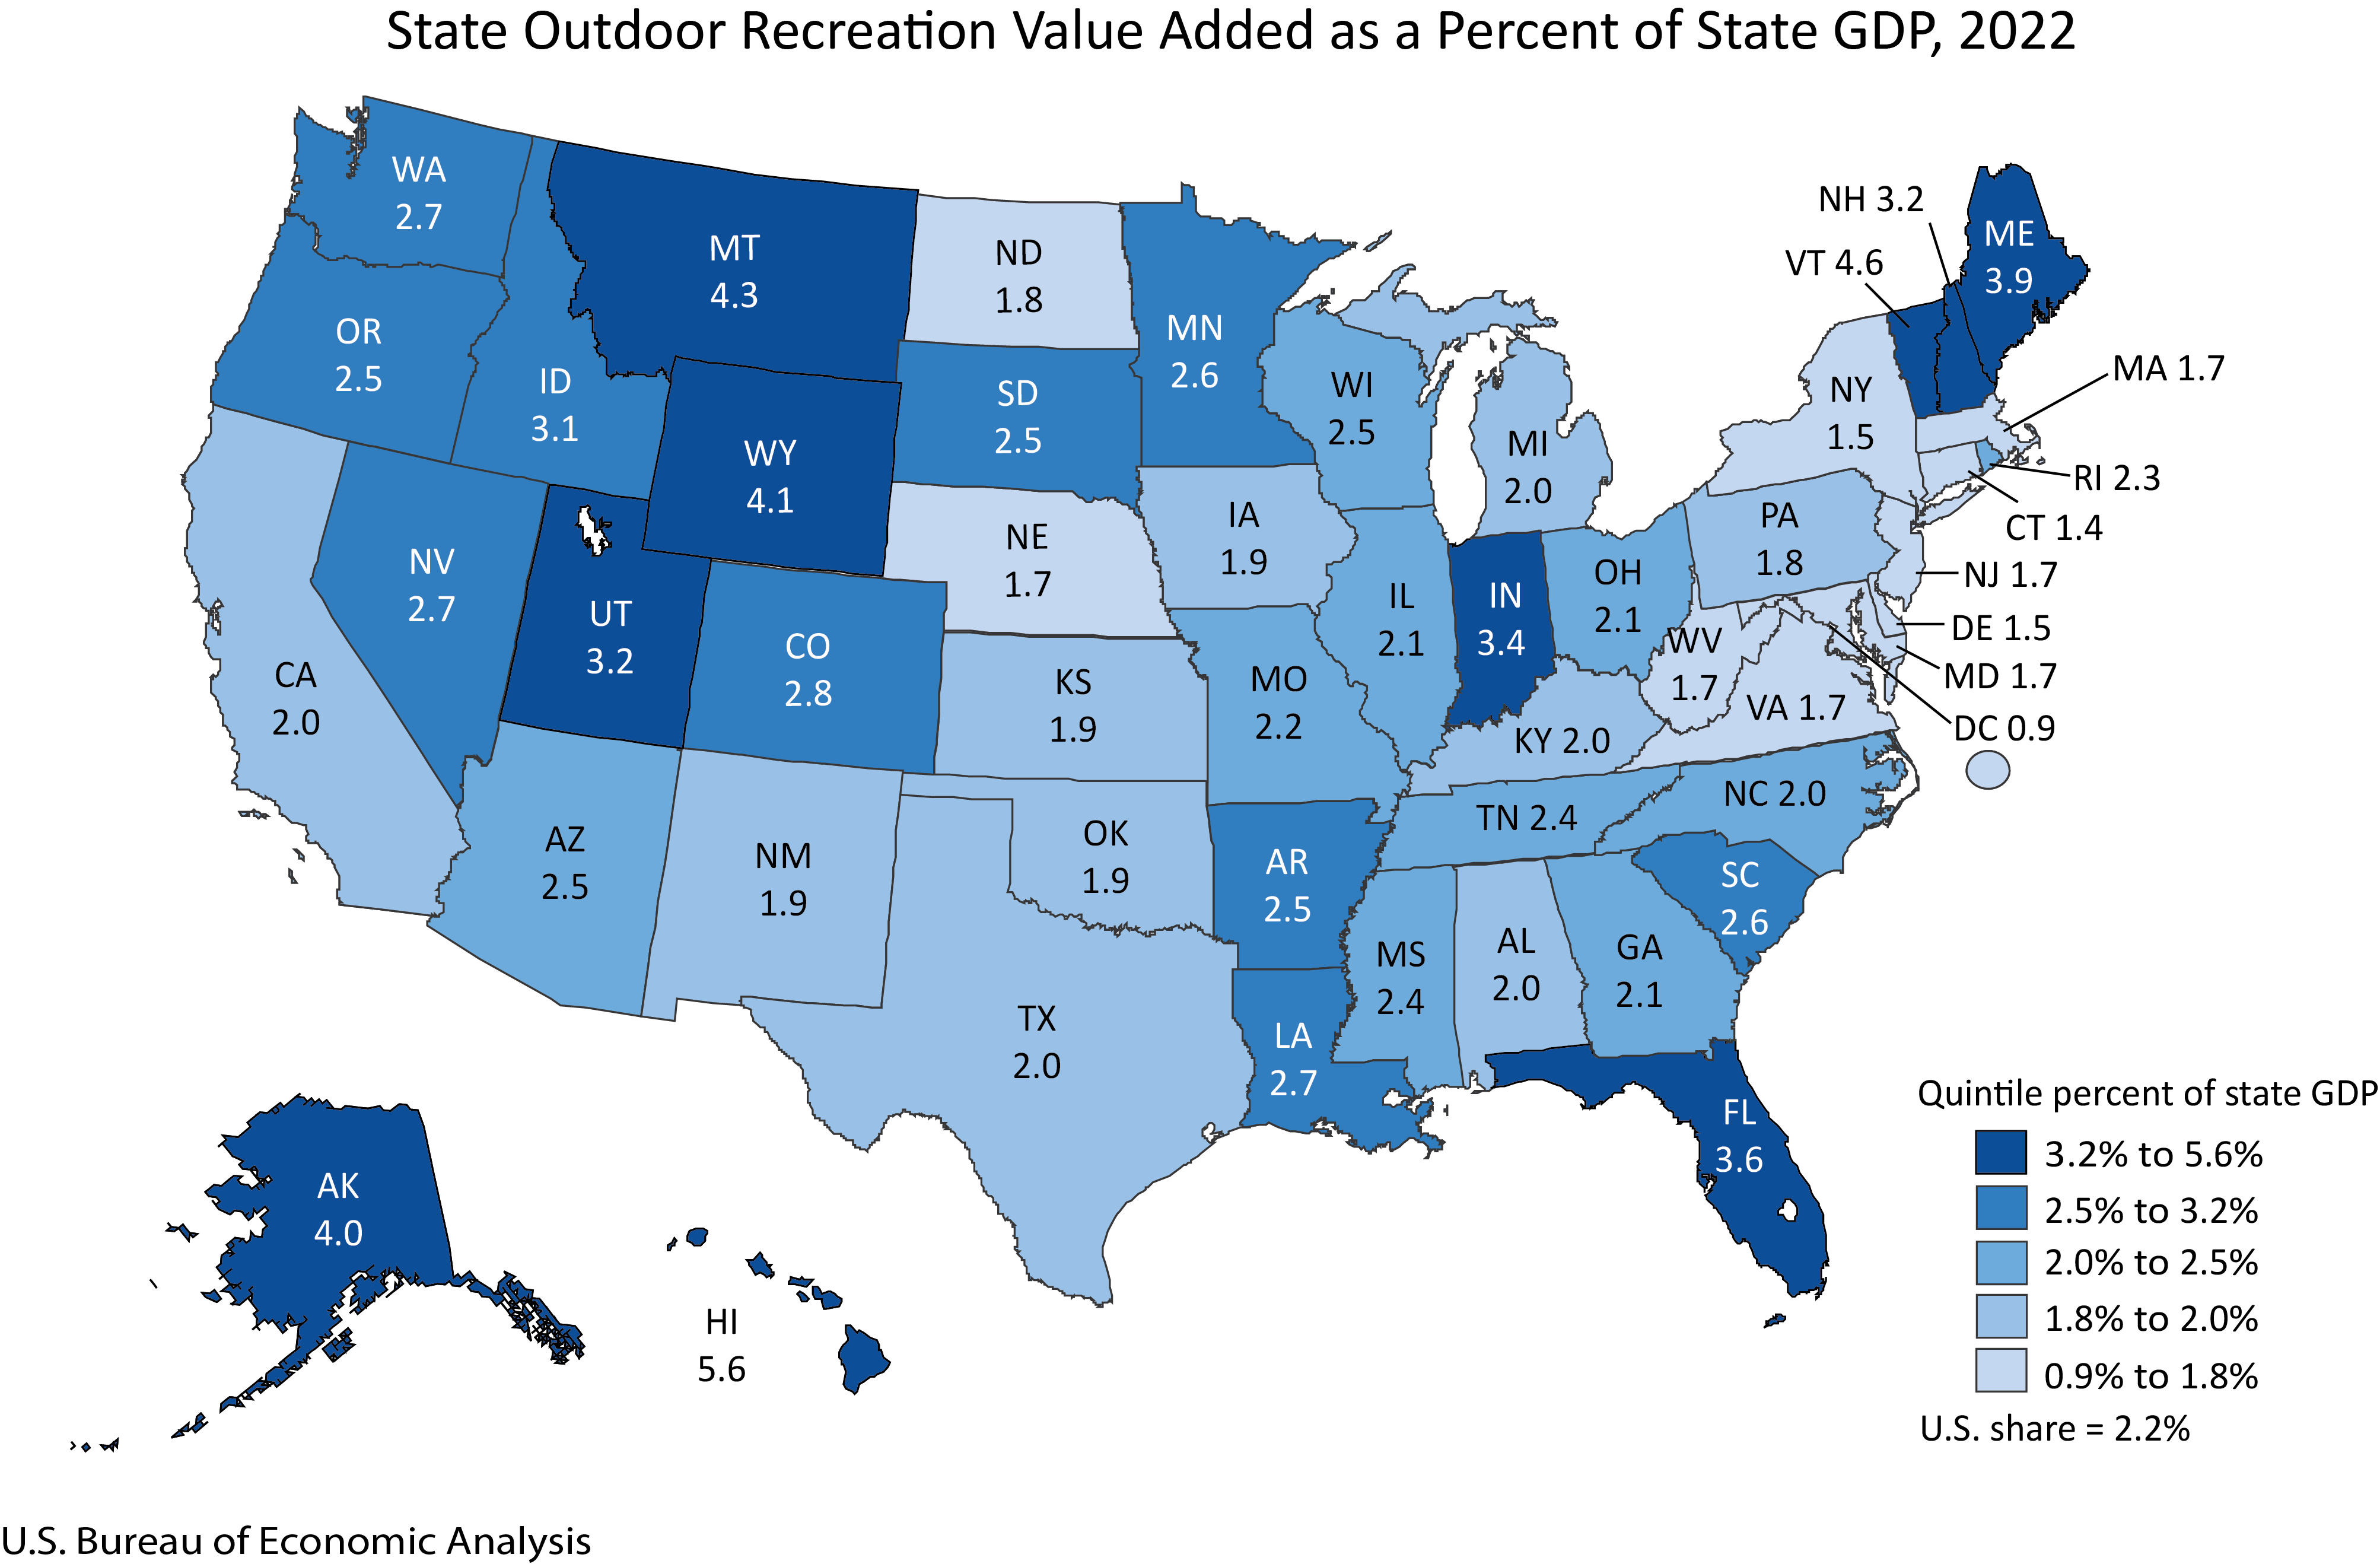
The U.S. Bureau of Economic Analysis (BEA) released statistics today measuring the outdoor recreation economy for the nation, all 50 states, and the District of Columbia. The new U.S. data show that the value added of the outdoor recreation economy accounted for 2.2 percent ($563.7 billion) of current-dollar gross domestic product (GDP) for the nation in 2022 (national table 1). At the state level, value added for outdoor recreation as a share of state GDP ranged from 5.6 percent in Hawaii to 1.4 percent in Connecticut. The share was 0.9 percent in the District of Columbia (state table 1).
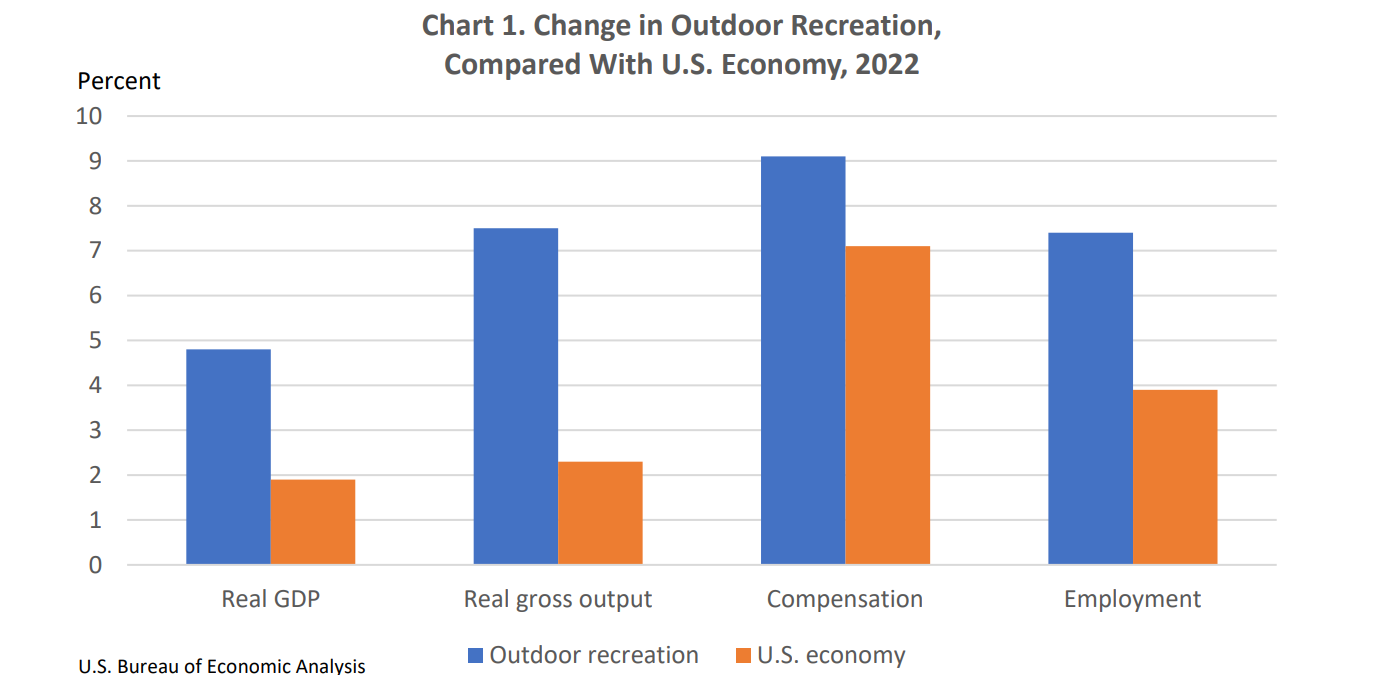
Inflation-adjusted (“real”) GDP for the outdoor recreation economy increased 4.8 percent in 2022, compared with a 1.9 percent increase for the overall U.S. economy, reflecting a deceleration from the increase in outdoor recreation of 22.7 percent in 2021. Real gross output for the outdoor recreation economy increased 7.5 percent, while outdoor recreation compensation increased 9.1 percent, and employment increased 7.4 percent (national table 9).
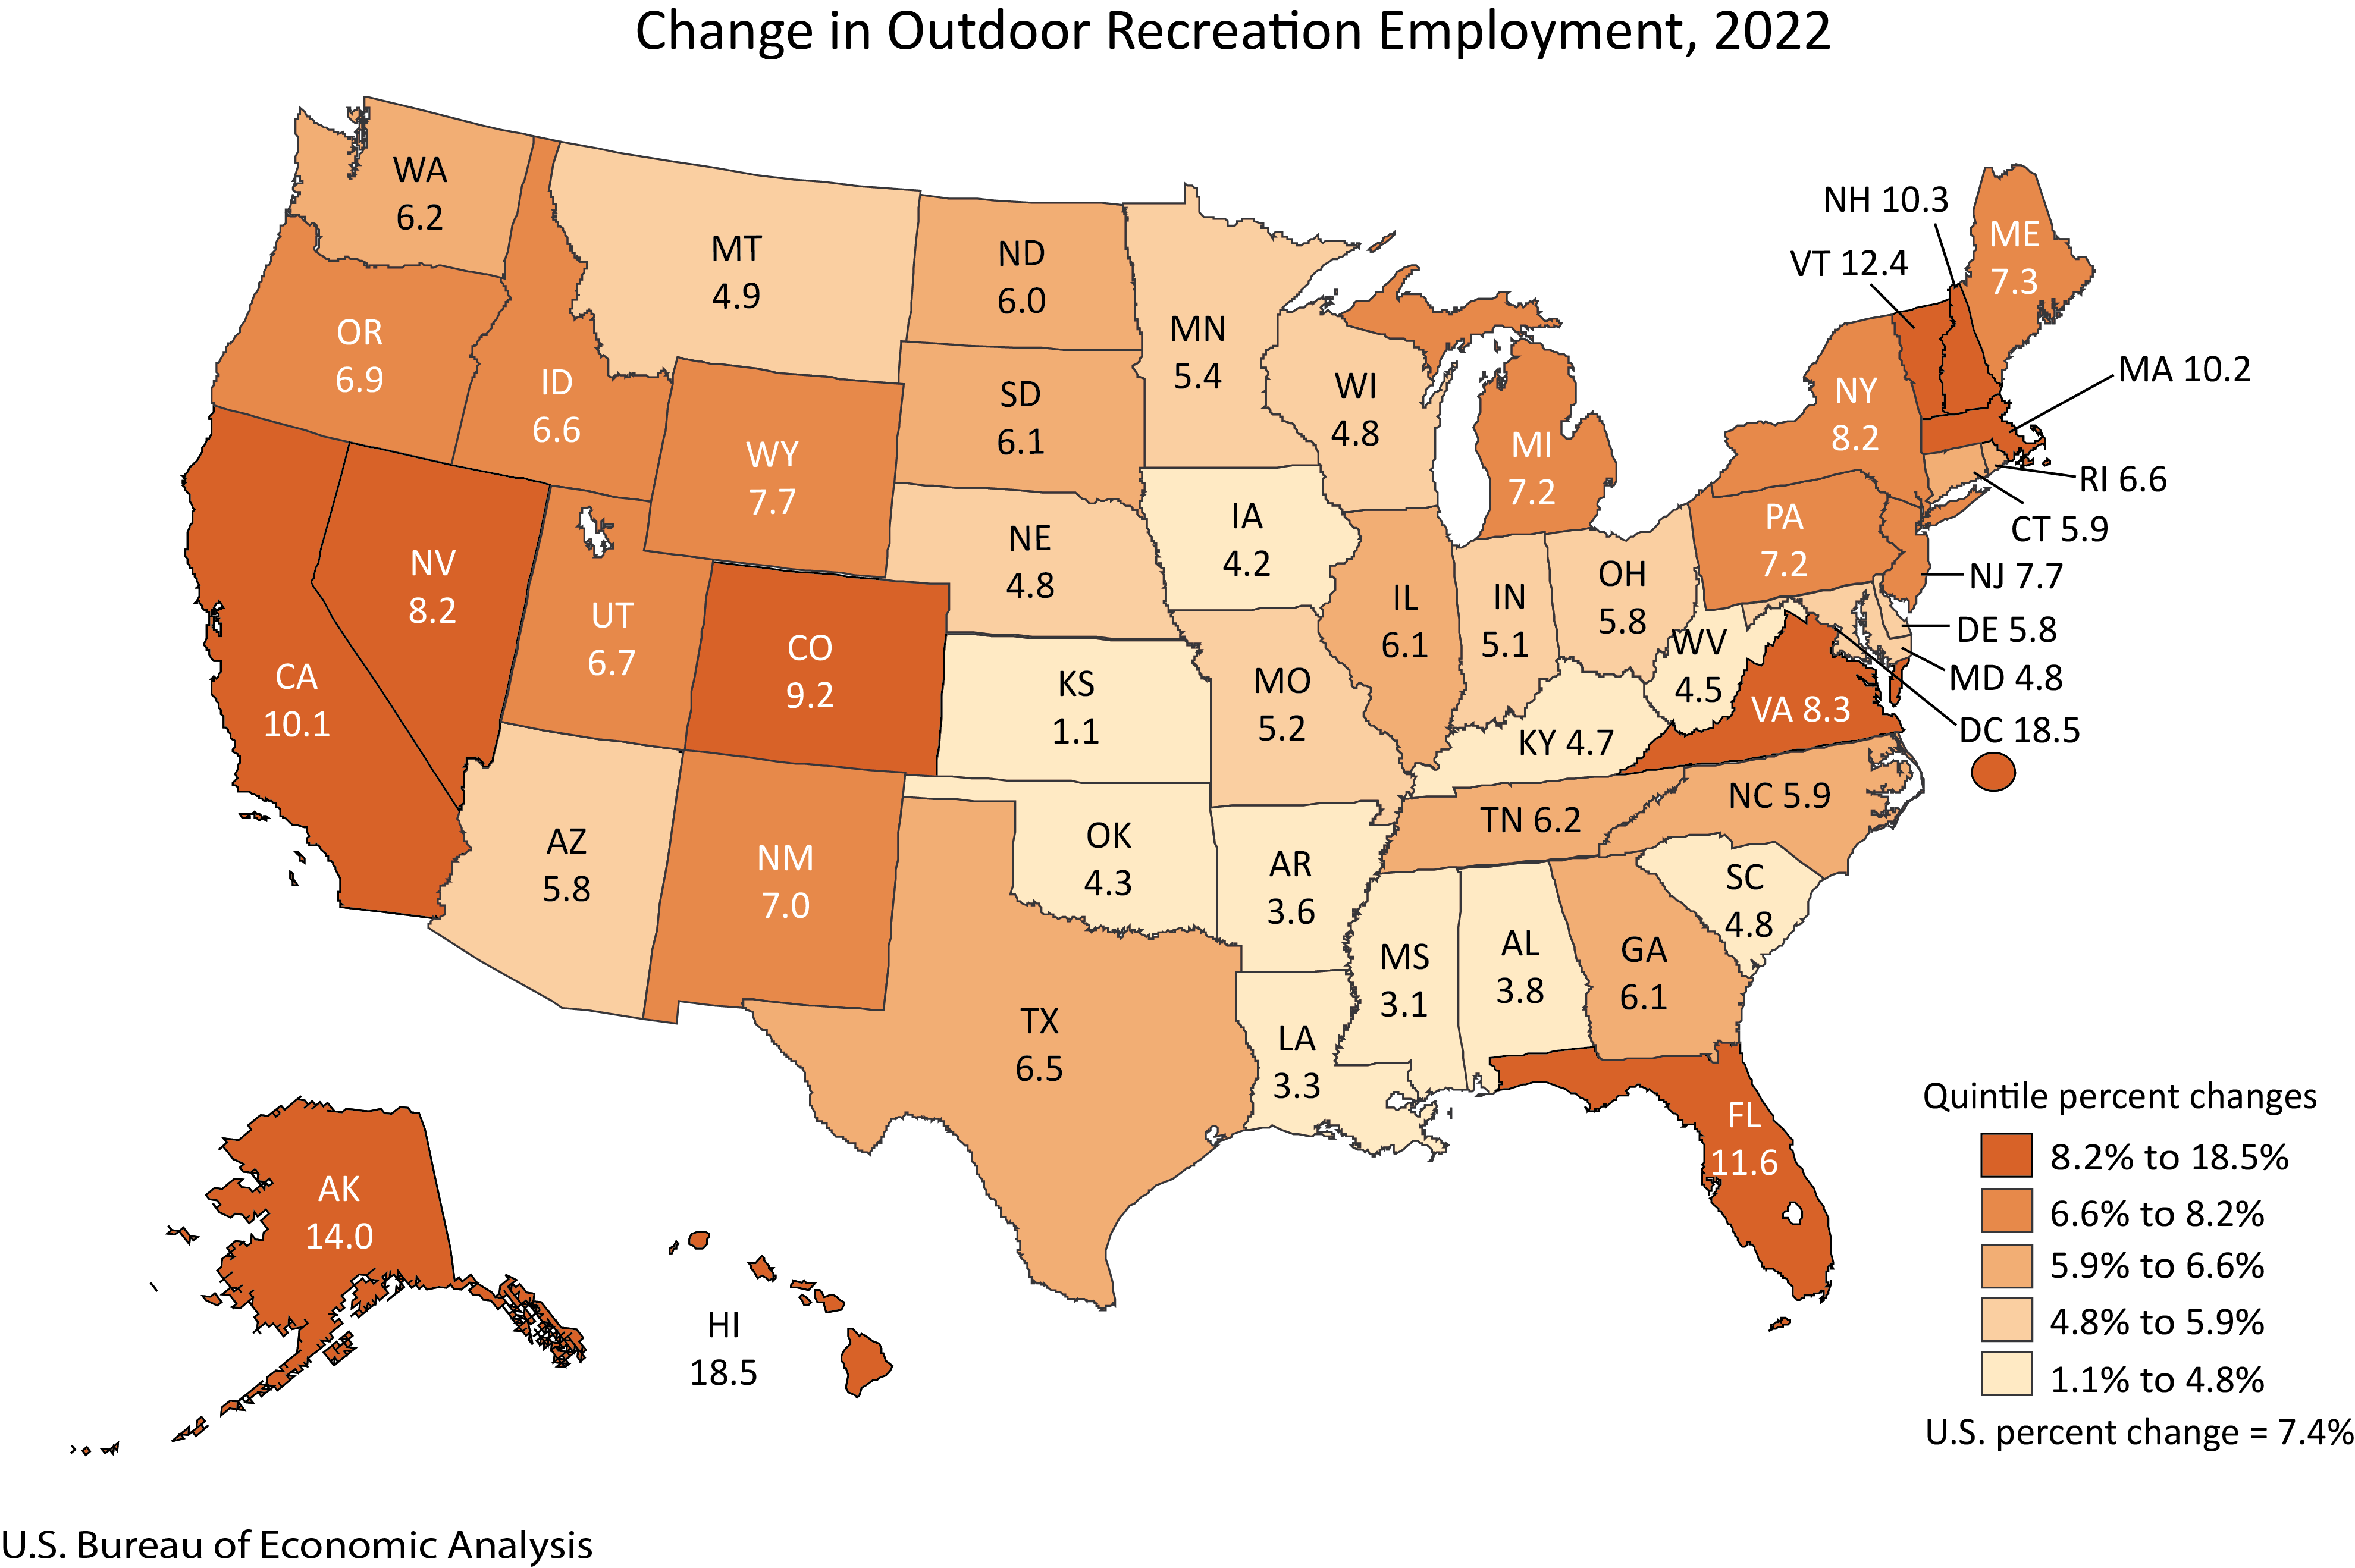
Across all 50 states and the District of Columbia, outdoor recreation employment increased in 2022, ranging from 18.5 percent in Hawaii to 1.1 percent in Kansas. The percentage change was 18.5 percent in the District of Columbia (BEA interactive tables).
Outdoor recreation by activity
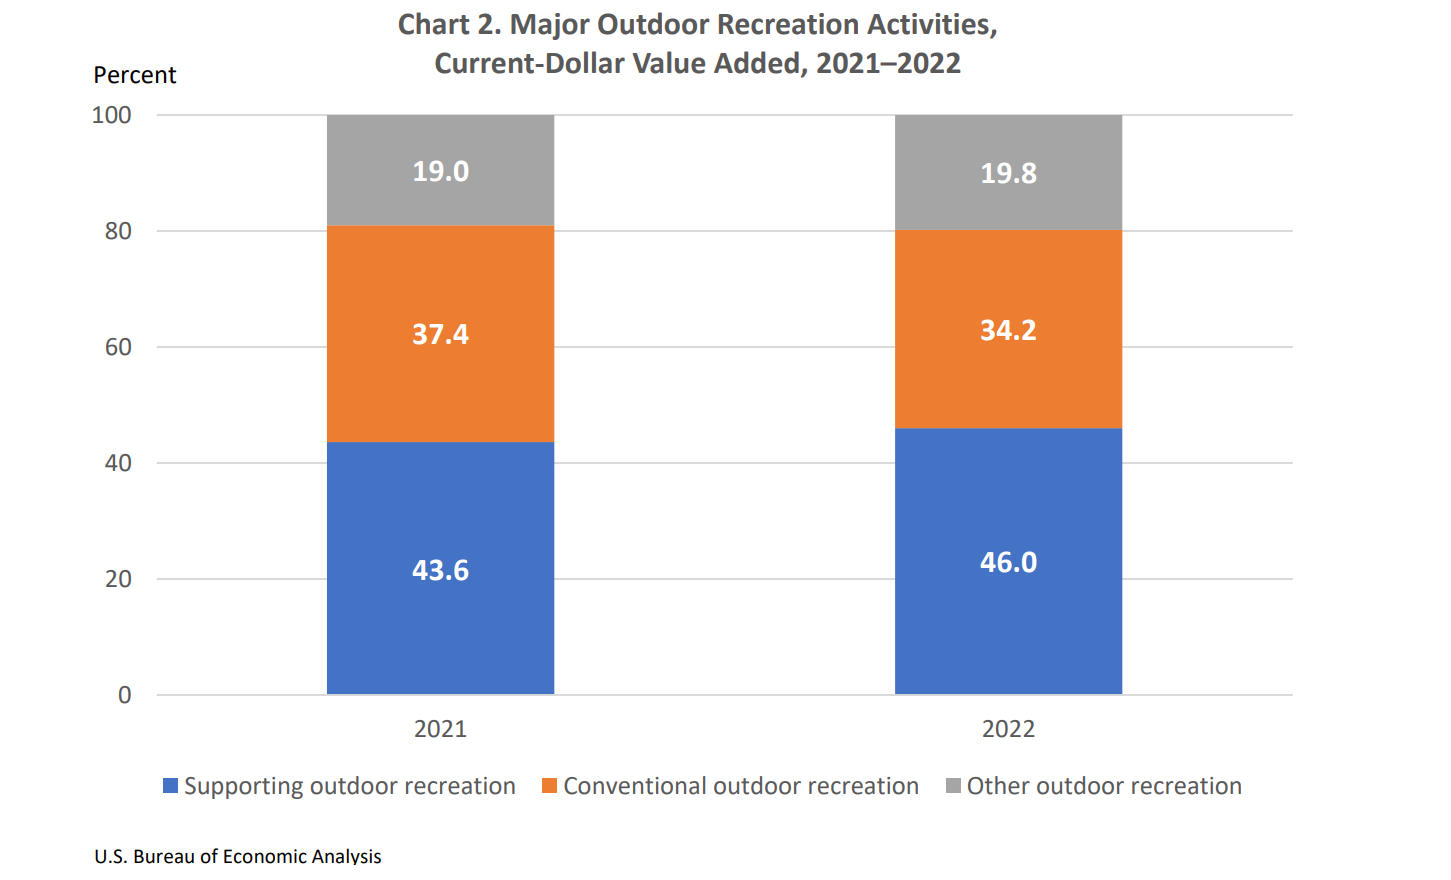
Outdoor recreation activities fall into three general categories: (1) conventional activities such as bicycling, boating, hiking, and hunting, (2) other activities such as gardening and outdoor concerts, and (3) supporting activities such as construction, travel and tourism, local trips, and government expenditures.
In 2022, conventional outdoor recreation accounted for 34.2 percent of U.S. outdoor recreation value added, compared with 37.4 percent in 2021 (chart 2). Other outdoor recreation accounted for 19.8 percent of value added in 2022, compared with 19.0 percent in 2021. Supporting activities accounted for the remaining 46.0 percent of value added in 2022, compared with 43.6 percent in 2021. Growth in supporting activities was led by travel and tourism, reflecting growth in spending on transportation, hotels, and restaurants (national table 4).
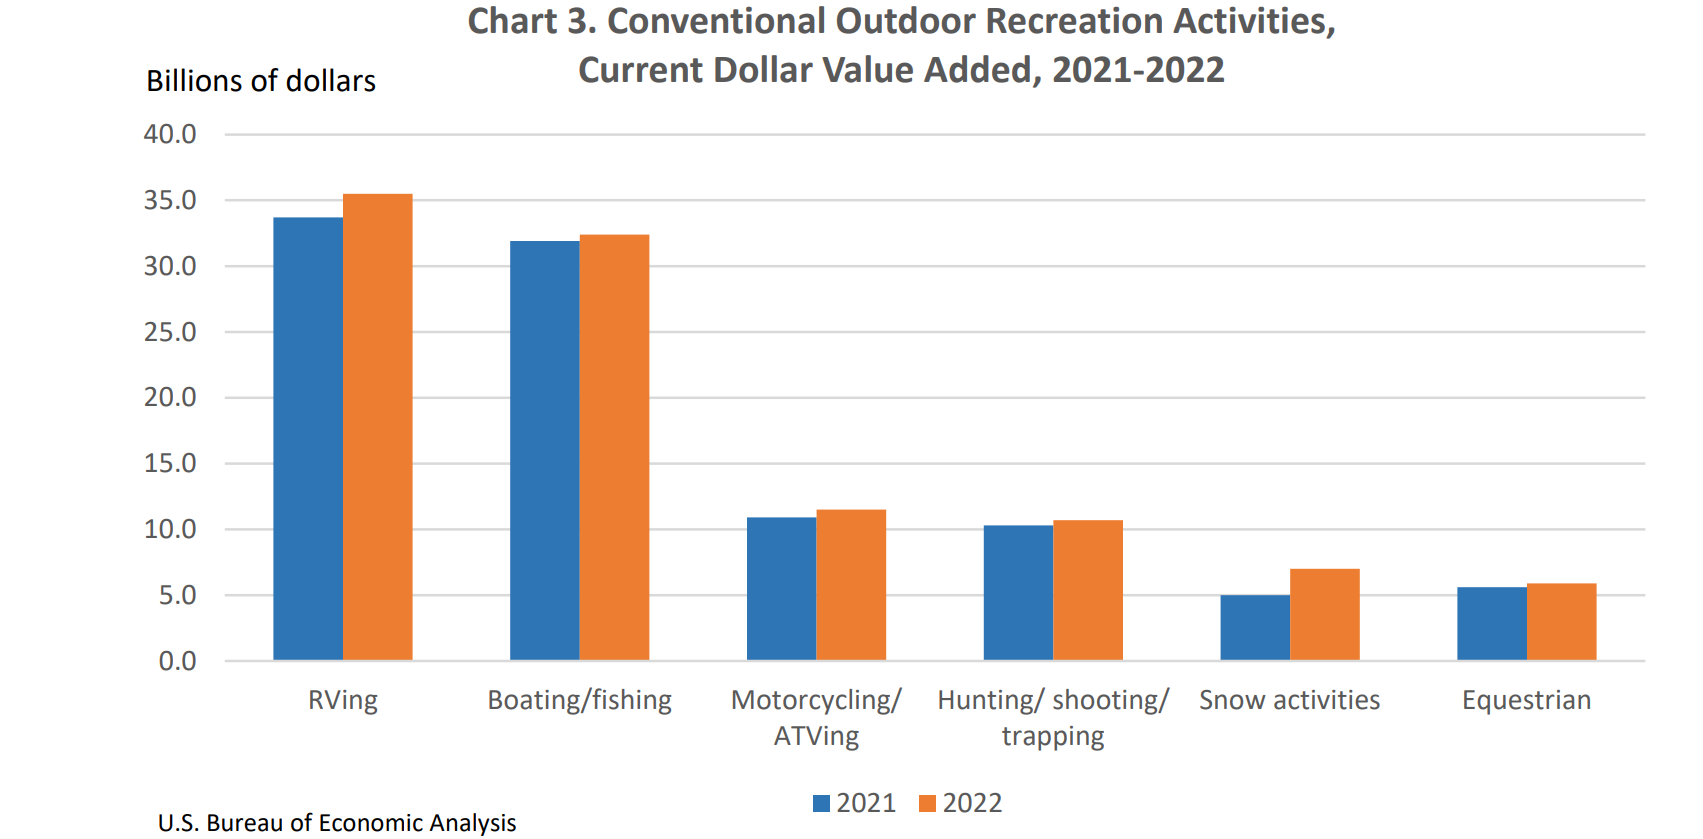
Additional highlights for value added by activity for 2022 are as follows (chart 3 and state table 2):
- RVing was the largest conventional activity for the nation at $35.5 billion in current-dollar value added and was the largest conventional activity in 22 states. The states with the largest contributions were Indiana ($5.9 billion), Texas ($3.6 billion), and California ($3.4 billion).
- Boating/fishing was the second-largest conventional activity for the nation at $32.4 billion in current-dollar value added and was the largest conventional activity in 24 states and the District of Columbia. The states with the largest contributions were Florida ($4.4 billion), California ($2.4 billion), and Texas ($2.1 billion).
- Motorcycling/ATVing was the third-largest conventional activity for the nation at $11.5 billion in current-dollar value added and was the largest conventional activity in Wisconsin. The states with the largest contributions were Wisconsin ($1.1 billion), California ($1.0 billion), and Texas ($877.4 million).
- Snow activities for the nation was $7.0 billion in current-dollar value added and was the largest conventional activity in three states. The states with the largest contributions were Colorado ($1.4 billion), California ($688.2 million), and Utah ($601.8 million).
Outdoor recreation by industry
The outdoor recreation by industry data show the contributions of industries to the outdoor recreation economy, including their impact on value added, gross output, employment, and compensation.
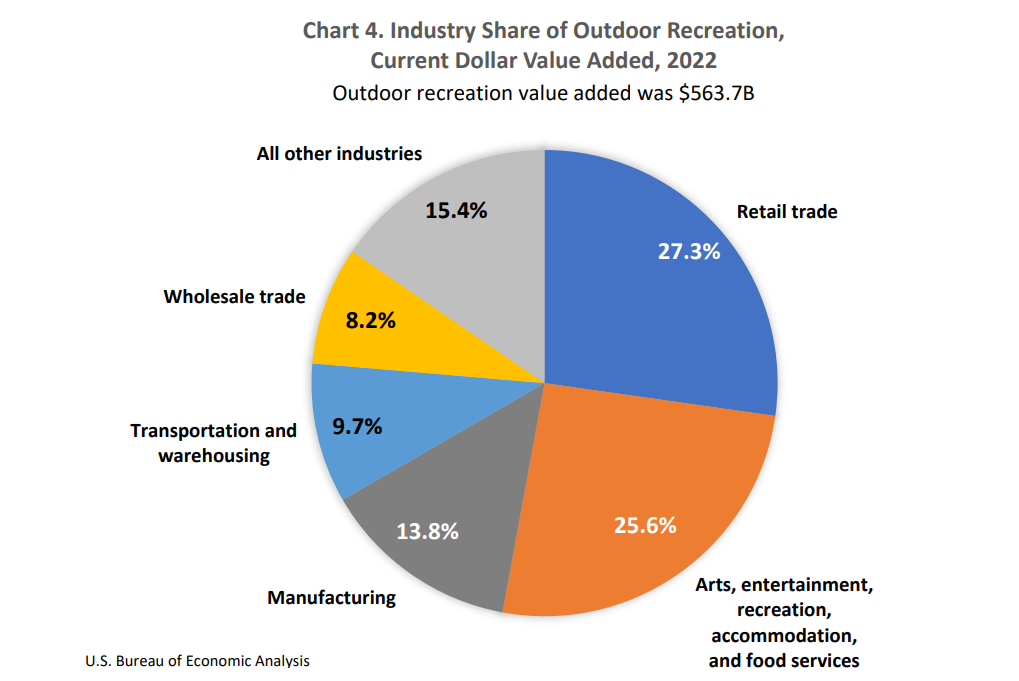
For the nation, the retail trade industry group was the largest contributor to U.S. outdoor recreation current-dollar value added in 2022, accounting for $153.6 billion, or 27.3 percent (chart 4). At the state level, retail trade was the largest contributor to outdoor recreation value added in 28 states. The states with the largest contributions were California ($19.1 billion), Texas ($13.4 billion), and Florida ($12.0 billion) (state table 3).
Arts, entertainment, recreation, accommodation, and food services was the second-largest industry group for the nation at $144.5 billion or 25.6 percent of value added and was the largest industry group in 18 states and the District of Columbia. The states with the largest contributions were California ($19.3 billion), Florida ($18.8 billion), and New York ($10.6 billion).
Manufacturing was the third-largest industry group for the nation at $77.6 billion or 13.8 percent of value added and was the largest industry group in two states. The states with the largest contributions were Texas ($10.3 billion), California ($9.8 billion), and Indiana ($9.2 billion).
Annual update of outdoor recreation satellite account
At the national level, gross output, value added, employment, and compensation now incorporate the results of the 2023 comprehensive update of the National Economic Accounts, which includes the National Income and Product Accounts and the Industry Economic Accounts, and newly available and revised source data. The state statistics now reflect these updated national data as well as the 2023 comprehensive update of the Regional Economic Accounts and newly available and revised regional source data.
With the 2023 comprehensive update, the reference year for output and price measures changed from 2012 to 2017. Quantity and price indexes are expressed as 2017 equal to 100. Updating the reference year did not affect the percent changes in the price or quantity indexes (or in the chained-dollar estimates) because these changes are measured from chain-type indexes.
Estimates for 2012 to 2016 incorporating the comprehensive update were not prepared for this release and will be included in the 2024 release. Previously published estimates are available on BEA’s archive page.
Outdoor Recreation Satellite Account, U.S. and States, 2023