News Release
Activities of U.S. Multinational Enterprises, 2023
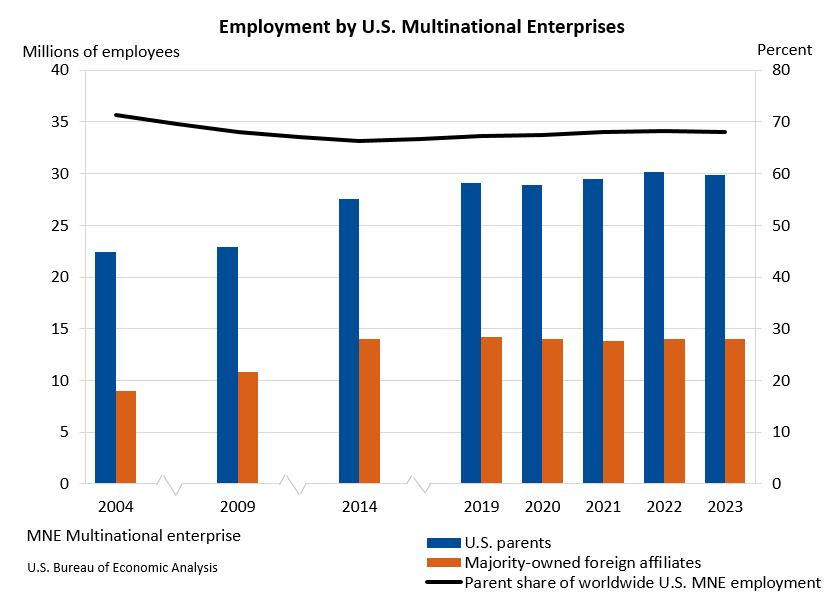
Worldwide employment by U.S. multinational enterprises decreased 0.4 percent to 43.9 million workers in 2023 (preliminary) from 44.1 million workers in 2022 (revised), according to statistics released today by the U.S. Bureau of Economic Analysis on the operations and finances of U.S. parent companies and their foreign affiliates.
Employment in the United States by U.S. parents decreased 0.8 percent to 29.9 million workers in 2023. U.S. parents accounted for 68.1 percent of worldwide employment by U.S. multinational enterprises (MNEs), down from 68.3 percent in 2022. Employment abroad by foreign affiliates of U.S. MNEs increased 0.2 percent to 14.0 million workers and accounted for 31.9 percent of employment by U.S. MNEs worldwide.
U.S. parents accounted for 21.9 percent of total private industry employment in the United States in 2023, down from 22.5 percent in 2022. Employment by U.S. parents was largest in manufacturing, in “other industries,” led by transportation and warehousing, and in retail trade. Employment abroad by majority-owned foreign affiliates was largest in India, Mexico, and the United Kingdom.
Worldwide current-dollar value added of U.S. MNEs decreased 0.6 percent to $6.9 trillion. Value added by U.S. parents, a measure of U.S. parents’ direct contribution to U.S. gross domestic product, decreased 1.0 percent to $5.3 trillion. U.S parents accounted for 21.4 percent of total U.S. private-industry value added, down from 23.1 percent in 2022. Majority-owned foreign affiliate value added increased 0.8 percent to $1.6 trillion. Value added by majority-owned foreign affiliates was largest in the United Kingdom, Canada, and Ireland.
Worldwide expenditures for property, plant, and equipment of U.S. MNEs increased 7.5 percent to $1.1 trillion. Expenditures by U.S. parents accounted for $886.1 billion, and expenditures by majority-owned foreign affiliates accounted for $216.2 billion.
Worldwide research and development (R&D) expenditures of U.S. MNEs increased 7.5 percent to $558.3 billion. U.S. parents accounted for expenditures of $476.6 billion, and majority-owned foreign affiliates accounted for expenditures of $81.7 billion.
Additional statistics on the activities of U.S. parent companies and their foreign affiliates including sales, balance sheet and income statement items, compensation of employees, trade in goods, and more are available on BEA’s website. More industry details for U.S. parents and more industry and country details for foreign affiliates are also available on the website.
Updates to the statistics
Statistics for 2022 were revised to incorporate newly available and revised source data. Preliminary statistics for 2022 were released in August 2024 and highlighted in “Activities of U.S. Multinational Enterprises in 2022” in the Survey of Current Business in September 2024.
| U.S. parents | Majority-owned foreign affiliates | |||
|---|---|---|---|---|
| Preliminary estimate | Revised estimate | Preliminary estimate | Revised estimate | |
| Number of employees (thousands) | 30,240.8 | 30,120.1 | 14,024.0 | 13,974.9 |
| Value added | 5,308.0 | 5,321.2 | 1,644.5 | 1,632.4 |
| Expenditures for property, plant, and equipment | 826.1 | 829.0 | 196.7 | 196.5 |
| Research and development expenditures | 448.9 | 445.2 | 72.6 | 74.1 |
| U.S. Bureau of Economic Analysis | ||||
Related Data Tables
Starting with this release, BEA is not including tables in the body of the news release. For the 2023 activities of U.S. multinational enterprises statistics highlighted in this release, as well as estimates for earlier years, see the below data tables in BEA’s Interactive Data Application and comprehensive data tables.
Selected Data
Selected Financial and Operating Data of U.S. Parents, by Industry of U.S. Parent
Selected Data for Majority-Owned Foreign Affiliates and U.S. Parents in All Industries
Employment
U.S. Parent Companies Employment, by Industry of U.S. Parent Company
Majority-Owned Foreign Affiliate Employment, by Country
Majority-Owned Foreign Affiliate Employment, by Industry of Affiliate
Majority-Owned Foreign Affiliate Employment, by Country and Industry
Value added
U.S. Parent Companies Value Added, by Industry of U.S. Parent Company
Majority-Owned Foreign Affiliates Value Added, by Country
Majority-Owned Foreign Affiliates Value Added, by Industry of Affiliate
Expenditures for property, plant, and equipment (capital expenditures)
U.S. Parent Companies Capital Expenditures, by Industry of U.S. Parent Company
Majority-Owned Foreign Affiliates Capital Expenditures, by Country
Majority-Owned Foreign Affiliates Capital Expenditures, by Industry of Affiliate
R&D expenditures
U.S. Parent Companies R&D Expenditures, by Industry of U.S. Parent Company
Majority-Owned Foreign Affiliates R&D Expenditures, by Country
Majority-Owned Foreign Affiliates R&D Expenditures, by Industry of Affiliate
Note. With the release of 2024 activities of U.S. MNE statistics in November 2026, the 2023 data will be superseded and can then be accessed in BEA’s Data Archive.
Discontinued tables
Some data tables previously produced alongside this news release have been discontinued as of August 22, 2025. Selected annual data tables, including statistics on foreign affiliates with 50 percent or less U.S. ownership and supplemental industry statistics, will be impacted or discontinued and have been archived. These tables have never been part of the data tables included in the body of the news releases.
Activities of U.S. Multinational Enterprises, 2024


