
News Release
U.S. International Transactions, 3rd Quarter 2025
Current-Account Balance (Table 1)
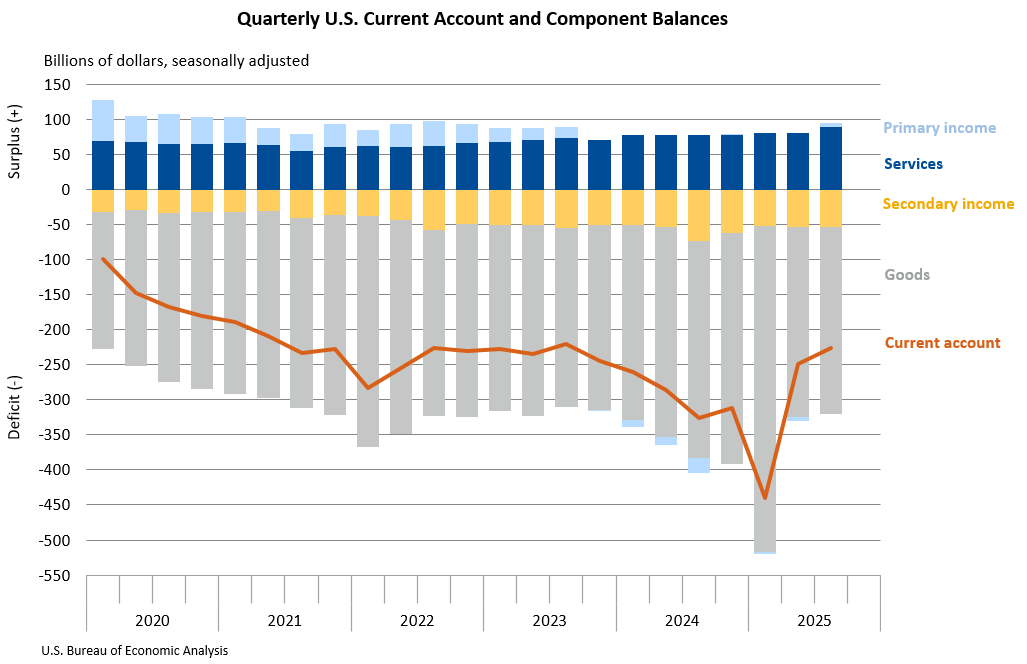
The U.S. current-account deficit, which reflects the combined balances on trade in goods and services and income flows between U.S. residents and residents of other countries, narrowed by $22.8 billion, or 9.2 percent, to $226.4 billion in the third quarter of 2025, according to statistics released today by the U.S. Bureau of Economic Analysis. The revised second-quarter deficit was $249.2 billion.
The third-quarter deficit was 2.9 percent of current-dollar gross domestic product, down from 3.3 percent in the second quarter.
The $22.8 billion narrowing of the current-account deficit in the third quarter reflected a shift in the balance on primary income from a deficit in the second quarter to a surplus in the third quarter, an expanded surplus on services, and a reduced deficit on goods.
Current-Account Transactions (Tables 1–5)
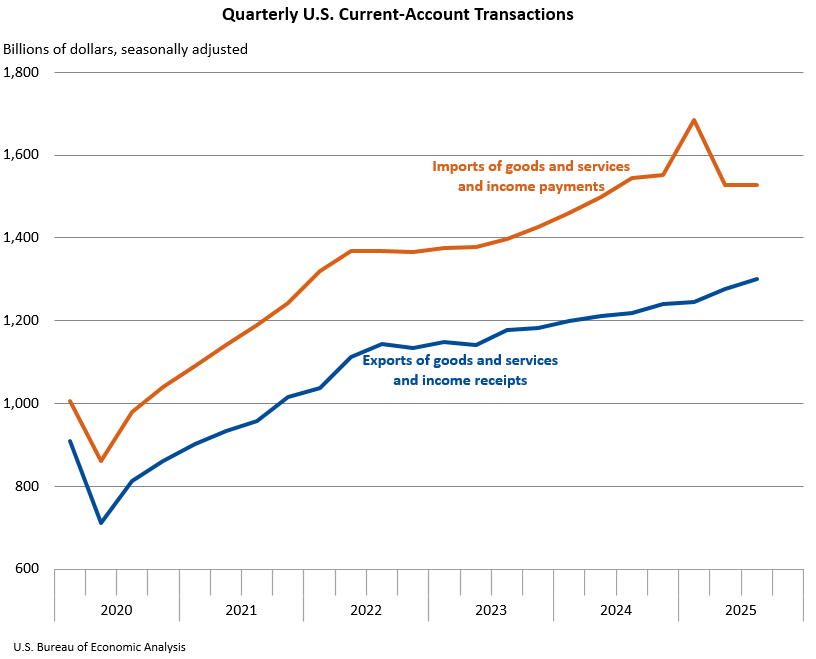
Exports of goods and services to, and income received from, foreign residents increased $24.1 billion to $1.30 trillion in the third quarter. Imports of goods and services from, and income paid to, foreign residents increased $1.3 billion to $1.53 trillion.1
Trade in goods (table 2)
Exports of goods decreased $1.9 billion to $548.0 billion, reflecting a decrease in nonmonetary gold that was partly offset by increases in capital goods and in consumer goods. Imports of goods decreased $5.0 billion to $815.4 billion, reflecting a decrease in consumer goods that was largely offset by an increase in nonmonetary gold. (See “Additional Information” for a definition of nonmonetary gold under “Goods.”)
Trade in services (table 3)
Exports of services increased $11.7 billion to $314.2 billion, and imports of services increased $3.1 billion to $225.0 billion. The increases in both exports and imports were led by “other business services,” mostly professional and management consulting services.
Primary income (table 4)
Receipts of primary income (earned income) increased $16.3 billion to $395.2 billion, reflecting increases in all major categories. The increases were led by direct investment income. Payments of primary income increased $5.3 billion to $390.0 billion, mostly reflecting an increase in “other investment income,” primarily interest on loans and deposits.
Secondary income (table 5)
Receipts of secondary income (current transfers) decreased $2.0 billion to $44.4 billion, reflecting a decrease in private transfers. Payments of secondary income decreased $2.1 billion to $97.9 billion, reflecting a decrease in general government transfers.
Capital-Account Transactions (Table 1)
Capital-transfer receipts increased $164 million to $181 million in the third quarter. Capital-transfer payments decreased $659 million to $1.3 billion.
Financial-Account Transactions (Tables 1, 6, 7, and 8)
Net financial-account transactions were −$409.9 billion in the third quarter, reflecting net U.S. borrowing from foreign residents.
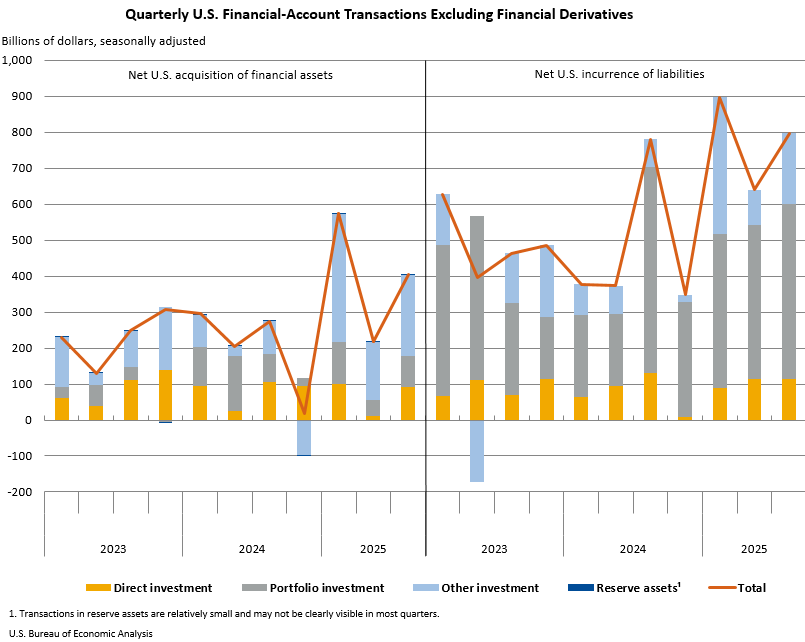
Financial assets (tables 1, 6, 7, and 8)
Third-quarter transactions increased U.S. residents’ foreign financial assets by $403.4 billion. Transactions increased “other investment assets” by $224.4 billion; direct investment assets by $91.9 billion; portfolio investment assets by $86.2 billion; and reserve assets by $0.9 billion.
Liabilities (tables 1, 6, 7, and 8)
Third-quarter transactions increased U.S. liabilities to foreign residents by $797.2 billion. Transactions increased portfolio investment liabilities by $486.8 billion; “other investment liabilities” by $195.9 billion; and direct investment liabilities by $114.6 billion.
Financial derivatives (table 1)
Net transactions in financial derivatives were −$16.1 billion in the third quarter, reflecting net U.S. borrowing from foreign residents.
Updates to Second-Quarter 2025 International Transactions Accounts Balances [Billions of dollars, seasonally adjusted] | ||
|---|---|---|
| Preliminary estimates | Revised estimates | |
| Current-account balance | –251.3 | –249.2 |
| Goods balance | –270.0 | –270.4 |
| Services balance | 79.6 | 80.6 |
| Primary income balance | –7.7 | –5.8 |
| Secondary income balance | –53.2 | –53.6 |
| Net financial-account transactions | – 406.9 | –396.7 |
| U.S. Bureau of Economic Analysis | ||
New Combined News Release and Changes in the Presentation of Tables
Beginning in March 2026, BEA will publish the quarterly U.S. international transactions and international investment position accounts in a single news release. This combined quarterly release will provide a broader view of U.S. participation in the global economy and will replace the publication of two separate releases issued on different days, accelerating the availability of international investment position statistics.
In addition, as part of BEA’s ongoing modernization and streamlining of news release packages, the statistics currently published as tables within the releases will not be included in the body of the combined release. Instead, the release will include dynamic links to featured data available in BEA’s Interactive Data Application. This will reduce duplication, increase efficiency, and point data users directly to BEA’s most complete and flexible data tables via links in the release. These customizable tables include full time series and can be downloaded as PDFs, in Excel, or in CSV format.
Next release: March 25, 2026, at 8:30 a.m. EDT
U.S. International Transactions and Investment Position, 4th Quarter and Year 2025
| U.S. International Transactions and Investment Position Release Dates in 2026 | |
|---|---|
| 4th Quarter and Year 2025 | March 25 |
| 1st Quarter 2026 and Annual Update | June 24 |
| 2nd Quarter 2026 | September 24 |
| 3rd Quarter 2026 | December 18 |