BEA 22-47
Scheduled Date
September 30 08:30:am
Release Title
Personal Income and Outlays, August 2022 and Annual Update

An official website of the United States government
|
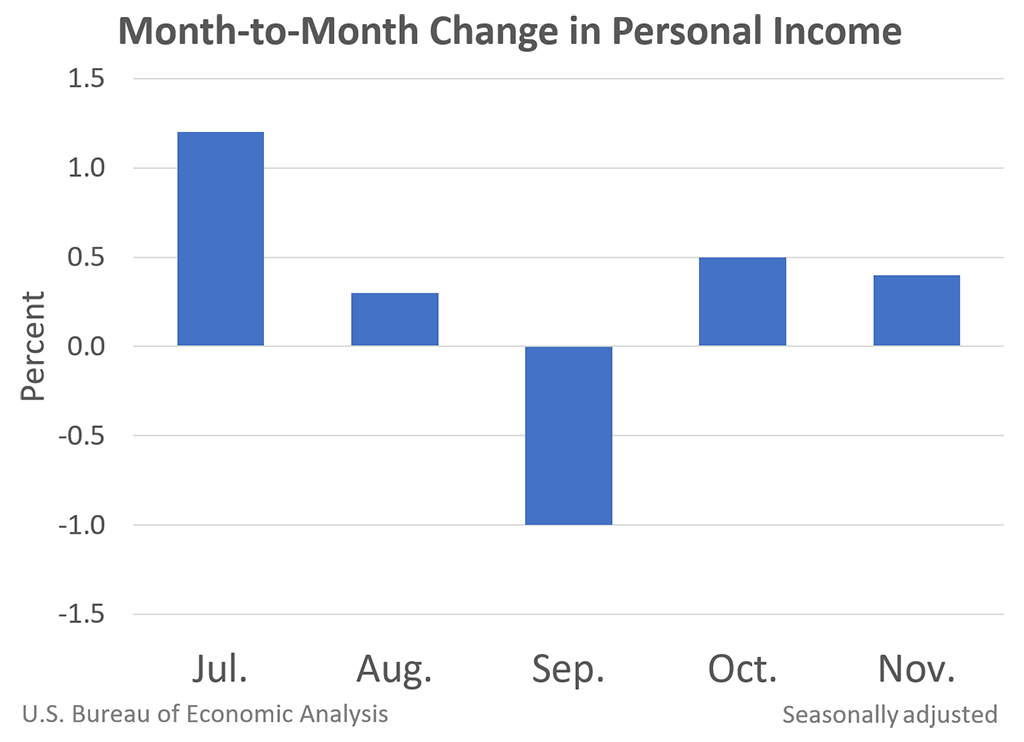
November 2021
|
+0.4%
|
|
October 2021
|
+0.5 %
|
Personal income increased$90.4 billion, or 0.4 percent at a monthly rate, while consumer spending increased$104.7 billion, or 0.6 percent, in November. The increase in personal income primarily reflected increases in compensation of employees and government social benefits. The personal saving rate (that is, personal saving as a percentage of disposable personal income) was 6.9 percent in November, compared with 7.1 percent in October.