International Trade in Goods and Services
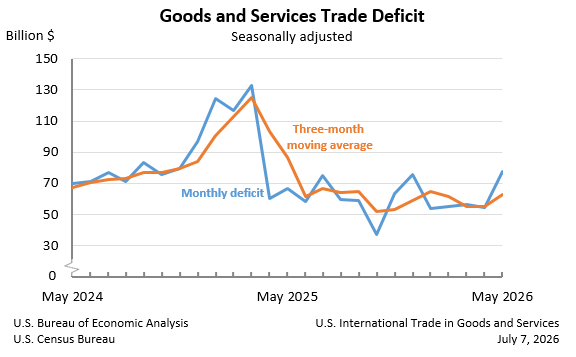
U.S. International Trade in Goods and Services, May 2026
|
May 2026
|
-$77.6 B
|
|
April 2026
|
-$54.6 B
|
The U.S. goods and services trade deficit increased in May 2026 according to the U.S. Bureau of Economic Analysis and the U.S. Census Bureau. The deficit increased from $54.6 billion in April (revised) to $77.6 billion in May, as exports decreased and imports increased. The goods deficit increased $23.6 billion in May to $106.5 billion. The services surplus increased $0.6 billion in May to $28.9 billion.
- Current release: July 7, 2026
- Next release: August 4, 2026
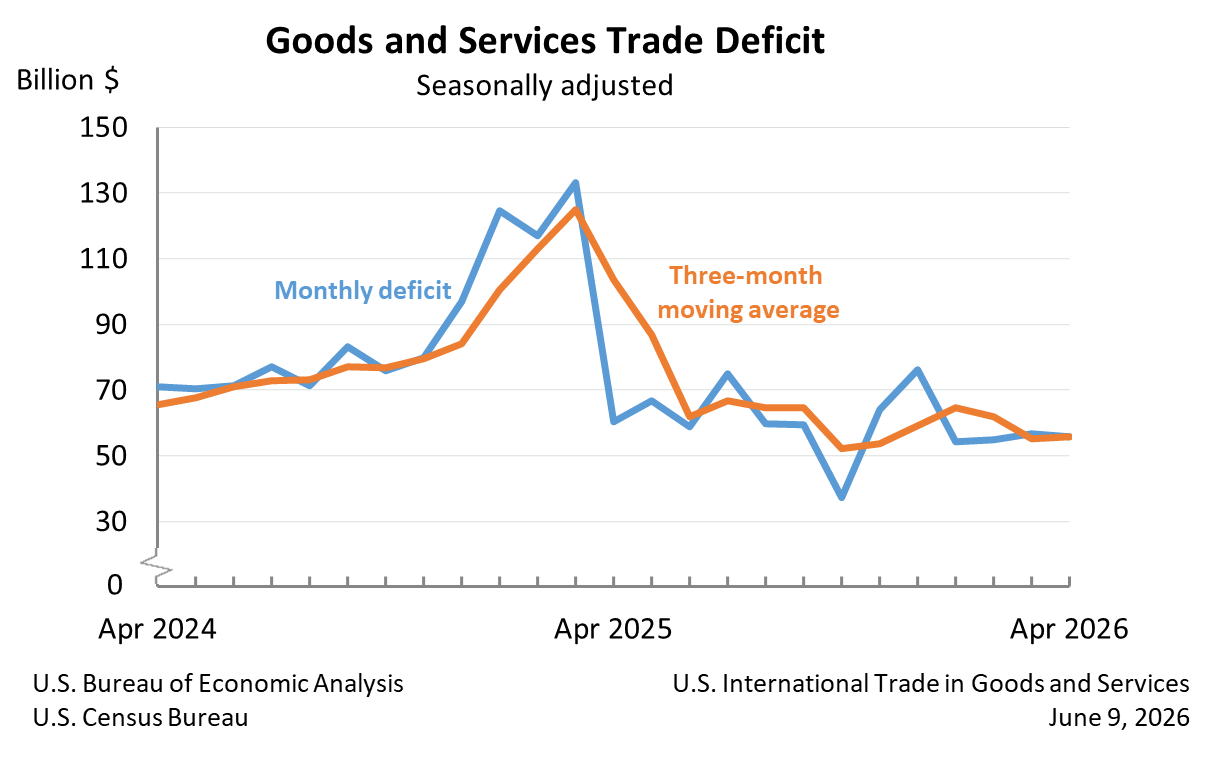
U.S. International Trade in Goods and Services, April 2026
|
April 2026
|
-$55.9 B
|
|
March 2026
|
-$56.6 B
|
The U.S. monthly international trade deficit decreased in April 2026 according to the U.S. Bureau of Economic Analysis and the U.S. Census Bureau. The deficit decreased from $56.6 billion in March (revised) to $55.9 billion in April, as exports increased more than imports. The goods deficit decreased $2.4 billion in April to $83.7 billion. The services surplus decreased $1.7 billion in April to $27.8 billion.
- Current release: June 9, 2026
- Next release: July 7, 2026
U.S. International Trade in Goods and Services, Annual Revision
In this release and in the accompanying “U.S. International Trade in Goods and Services, April 2026” release (FT–900), the U.S. Census Bureau and the U.S. Bureau of Economic Analysis (BEA) are publishing revised statistics on trade in goods and services. With these releases, statistics on trade in goods are revised beginning with 2021, and statistics on trade in services are revised beginning with 1999.
- Current release: June 9, 2026
- Next release: July 7, 2026
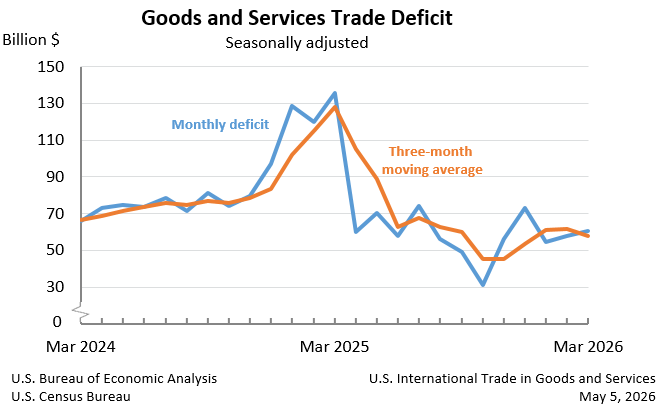
U.S. International Trade in Goods and Services, March 2026
|
March 2026
|
-$60.3 B
|
|
February 2026
|
-$57.8 B
|
The U.S. monthly international trade deficit increased in March 2026 according to the U.S. Bureau of Economic Analysis and the U.S. Census Bureau. The deficit increased from $57.8 billion in February (revised) to $60.3 billion in March, as imports increased more than exports. The goods deficit increased $4.1 billion in March to $88.7 billion. The services surplus increased $1.6 billion in March to $28.4 billion.
- Current release: May 5, 2026
- Next release: June 9, 2026
U.S. International Trade in Goods and Services, February 2026
|
February 2026
|
-$57.3 B
|
|
January 2026
|
-$54.7 B
|
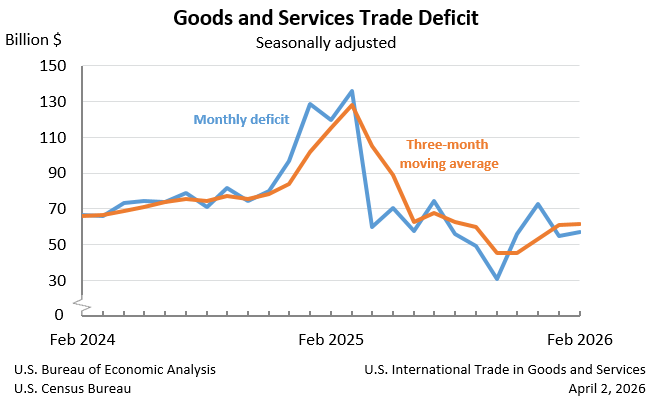
The U.S. monthly international trade deficit increased in February 2026 according to the U.S. Bureau of Economic Analysis and the U.S. Census Bureau. The deficit increased from $54.7 billion in January (revised) to $57.3 billion in February, as imports increased more than exports. The goods deficit increased $2.5 billion in February to $84.6 billion. The services surplus decreased $0.2 billion in February to $27.3 billion.
- Current release: April 2, 2026
- Next release: May 5, 2026
U.S. International Trade in Goods and Services, January 2026
|
January 2026
|
-$54.5 B
|
|
December 2025
|
-$72.9 B
|
The U.S. monthly international trade deficit decreased in January 2026 according to the U.S. Bureau of Economic Analysis and the U.S. Census Bureau. The deficit decreased from $72.9 billion in December (revised) to $54.5 billion in January, as exports increased and imports decreased. The goods deficit decreased $17.5 billion in January to $81.8 billion. The services surplus increased $1.0 billion in January to $27.3 billion.
- Current release: March 12, 2026
- Next release: April 2, 2026

U.S. International Trade in Goods and Services, December and Annual 2025
|
December 2025
|
-$70.3 B
|
|
November 2025
|
-$53.0 B
|
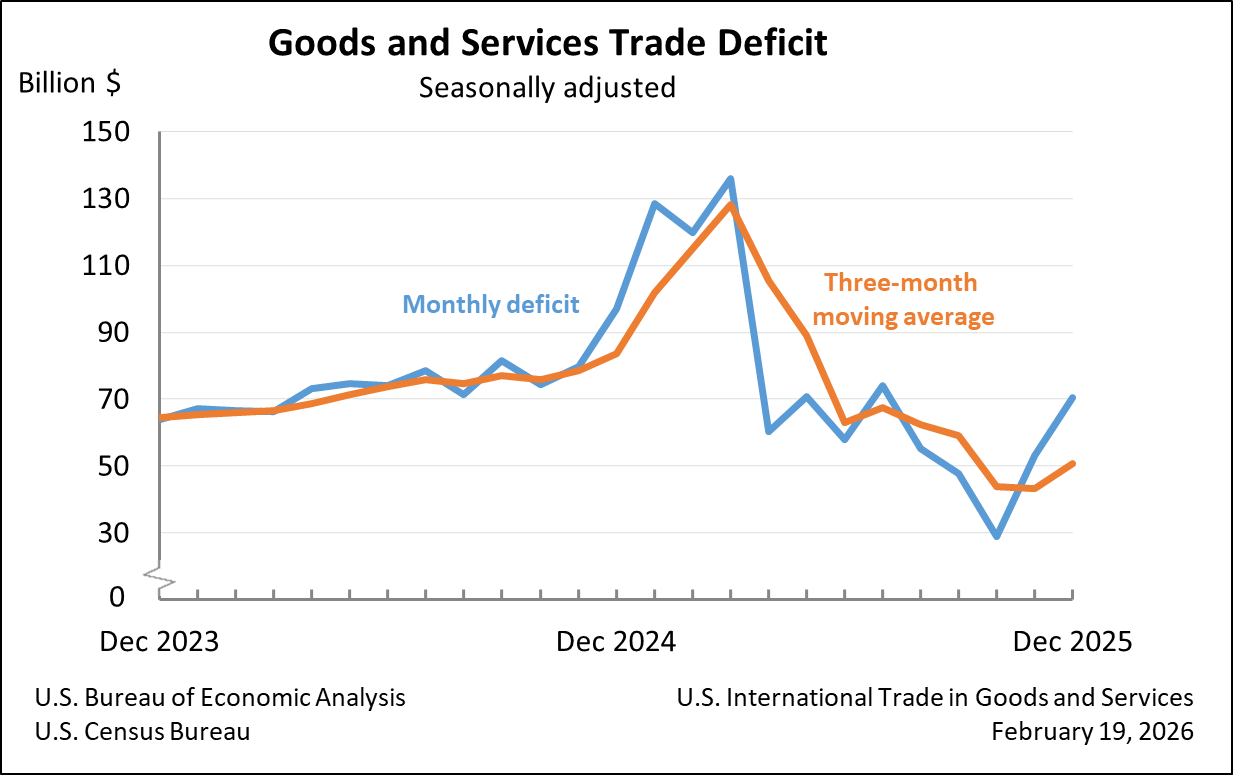
The U.S. monthly international trade deficit increased in December 2025 according to the U.S. Bureau of Economic Analysis and the U.S. Census Bureau. The deficit increased from $53.0 billion in November (revised) to $70.3 billion in December, as imports increased and exports decreased. The goods deficit increased $15.7 billion in December to $99.3 billion. The services surplus decreased $1.6 billion in December to $29.0 billion.
- Current release: February 19, 2026
- Next release: March 12, 2026
U.S. International Trade in Goods and Services, November 2025
|
November 2025
|
-$56.8 B
|
|
October 2025
|
-$29.2 B
|
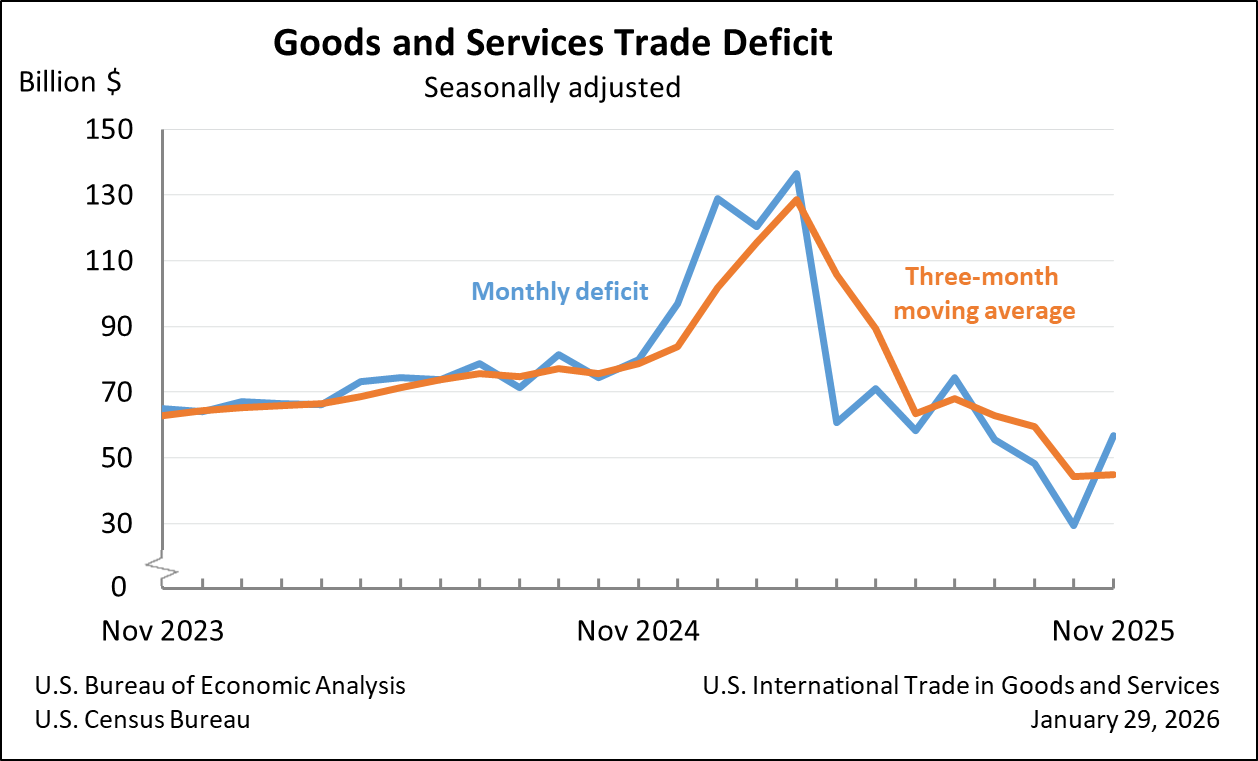
The U.S. goods and services trade deficit increased in November 2025 according to the U.S. Bureau of Economic Analysis and the U.S. Census Bureau. The deficit increased from $29.2 billion in October (revised) to $56.8 billion in November, as exports decreased and imports increased. The goods deficit increased $27.9 billion in November to $86.9 billion. The services surplus increased $0.3 billion in November to $30.1 billion.
- Current release: January 29, 2026
- Next release: February 19, 2026
U.S. International Trade in Goods and Services, October 2025
|
October 2025
|
-$29.4 B
|
|
September 2025
|
-$48.1 B
|
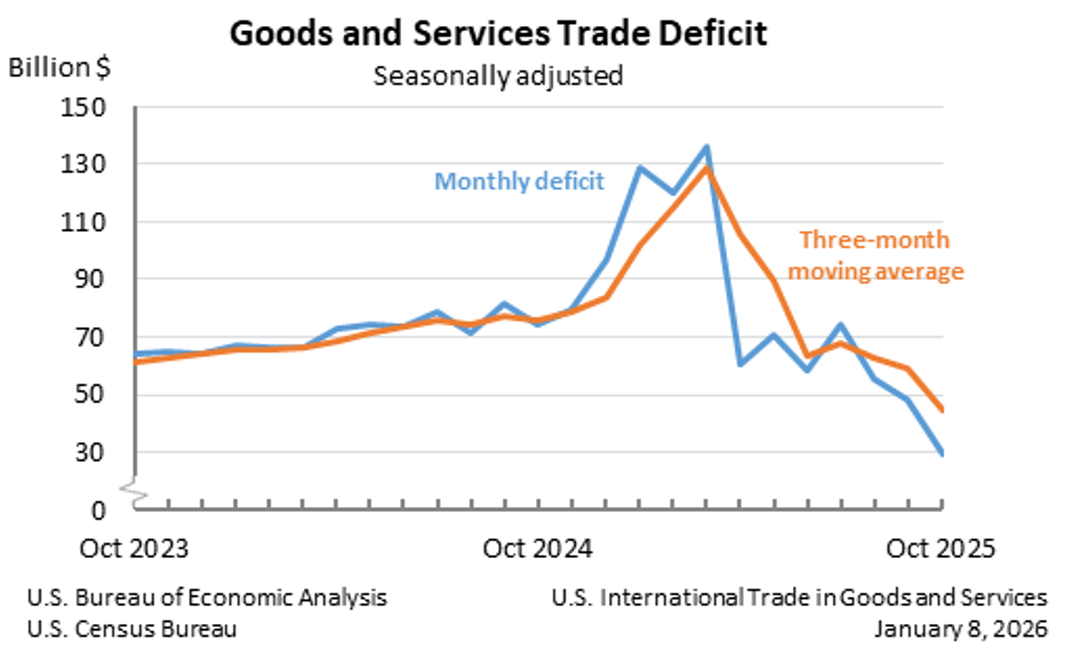
The U.S. goods and services trade deficit decreased in October 2025 according to the U.S. Bureau of Economic Analysis and the U.S. Census Bureau. The deficit decreased from $48.1 billion in September (revised) to $29.4 billion in October, as exports increased and imports decreased. The goods deficit decreased $19.2 billion in October to $59.1 billion. The services surplus decreased $0.4 billion in October to $29.8 billion.
- Current release: January 8, 2026
- Next release: January 29, 2026
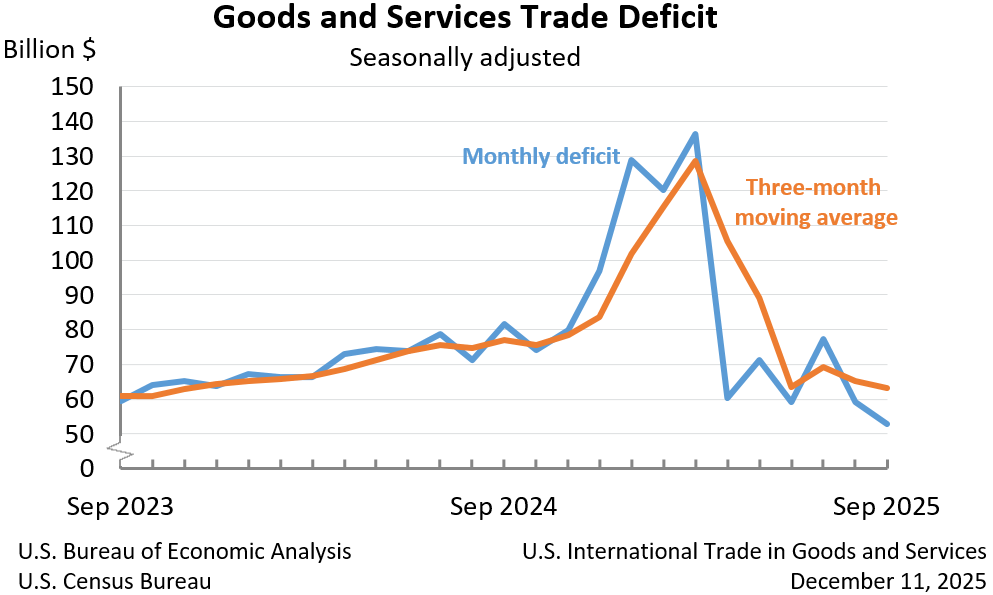
U.S. International Trade in Goods and Services September 2025
|
September 2025
|
-$52.8 B
|
|
August 2025
|
-$59.3 B
|
The U.S. goods and services trade deficit decreased in September 2025 according to the U.S. Bureau of Economic Analysis and the U.S. Census Bureau. The deficit decreased from $59.3 billion in August (revised) to $52.8 billion in September, as exports increased more than imports. The goods deficit decreased $7.1 billion in September to $79.0 billion. The services surplus decreased $0.6 billion in September to $26.2 billion.
- Current release: December 11, 2025
- Next release: January 8, 2026