BEA 24-44
Scheduled Date
September 27 08:30:am
Release Title
Personal Income and Outlays, August 2024

An official website of the United States government
|
August 2023
|
+0.4%
|
|
July 2023
|
+0.2%
|
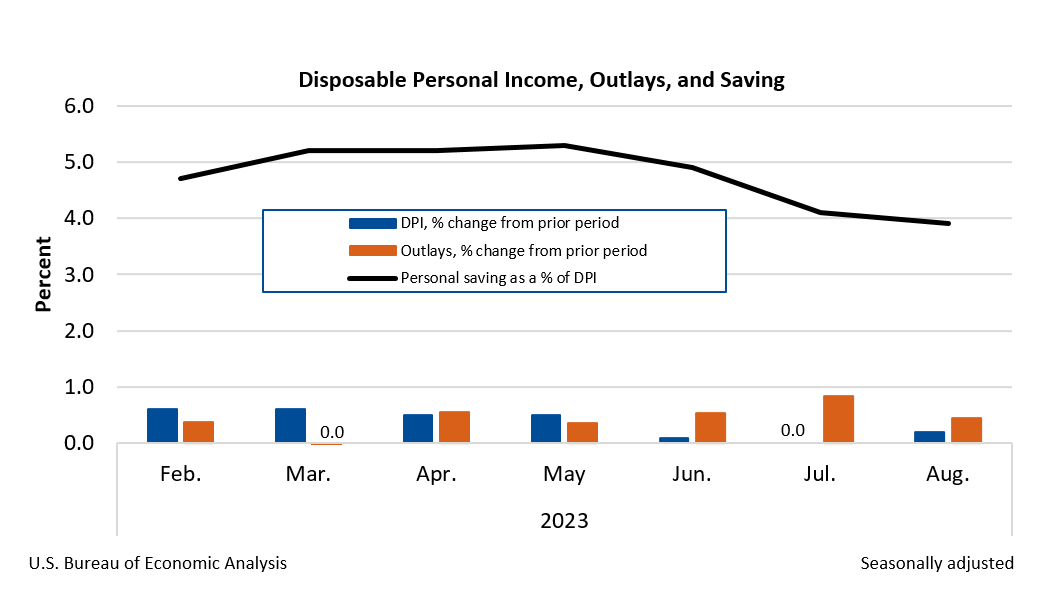
Personal income increased $87.6 billion (0.4 percent at a monthly rate) in August. Disposable personal income (DPI)—personal income less personal current taxes— increased $46.6 billion (0.2 percent). Personal outlays—the sum of personal consumption expenditures (PCE), personal interest payments, and personal current transfer payments—increased $86.0 billion (0.4 percent) and consumer spending increased $83.6 billion (0.4 percent). Personal saving was $794.1 billion and the personal saving rate—personal saving as a percentage of disposable personal income—was 3.9 percent in August.