
BEA 24-62
Scheduled Date
December 20 08:30:am
Release Title
Personal Income and Outlays, November 2024

An official website of the United States government
|
February 2024
|
+0.3%
|
|
January 2024
|
+1.0%
|
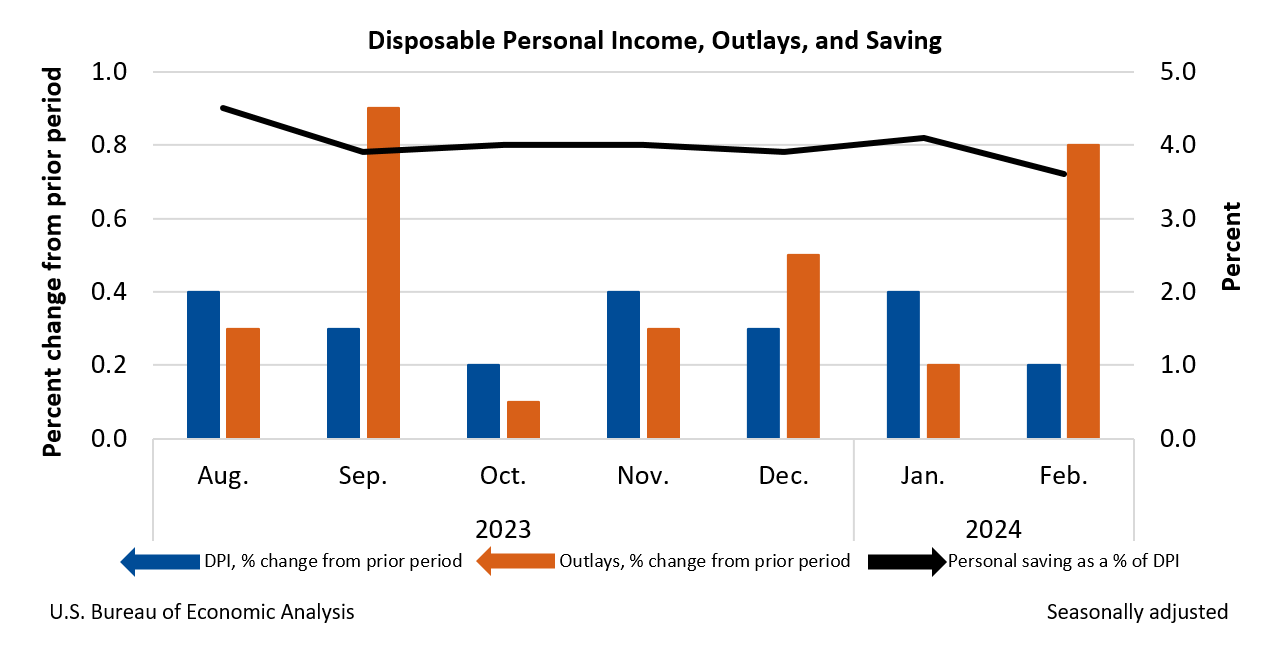
Personal income increased $66.5 billion (0.3 percent at a monthly rate) in February. Disposable personal income (DPI)—personal income less personal current taxes—increased $50.3 billion (0.2 percent). Consumer spending increased $145.5 billion (0.8 percent). Personal saving was $745.7 billion and the personal saving rate—personal saving as a percentage of disposable personal income—was 3.6 percent in February. Personal outlays—the sum of personal consumption expenditures (PCE), personal interest payments, and personal current transfer payments—increased $149.9 billion.
|
January 2024
|
+1.0%
|
|
December 2023
|
+0.3%
|
Personal income increased $233.7 billion (1.0 percent at a monthly rate) in January. Disposable personal income (DPI)—personal income less personal current taxes—increased $67.6 billion (0.3 percent). Personal outlays—the sum of personal consumption expenditures (PCE), personal interest payments, and personal current transfer payments—increased $54.3 billion (0.3 percent) and consumer spending increased $43.9 billion (0.2 percent). Personal saving was $779.3 billion and the personal saving rate—personal saving as a percentage of disposable personal income—was 3.8 percent in January.
|
December 2023
|
+0.3%
|
|
November 2023
|
+0.4%
|
Personal income increased $60.0 billion (0.3 percent at a monthly rate) in December. Disposable personal income (DPI)—personal income less personal current taxes—increased $51.8 billion (0.3 percent). Personal outlays—the sum of personal consumption expenditures (PCE), personal interest payments, and personal current transfer payments—increased $134.7 billion (0.7 percent) and consumer spending increased $133.9 billion (0.7 percent). Personal saving was $766.7 billion and the personal saving rate—personal saving as a percentage of disposable personal income—was 3.7 percent in December.
|
November 2023
|
+0.4%
|
|
October 2023
|
+0.3%
|
Personal income increased $81.6 billion (0.4 percent at a monthly rate) in November. Disposable personal income (DPI)—personal income less personal current taxes—increased $71.9 billion (0.4 percent). Personal outlays—the sum of personal consumption expenditures (PCE), personal interest payments, and personal current transfer payments—increased $47.8 billion (0.2 percent) and consumer spending increased $46.7 billion (0.2 percent). Personal saving was $839.8 billion and the personal saving rate—personal saving as a percentage of disposable personal income—was 4.1 percent in November.
|
October 2023
|
+0.2%
|
|
September 2023
|
+0.4%
|
Personal income increased $57.1 billion (0.2 percent at a monthly rate) in October. Disposable personal income (DPI)—personal income less personal current taxes—increased $63.4 billion (0.3 percent). Personal outlays—the sum of personal consumption expenditures (PCE), personal interest payments, and personal current transfer payments—increased $43.8 billion (0.2 percent) and consumer spending increased $41.2 billion (0.2 percent). Personal saving was $768.6 billion and the personal saving rate—personal saving as a percentage of disposable personal income—was 3.8 percent in October.
|
September 2023
|
+0.3%
|
|
August 2023
|
+0.4%
|
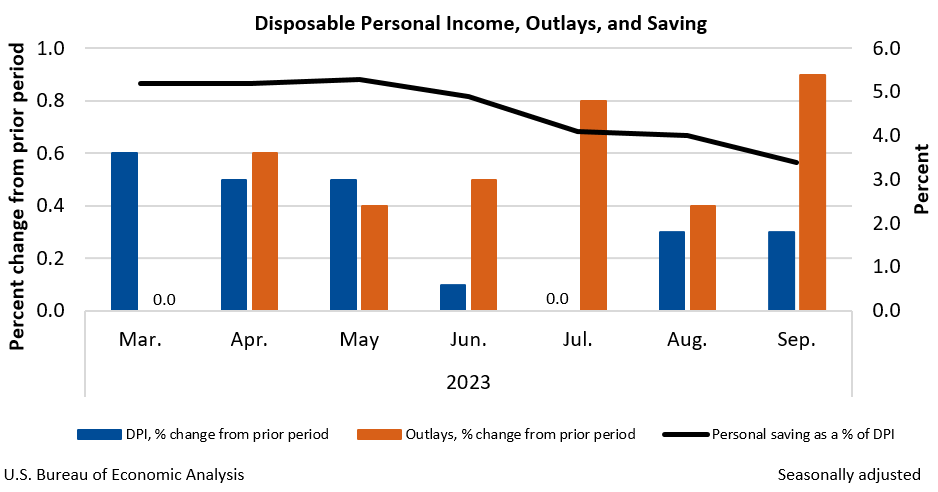
Personal income increased $77.8 billion (0.3 percent at a monthly rate) in September. Disposable personal income (DPI)—personal income less personal current taxes— increased $56.1 billion (0.3 percent). Personal outlays—the sum of personal consumption expenditures (PCE), personal interest payments, and personal current transfer payments—increased $175.1 billion (0.9 percent) and consumer spending increased $138.7 billion (0.7 percent). Personal saving was $687.7 billion and the personal saving rate—personal saving as a percentage of disposable personal income—was 3.4 percent in September.